


 |
PBT501S - PROBABILITY THEORY 1 - 2ND OPP - JAN 2023pdf |
|
|
1 Page 1 |
▲back to top |
nAmlBIA UnlVERSITY
OF SCI En CE Ano TECH n OLOGY
FACULTY OF HEAL TH, APPLIED SCIENCES, AND NATURAL
RESOURCES
DEPARTMENTOF MATHEMATICSAND STATISTICS
QUALIFICATION : BACHELOROF SCIENCE
QUALIFICATION CODE: 07BOSC
COURSE: PROBABILITY THEORY 1
DATE: JANUARY 2023
DURATION: 3 HOURS
LEVEL: 5
COURSE CODE: PBT501 S
SESSION: JANUARY
MARKS: 100
SUPPLEMENTARY/ SECOND OPPORTUNITY EXAMINATION QUESTION PAPER
EXAMINER(S) Dr. D. Ntirampeba
MODERATOR: Mr. J. Amunyela
THIS QUESTION PAPER CONSISTS OF 5 PAGES
(Excluding this front page and statistical tables)
INSTRUCTIONS
1. Answer ALL the questions.
2. Write clearly and neatly.
3. Number the answers clearly.
PERMISSIBLE MATERIALS
1. Non-programable calculator
ATTACHMENTS
1. Statistical tables (Z-Table)
|
|
2 Page 2 |
▲back to top |
QUESTION 1 [45 Marks]
= = = = 1.1. Consider the events A {1,3}, B {2,5}, C {6}, D {3,4} over a possibility space
S = {1,2,3,4,5,6}. With reasons, state whether true or false:
1.1.1. Events A and Care mutually.
[2]
1.1.2. {A, B, C, D} is a partition of the sample space S
[3]
1.1.3. (/JC= {1,2,3,4,5}
[2]
1.1.4. B b. C= {1, 3}
[3]
1.2. Let X be a random variable with the probability mass function
p(x)=(:)o.4x0.65-x x=0,1,2,3,4,5
= 0 otherewise
1.2.1. Find, F(x), the distribution function of the random variable X
[4]
1.2.2. Find the median of X
[2]
1.2.3. Find the mean of X
[2]
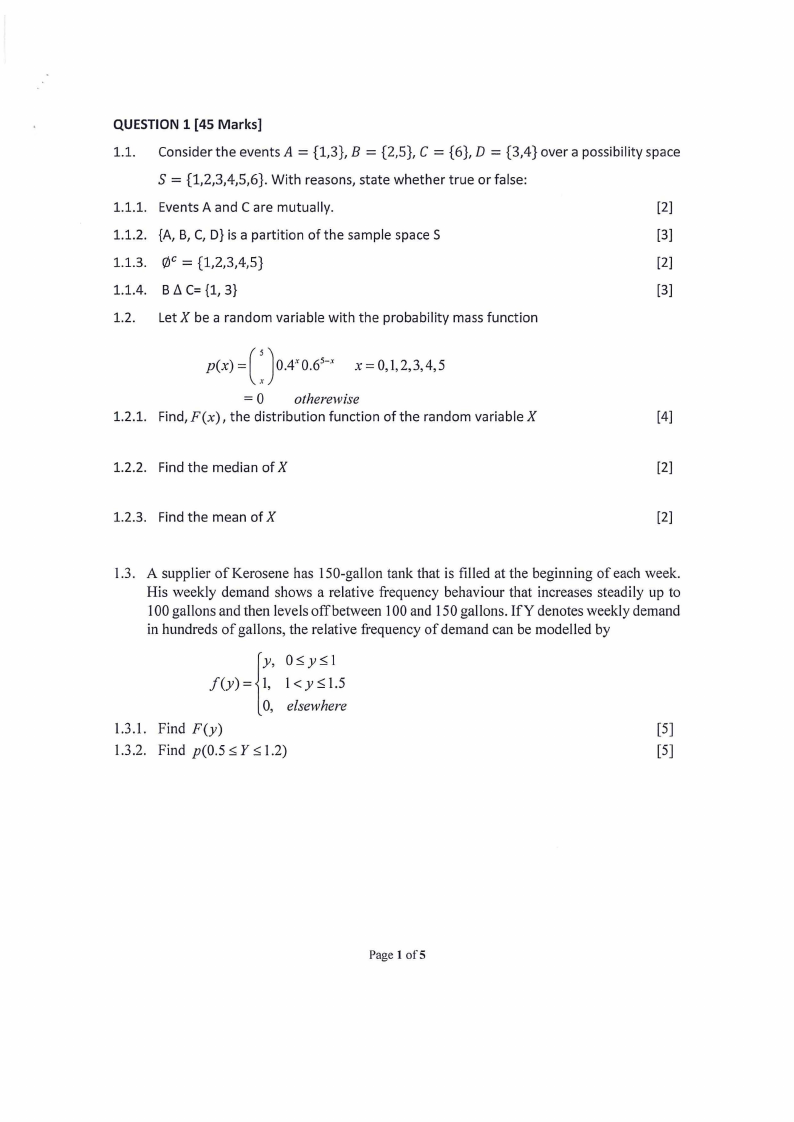
1.3. A supplier of Kerosene has 150-gallon tank that is filled at the beginning of each week.
His weekly demand shows a relative frequency behaviour that increases steadily up to
100 gallons and then levels off between 100 and 150 gallons. IfY denotes weekly demand
in hundreds of gallons, the relative frequency of demand can be modelled by
y, 0~y~l
f(y) = 1, 1< y 1.5
{ 0, elsewhere
1.3.1. Find F(y)
[5]
1.3.2. Find p(0.5::;; Y :s;1; .2)
[5]
PagelofS
|
|
3 Page 3 |
▲back to top |
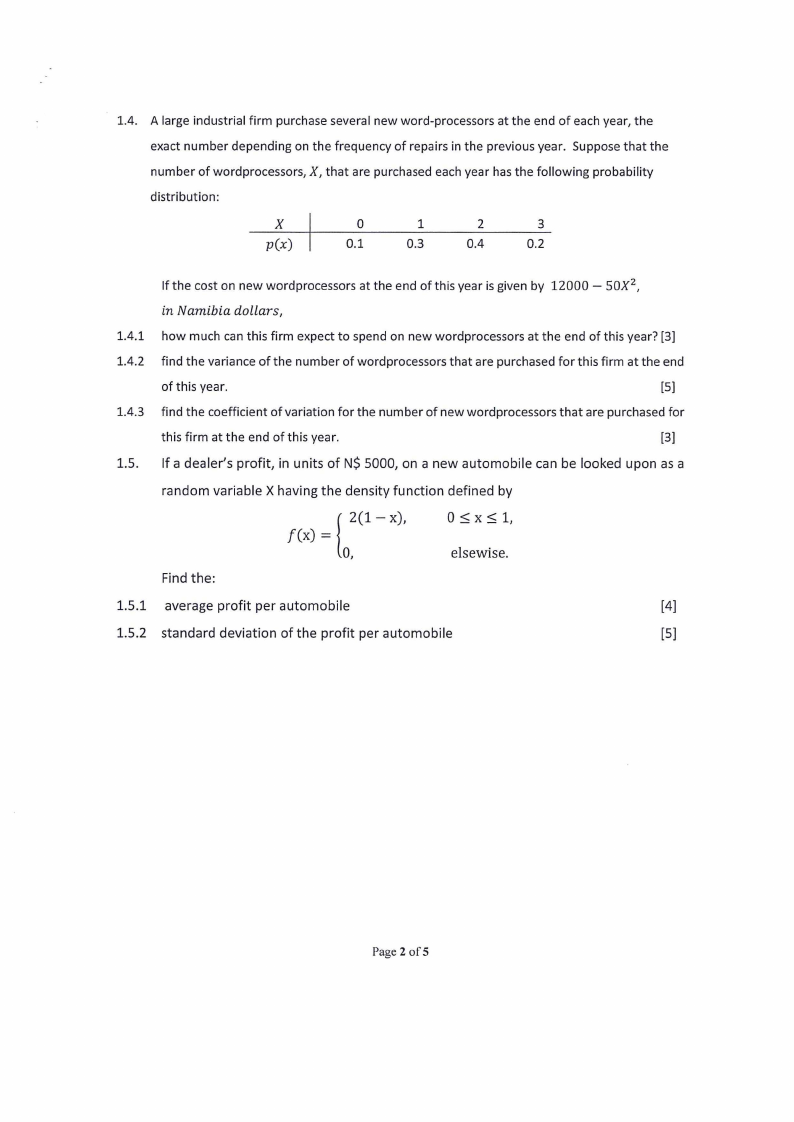
1.4. A large industrial firm purchase several new word-processors at the end of each year, the
exact number depending on the frequency of repairs in the previous year. Suppose that the
number of word processors, X, that are purchased each year has the following probability
distribution:
X
0
1
2
3
p(x)
0.1
0.3
0.4
0.2
If the cost on new word processors at the end of this year is given by 12000 - SOX2,
in Namibia dollars,
1.4.1 how much can this firm expect to spend on new word processors at the end of this year? [3]
1.4.2 find the variance of the number of word processors that are purchased for this firm at the end
of this year.
[5]
1.4.3 find the coefficient of variation for the number of new word processors that are purchased for
this firm at the end of this year.
[3]
1.5. If a dealer's profit, in units of N$ 5000, on a new automobile can be looked upon as a
random variable X having the density function defined by
l2(1- x),
f(x) =
0,
0 $ X $ 1,
elsewise.
Find the:
1.5.1 average profit per automobile
[4]
1.5.2 standard deviation of the profit per automobile
[5]
Page2of5
|
|
4 Page 4 |
▲back to top |
QUESTION 2 [20 Marks]
2.1.
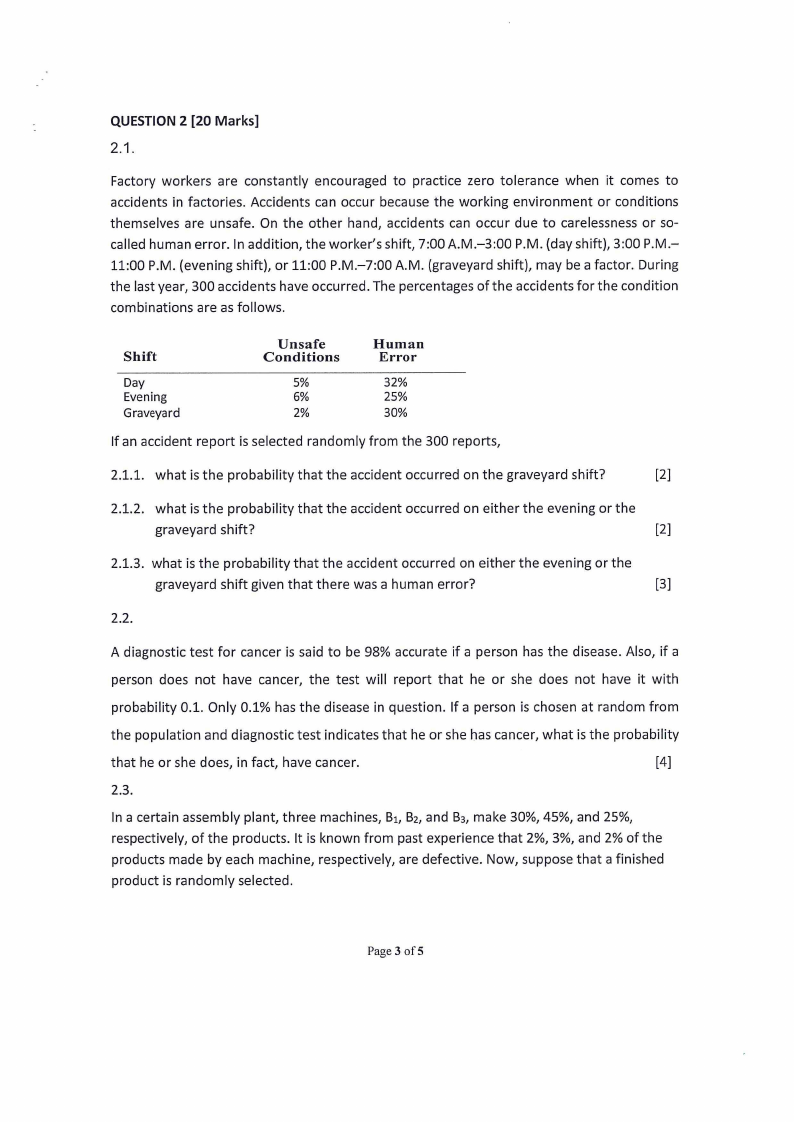
Factory workers are constantly encouraged to practice zero tolerance when it comes to
accidents in factories. Accidents can occur because the working environment or conditions
themselves are unsafe. On the other hand, accidents can occur due to carelessness or so-
called human error. In addition, the worker's shift, 7:00 A.M.-3:00 P.M. (day shift), 3:00 P.M.-
11:00 P.M. (evening shift), or 11:00 P.M.-7:00 A.M. (graveyard shift), may be a factor. During
the last year, 300 accidents have occurred. The percentages of the accidents for the condition
combinations are as follows.
Shift
Day
Evening
Graveyard
Unsafe
Conditions
5%
6%
2%
Human
Error
32%
25%
30%
If an accident report is selected randomly from the 300 reports,
2.1.1. what is the probability that the accident occurred on the graveyard shift?
[2]
2.1.2. what is the probability that the accident occurred on either the evening or the
graveyard shift?
[2]
2.1.3. what is the probability that the accident occurred on either the evening or the
graveyard shift given that there was a human error?
[3]
2.2.
A diagnostic test for cancer is said to be 98% accurate if a person has the disease. Also, if a
person does not have cancer, the test will report that he or she does not have it with
probability 0.1. Only 0.1% has the disease in question. If a person is chosen at random from
the population and diagnostic test indicates that he or she bas cancer, what is the probability
that he or she does, in fact, have cancer.
[4]
2.3.
In a certain assembly plant, three machines, B1,B2,and 83, make 30%, 45%, and 25%,
respectively, of the products. It is known from past experience that 2%, 3%, and 2% of the
products made by each machine, respectively, are defective. Now, suppose that a finished
product is randomly selected.
Page 3 ofS
|
|
5 Page 5 |
▲back to top |
2.3.1. What is the probability that it is defective?
[4]
2.3.2. If a finished product is randomly selected and is found to be defective, what is the
probability that it was made by machine B2?
[3]
2.3.3. If a finished product is randomly selected and is found to be defective, what is the
probability that it was made by machines B1and B2?
[2]
QUESTION 3 [20 Marks]
3.1. University and college students average 7.2 hours of sleep per night, with a standard
deviation of 40 minutes. If the amount of sleep is normally distributed,
3.1.1. What proportion of university and college students sleep for more than 8 hours?
[3]
3.1.2. Find the amount of sleep that is exceeded by only 25% of students.
[5]
3.2. The manager of a gas station has observed that the time required by drivers to fill their
car's tank and pay are quite variable. In fact, times are exponentially distributed with
mean 7.5 minutes. What is the probability that a car onset can complete a transaction
in less than 5 minutes?
[4]
3.3. The number of bank robberies that occur in large north American city is Poisson
distributed with mean of 1.8 per day. Find the probability that between 10 and 12
(both values inclusive) robberies occur during a 5-day period.
[3]
3.4. Major software manufacturers offer a help line that allows customers to call and
receive assistance in solving their problems. However, because of the volume of calls,
customers frequently are put on hold. One software manufacturer claims that. only
20% of callers are put on hold. Suppose that 100 customers call,
3.4.1. what is the expected number of customers that are put on hold?
[2]
3.4.2. what is the standard deviation of the number of customers that are put on hold? [3]
Page 4 of5
|
|
6 Page 6 |
▲back to top |
QUESTION 4[15 Marks]
= = 4.1. A random variable X has a meanµ 10 and a variance CJ2 4. Use Chebyshev's
theorem find
P(S < X < 15)
[5]
4.2
4.2.1. Let X be continuous uniform random variable on the interval [a, b]. show that
E(X) = a+b
[5]
2
4.2.2. A bus arrives every 10 minutes at a bus stop. It is assumed that the waiting time for
a particular individual is a random variable with a uniform distribution. What is the
probability that an individual waits for more than 7 minutes?
[5]
END OF EXAMINATION PAPER
Page 5 ofS
|
|
7 Page 7 |
▲back to top |
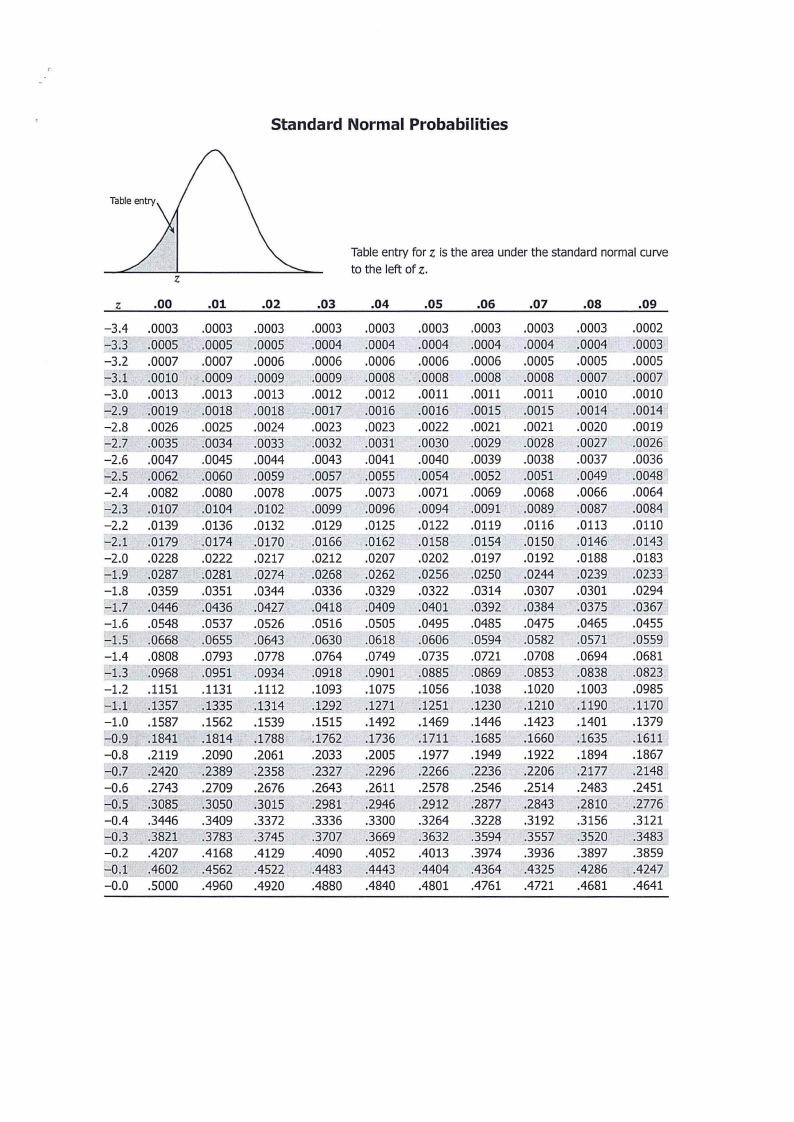
Standard Normal Probabilities
z Table entry for is the area under the standard normal curve
z
to the lelt of z.
z
.00
.01
.02
.03
.04
.OS
.06
.07
.08
.09
-3.4 .0003 .0003
-3.3 .0005 .0005
-3.2 .0007 .0007
:--3,1 .0010 .0009
-3.0 .0013 .0013
L2,9 .0019 .0018
-2.8 .0026 .0025
,-2.7 .0035- ~003·4
-2.6 .0047 .0045
-2.5 .0062 .0060
-2.4 .0082 .0080
::_2.3 .0107 .0104
-2.2 .0139 .0136
=-2.1 .0179 _.:.._](74
-2.0 .0228 .0222
-1.9 .0287- .0281
-1.8 .0359 .0351
r_l,7 .0446 ~0436
-1.6 .0548 .0537
;::J_j .!)668 .0655
-1.4 .0808 .0793
-1.3 .0968 .0951
-1.2 .1151 .1131
;-l.1 .1357 .1335
-1.0 .1587 .1562
-0.9 .1841 .1814
-0.8 .2119 .2090
-0.7 .2420 .2389
-0.6 .2743 .2709
-0.5 )@5 -~_050
-0.4 .3446 .3409
-0.3 .3821 .3:Z83
-0.2 .4207 .4168
:...o.i .4602 .4562
-0.0 .5000 .4960
.0003
.0005
.0006
.0009
.0013
.0018
.0024
,
-
:0033
.0044
.0059
.0078
.0102
.0132
.0170
.0217
.0274
.0344
.0427
.0526
.0§.43
.0778
.0934
.1112
.1314
.1539
.1788
.2061
.2358
.2676
.~Q15
.3372
.3745
.4129
.4522
.4920
.0003 .0003
.0004 .0004
.0006 .0006
.0009 .0008
.0012 .0012
.0017 .0016
.0023 .0023
.0032 - .0031
.0043 .0041
.0057 .0055
.0075 .0073
.0099 .0096
.0129 .0125
.0166 .0162
.0212 .0207
.0268 .0262
.0336 .0329
.0418 .0409
.0516 .0505
.0~30 .0618
.0764 .0749
.0918 .0901
.1093 .1075
.1292 .1271
.1515 .1492
.1762 .1736
.2033 .2005
.2327 .2296
.2643 .2611
.2981 .2946
.3336 .3300
.3707 .3669
.4090 .4052
.4483 .4443
.4880 .4840
.0003
.0004
.0006
.0008
.0011
.0016
.0022
.0036
.0040
.0054
.0071
.0094
.0122
.0158
.0202
.0256
.0322
.0401
.0495
.0606
.0735
.0885
.1056
.1251
.1469
.1711
.1977
.2266
.2578
.2912
.3264
.3632
.4013
.4404
.4801
.0003
.0004
.0006
.0008
.0011
.0015
.0021
.0029
.0039
.0052
.0069
.0091
.0119
.0154
.0197
.0250
.0314
.0392
.0485
.0594
.0721
.0869
.1038
.1230
.1446
.1685
.1949
.2236
.2546
.2877
.3228
.3594
.3974
.4364
.4761
.0003
.0004
.0005
.0008
.0011
.0015
.0021
.0028
.0038
.005·1
.0068
.0089
.0116
.0150
.0192
.0244
.0307
.0384
.0475
.0582
.0708
.0853
.1020
.1210
.1423
:1660
.1922
.2206
.2514
.2843
.3192
.3557
.3936
.4325-
.4721
.0003
.0004
.0005
.0007
.0010
.0014
.0020
.0027
.0037
.0049
.0066
.0087
.0113
.0146
.0188
.0239
.0301
.0375
.0465
.0571
.0694
.0838
.1003
.1190
.1401
.i635
.1894
.2177
.2483
.2810
.3156
.3520
.3897
.4286
.4681
.0002
.0003 ·
.0005
.0007
.0010
.0014
.0019
.0026
.0036
.0048
.0064
.0084
.0110
.0143
.0183
.0233
.0294
.0367
.0455
.0559
.0681
.0823
.0985
.1170
.1379
.1611
.1867
.2148
.2451
.. 2776
.3121
.3483
.3859
-~4247
.4641
|
|
8 Page 8 |
▲back to top |
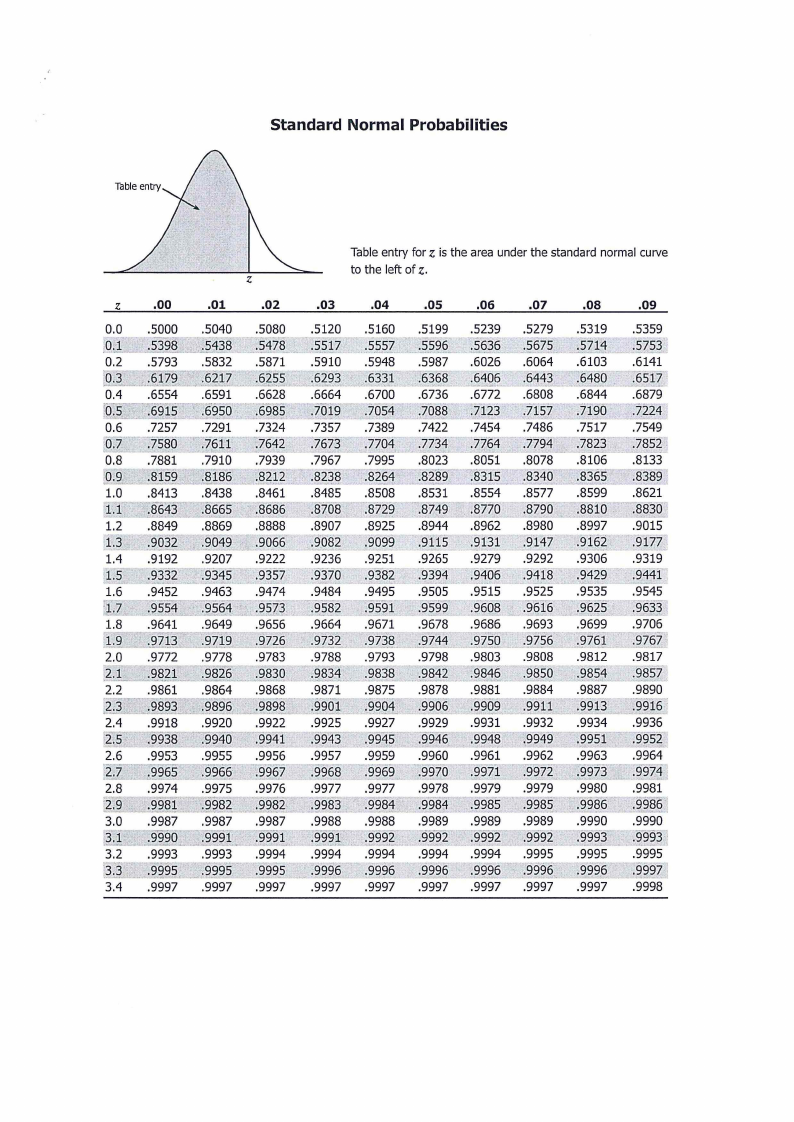
Standard Normal Probabilities
Table entry for z is the area under the standard normal curve
z
to the le~ of z.
z .00
.01
.02
.03
.04
.OS
.06
.07
.08
.09
0.0
.5080
iO)
:5478
0.2 .5793 .5832
i0.3
0.4 .6554 .6591
10.5 ~6915~6950
0.6
:-o.7
J.s72s5c7 f
·-.7:2-9i16u
.7324
.7642
0.8 .7881 .7910 .7939
.5120
. .5517
.5910
.6664
.7357
. 7673 -
.7967
.8413 .8438
.8485
.8686 .8708
1.2 .8849
.8907
i.~. ;9032,
.9082
1.4 .9192 .9207 .9222 .9236
1.5 .9332 .9345 .9357 .9370
.9452 .9463
.9484
0
_:95§2
.9641 .9649 .9656 .9664
-~Z:!) .9719 .9726 - .~732
2.0 .9772 .9778 .9783 .9788
_2.1 .9821
.9830 .9834_
2.2 .9861 .9864
:2.3 ;9893 .,~896_
2.4 .9918 .9920 .9922 .9925
2.5 .9938~·9940
.9953
.9956
2.8 .9974 .9975 .9976 .9977
.9987 .9988
3.2 .9993 .9993
'IT· ,. :~-~95_,=;9995.
3.4 .9997 .9997
.9994 .9994
.9995 .9995
,<.
.9997 .9997
.5160 .5199
.5557 .55~2,_
.5948 .5987
.6331 .63.§8
.6700 .6736
• ')o~8
.7389 .7422
:1764 .7734..
.7995 .8023
.8289
.8508 .8531
.8729 "'.8749
.8925 .8944
.9099 .9115
.9251 .9265
.9382 .9394
.9495 .9505
.9591 .9599
.9671 .9678
.973.~ .9744
.9793 .9798
.9838 .9842
.9875
.9927
.9959
.9969
.9977
.9984
.9988
.999]
.9994
.9996
.9997
.9960
.9970
.9994
.9996
.9997
.5239
.~6
.6026
.5279 .5319 .5359
.5675 ,u,5,~1,1 -~?53 l
.6064 .6103 .6141
.6406 .6443 .6480 .6517
.6772 .6808 .6844 .6879
.7123 ....":7157 "')19~~.7:224 1
.7454 .7486 .7517 .7549
.7764 .7794 .782:r
.8051 .8078 .8106
.8315 .8340 .8365
.8554 .8577 .8599
.8170 :8.790 .8. 810
.8962 .8980 .8997 .9015
.9131 .9147
.9279 .9292
.9162
.9306
.91?L
.9319
.9406 .9418 .94~9 .9441
.9515 .9525 .9535 .9545
.9608 :§616 .9625'
.9686 .9693 .9699
.fil!L .~756 .9761
.9706
.9767 i
.9817
.9857
.9884 .9887 .9890
""]915,!
.9931 .9932 .9934 .9936
:9951 .9952,
.9961
.9971
.9979
'.§972
.9979
.9963
.9973
.9980
.9964
.99741
.9981
.9985 , .9986
.9989 .9990
.9992 ·'.9993
.9986
,,...;i
.9990
,9993,'.
.9994
.9996
.9997
.9995 .9995
.9996. .9996
.9997 .9997
.9995
.~i997;
.9998