


 |
RMC811S - RESEARCH METHODS FOR NATURAL SCIENCES - 1ST OPP - JULY 2023 |
|
|
1 Page 1 |
▲back to top |

n Am I B I A u n IVE Rs I TY
OF SCIEnCE Ano TECHnOLOGY
FACULTY OF HEALTH, NATURAL RESOURCES AND APPLIED SCIENCES
SCHOOL OF AGRICULTURE AND NATURAL RESOURCE SCIENCES
DEPARTMENT OF NATURAL RESOURCESSCIENCES
QUALIFICATION: BACHELOR OF NATURAL RESOURCES MANAGEMENT HONOURS
QUALIFICATION CODE: 08BNRH
COURSE CODE: RMC811S
LEVEL: 8
COURSE NAME: RESEARCHMETHODS FOR NATURAL
SCIENCES
DATE: JULY 2023
DURATION: 3 HOURS
MARKS: 100
SECOND OPPORTUNITY/SUPPLEMENTARY EXAMINATION QUESTION PAPER
EXAMINER(S) Dr Tendai Nzuma (Section A: Scientific Writing)
Dr Meed Mbidzo (Section B: Statistics)
MODERATOR: Dr M. Mwale
INSTRUCTIONS
1. Answer ALL the questions.
2. Write clearly and neatly.
3. Number the answers clearly.
PERMISSIBLE MATERIALS
1. Examination question paper
2. Answering book
3. Calculator
THIS QUESTION ~APER CONSISTS OF 5 PAGES (Excluding this front page)
|
|
2 Page 2 |
▲back to top |
SECTION A: SCIENTIFIC WRITING
QUESTION 1
Discussthe importance of ethical considerations in scientific research and provide an example [10]
of an ethical issue that researchers in Namibia may face.
QUESTION 2
Describe the process of peer review in scientific publishing and explain its importance. Provide [10]
an example of a peer-reviewed article from a journal published in Namibia.
QUESTION 3
Explain the concept of plagiarism and its consequences in scientific writing. Provide an example [10]
of plagiarism from a research article conducted in Namibia.
SECTION B: STATISTICS
QUESTION 4
What statistical procedure would you use for the following research questions and/or
[10]
scenarios?
a) Concentrations of nitrogen oxides was determined in two urban suburbs. You want to test (2)
the hypothesis that the air pollutant was present in the same concentrations in the two
suburbs.
b) A researcher wants to determine if there is a relationship between soil moisture content
(2)
and nitrogen mineralization rates.
c) A researcher wishes to analyse how gender influences participation of local communities in (2)
natural resource decision making. Specifically, individual's attendance of meetings was
determined.
d) Based on an anxiety score, students are divided into three groups: "low-stressed students", (2)
"moderately-stressed students" and "highly-stressed students. Exam performance is
measured from 1 to 100. You want to test the hypothesis that exam performance differs
based on exam anxiety levels amongst students? Assume that the data violates the
assumptions of a parametric test.
e) Interest in conservation is believed to be influenced by level of education. Participants were (2)
classified into three groups according to their highest level of education; "high school",
"college" or "university", in that order; The researcher is interested in determining whether the
effect of education level on interest in conservation was different depending on gender.
QUESTION 5
A wildlife ecologi~t is interested in investigating whether springbok foreleg and hindleg length are [20]
the same. To find this out, the ecologist measured the length of the left foreleg and left hind leg for
ten (10) springboks. Use the SPSSoutputs provided to answer questions that follow.
a) What statistical test would you use to investigate whether the left foreleg and left hind leg (2)
1
|
|
3 Page 3 |
▲back to top |

lengths of springbok are equal or not.
b) State the null and alternative hypotheses for this investigation.
(2)
c) Is the assumption of normality met or violated? Explain and provide evidence for your
(3)
answer.
d) State whether the assumption of outliers is met or not (Explain and provide evidence for
(3)
your answer.
e) Report on the descriptive statistics of the lengths of the springbok forelegs and hind legs.
(4)
f) Determine whether forelegs and hind legs of springbok were statistically significantly
(6)
different in length.
Kolmogorov-Smirnov•
Statistic
df
Sig.
Difference
.291
10
.017
a. Lilliefors Significance Correction
Shapiro-Wilk
Statistic
df
.814
10
Sig.
.021
6.00
,.oo
1.00
.00
-2.00
-4.00
Difference
Pair 1
Hindleg length in cm
Foreleg length in cm
Statistics
Mean
N
Std. Deviation Std. Error Mean
144.7000
10
3.40098
1.07548
141.4000
10
4.03320
1.27541
2
|
|
4 Page 4 |
▲back to top |

Pair Hindleg length in
1 cm - Foreleg
length in cm
Paired Differences
95% Confidence
Interval of the
Std. Std. Error
Difference
Mean Deviation Mean
Lower
Upper
3.30000 3.05687 .96667 1.11325 5.48675
t
3.414
df
9
Sig. (2-
tailed)
.008
QUESTION 6
A researcher is interested in determining whether the effect of education level on interest in
[20]
conservation was different for male and female. Use the SPSSoutputs provided to answer the
question that follow.
a) What statistical test would you use to determine whether the effect of education level on (2)
interest in conservation is different for males and females (i.e.,
different depending on gender)?
b) State whether the assumption of normality in the test mentioned in (a) is met or not.
(4)
c) State whether the assumption of homogeneity of variances is met or not.
(4)
d) Explain how profile plots can be used to determine whether an interaction exists between (5)
two independent variables.
e) Determine whether there is a statistically significant interaction effect between gender and (5)
education level.
Kolmogorov-
Smirnov•
Shapiro-Wilk
Gender Level of education
Statistic df Sig. Statistic df Sig.
Male School
College
University
Female School
Residual for
.143 9 .200· .981 9 .971
conservation - interest
Residual for
.157 9 .200· .957 9 .761
conservation - interest
Residual for
.213 10 .200· .915 10 .320
conservation - interest
Residual for
.112 10 .200· .963 10 .819
conservation - interest
3
|
|
5 Page 5 |
▲back to top |

College
University
Residual for
.112
conservation - interest
Residual for
.139
conservation - interest
10 .200· .963
10 .200· .950
10 .819
10 .668
Conservation interest
Based on Mean
Based on Median
Based on Median and
with adjusted df
Based on trimmed mean
Levene
Statistic
2.269
2.205
2.205
dfl
5
5
5
df2
52
52
27.511
Sig.
.061
.068
.083
2.263
5
52
.062
Tests of Between-Subjects Effects
Dependent Variable: Conservation interest
Source
Type Ill Sum of
Squares
df
Corrected Model
5645.998.
5
Intercept
132091.906
1
gender
8.420
1
education - level
5446.697
2
gender* education_level
210.338
2
Error
747.644
52
Total
140265.750
58
Corrected Total
6393.642
57
a. R Squared = .883 (Adjusted R Squared= .872)
Mean Square F
1129.200
78.538
132091.906
9187.227
8.420
.586
2723.348
189.414
105.169
7.315
14.378
Partial Eta
Sig. Squared
.000 .883
.000 .994
.448 .011
.000 .879
.002 .220
QUESTION 7
Discuss how you would deal with outliers resulting from the following:
[10]
a) Data entry error
(2)
b) Measurement errors
(3)
c) Genuinely unusual values
(5)
4
|
|
6 Page 6 |
▲back to top |
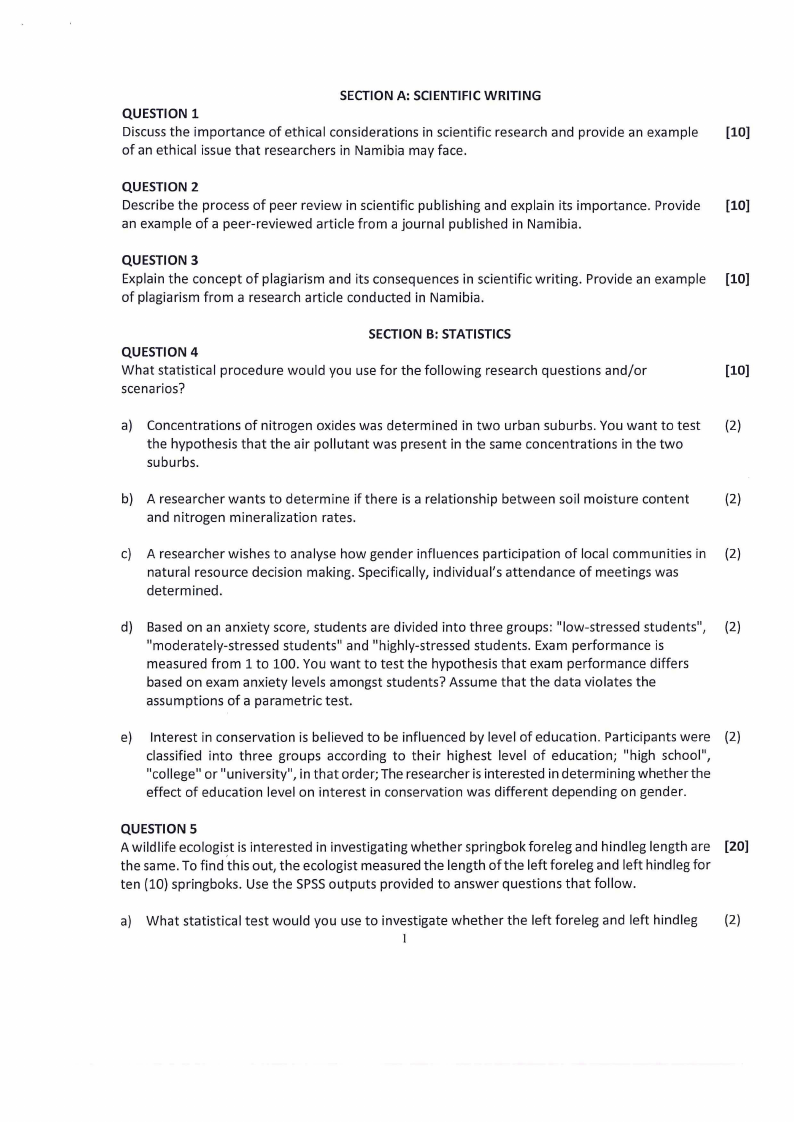
QUESTION 8
For each of the figures and additional information given below, provide a verbal description of [10]
the results.
a)
i-------------------------.
(4)
750
y = 88.504x + 326.33
::§700
"C
Q)
R2 = 0.5273
650
"C
0
600
V'I
"C
QI 550
Q)
Vl
'c5500
V'I
V'I
2ro 450
400
1.5
2
2.5
3
3.5
4
4.5
Plant Density {individuals per square meter)
b)
(3)
2500
"C
0
<II
V::,, 2000 ·
.0 .
<II
c..
1500
·1
...-<E11--lh
...OZ
I
.!: 1000 1
...V,
<II
I
5 500 J
C
"<II'
I
:E
0
Poor
I
1871
1599
Middle
Rich
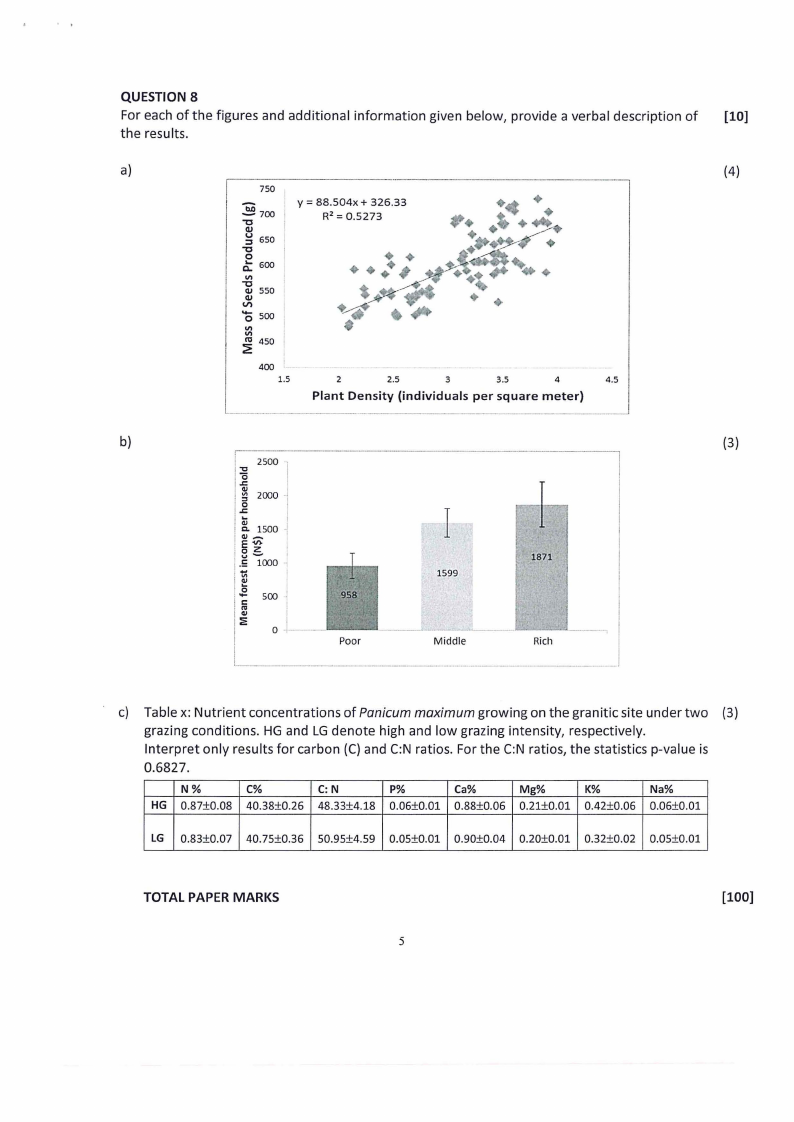
c) Table x: Nutrient concentrations of Panicum maximum growing on the granitic site under two (3)
grazing conditions. HG and LGdenote high and low grazing intensity, respectively.
Interpret only results for carbon (C) and C:N ratios. For the C:N ratios, the statistics p-value is
0.6827.
N%
C%
C:N
P%
Ca%
Mg%
K%
Na%
HG 0.87±0.08 40.38±0.26 48.33±4.18 0.06±0.01 0.88±0.06 0.21±0.01 0.42±0.06 0.06±0.01
LG 0.83±0.07 40.75±0.36 50.95±4.59 0.05±0.01 0.90±0.04 0.20±0.01 0.32±0.02 0.05±0.01
TOTAL PAPER MARKS
5
[100]