


 |
RMC811S - RESEARCH METHODS FOR NATURAL SCIENCES - 1ST OPP - JUNE 2023 |
|
|
1 Page 1 |
▲back to top |
n Am I BI A u n IVE Rs ITY
OF SCIEnCE Ano TECHnOLOGY
FACULTYOF HEALTH,NATURAL RESOURCESAND APPLIEDSCIENCES
SCHOOL OF AGRICULTURE AND NATURAL RESOURCE SCIENCES
DEPARTMENT OF NATURAL RESOURCES SCIENCES
QUALIFICATION: BACHELOR OF NATURAL RESOURCES MANAGEMENT HONOURS
QUALIFICATION CODE: 08BNRH
COURSE CODE: RMC811S
LEVEL: 8
COURSE NAME: RESEARCHMETHODS FOR NATURAL
SCIENCES
DATE: JUNE 2023
DURATION: 3 HOURS
MARKS: 100
FIRSTOPPORTUNITY EXAMINATION QUESTION PAPER
EXAMINER(S) Dr Tendai Nzuma (Section A: Scientific Writing)
Dr Meed Mbidzo (Section B: Statistics)
MODERATOR: Dr M. Mwale
INSTRUCTIONS
1. Answer ALL the questions.
2. Write clearly and neatly.
3. Number the answers clearly.
PERMISSIBLEMATERIALS
l. Examination question paper
2. Answering book
3. Calculator
THIS QUESTION PAPER CONSISTS OF 6 PAGES (Excluding this front page)
|
|
2 Page 2 |
▲back to top |
SECTION A: SCIENTIFIC WRITING
QUESTION 1
Explain the structure of a scientific research paper and the purpose of each section. [15]
QUESTION 2
Describe the characteristics of a good scientific abstract and provide an example of [5]
an abstract from a research article conducted in Namibia.
QUESTION 3
Discussthe importance of citing sources in scientific writing, and provide an example [10]
of a correctly cited reference from a research article using a referencing style you
have learnt.
SECTION B: STATISTICS
QUESTION 4
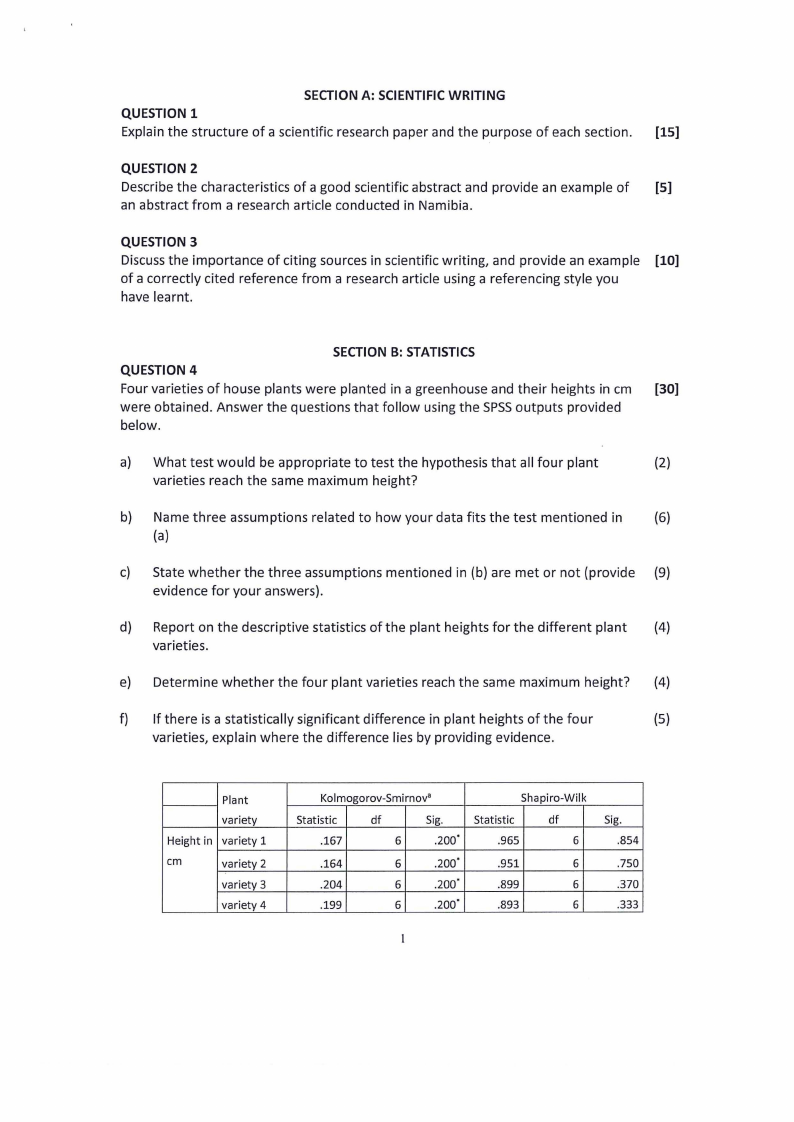
Four varieties of house plants were planted in a greenhouse and their heights in cm [30]
were obtained. Answer the questions that follow using the SPSSoutputs provided
below.
a) What test would be appropriate to test the hypothesis that all four plant
(2)
varieties reach the same maximum height?
b) Name three assumptions related to how your data fits the test mentioned in (6)
(a)
c) State whether the three assumptions mentioned in (b) are met or not (provide (9)
evidence for your answers).
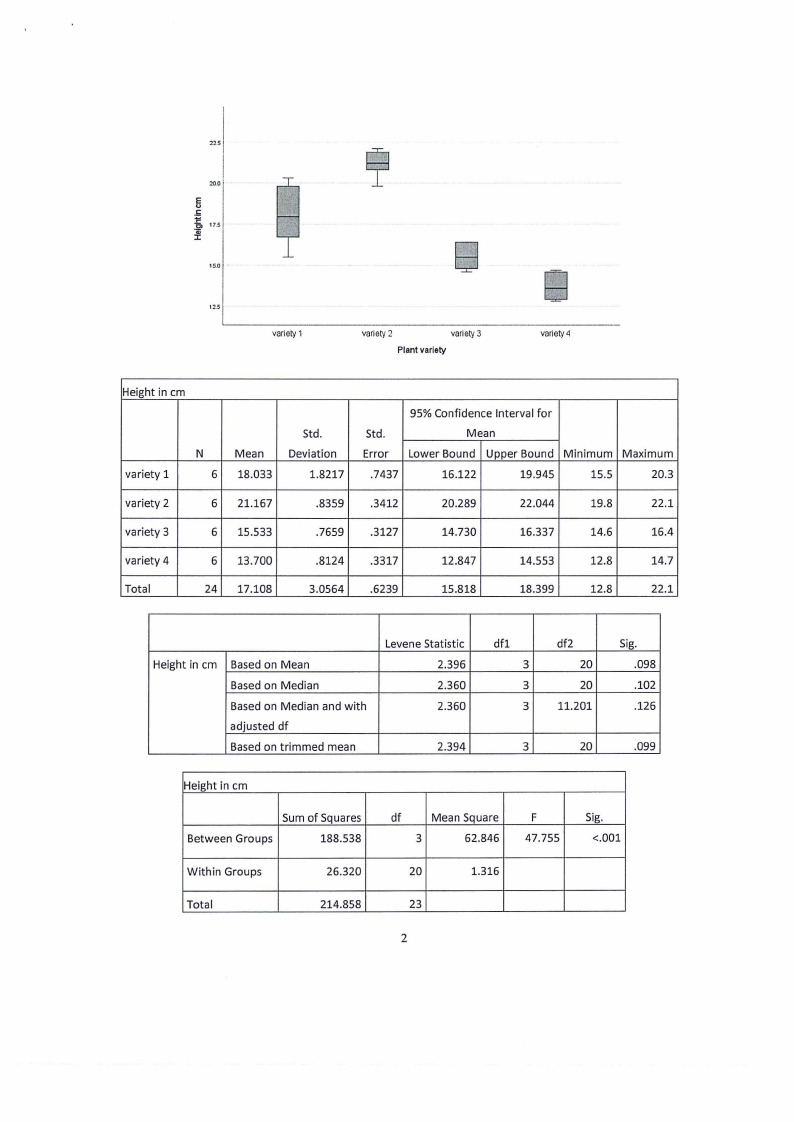
d) Report on the descriptive statistics of the plant heights for the different plant (4)
varieties.
e) Determine whether the four plant varieties reach the same maximum height? (4)
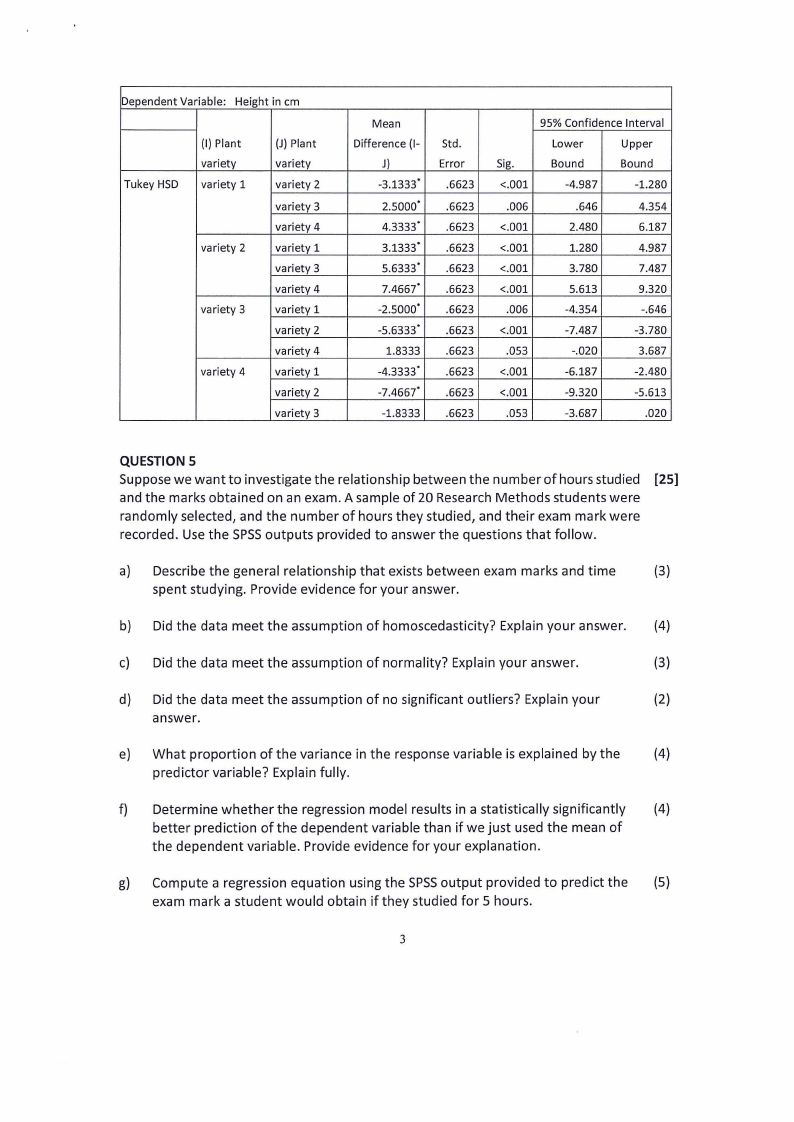
f) If there is a statistically significant difference in plant heights of the four
(S)
varieties, explain where the difference lies by providing evidence.
Plant
variety
Height in variety 1
cm
variety 2
variety 3
variety 4
Kolmogorov-Smirnov'
Statistic
df
Sig.
.167
6
.200·
.164
6
.200·
.204
6
.200·
.199
6
.200·
Shapiro-Wilk
Statistic
.965
df
6
.951
6
.899
6
.893
6
Sig.
.854
.750
.370
.333
|
|
3 Page 3 |
▲back to top |
:22.S
20.0
Eu
_i;;
t 17.S
1S.O
12.S
variety 1
8
variety 2
variety 3
Plant variety
B
variety4
Height in cm
variety 1
N
6
Mean
18.033
Std.
Deviation
1.8217
95% Confidence Interval for
Std.
Mean
Error Lower Bound Upper Bound Minimum Maximum
.7437
16.122
19.945
15.5
20.3
variety 2
6 21.167
.8359 .3412
20.289
22.044
19.8
22.1
variety 3
6 15.533
.7659 .3127
14.730
16.337
14.6
16.4
variety 4
6 13.700
.8124 .3317
12.847
14.553
12.8
14.7
Total
24 17.108
3.0564 .6239
15.818
18.399
12.8
22.1
Height in cm Based on Mean
Based on Median
Based on Median and with
adjusted df
Based on trimmed mean
Levene Statistic
2.396
2.360
2.360
2.394
dfl
3
3
3
3
df2
20
20
11.201
Sig.
.098
.102
.126
20
.099
Height in cm
Sum of Squares
Between Groups
188.538
Within Groups
26.320
Total
214.858
df
Mean Square
3
62.846
F
47.755
20
1.316
23
2
Sig.
<.001
|
|
4 Page 4 |
▲back to top |
Dependent Variable: Height in cm
Tukey HSD
(I) Plant
variety
variety 1
variety 2
variety 3
variety 4
(J) Plant
variety
variety 2
variety 3
variety 4
variety 1
variety 3
variety 4
variety 1
variety 2
variety 4
variety 1
variety 2
variety 3
Mean
Difference (I-
J)
-3.1333.
2.5000·
4_3333•
3_1333·
5.6333.
7.4667.
-2.5000·
-5.6333.
1.8333
-4.3333'
-7.4667.
-1.8333
Std.
Error
.6623
.6623
.6623
.6623
.6623
.6623
.6623
.6623
.6623
.6623
.6623
.6623
95% Confidence Interval
Lower
Upper
Sig.
Bound
Bound
<.001
-4.987
-1.280
.006
.646
4.354
<.001
2.480
6.187
<.001
1.280
4.987
<.001
3.780
7.487
<.001
5.613
9.320
.006
-4.354
-.646
<.001
.053
-7.487
-.020
-3.780
3.687
<.001
-6.187
-2.480
<.001
-9.320
-5.613
.053
-3.687
.020
QUESTION 5
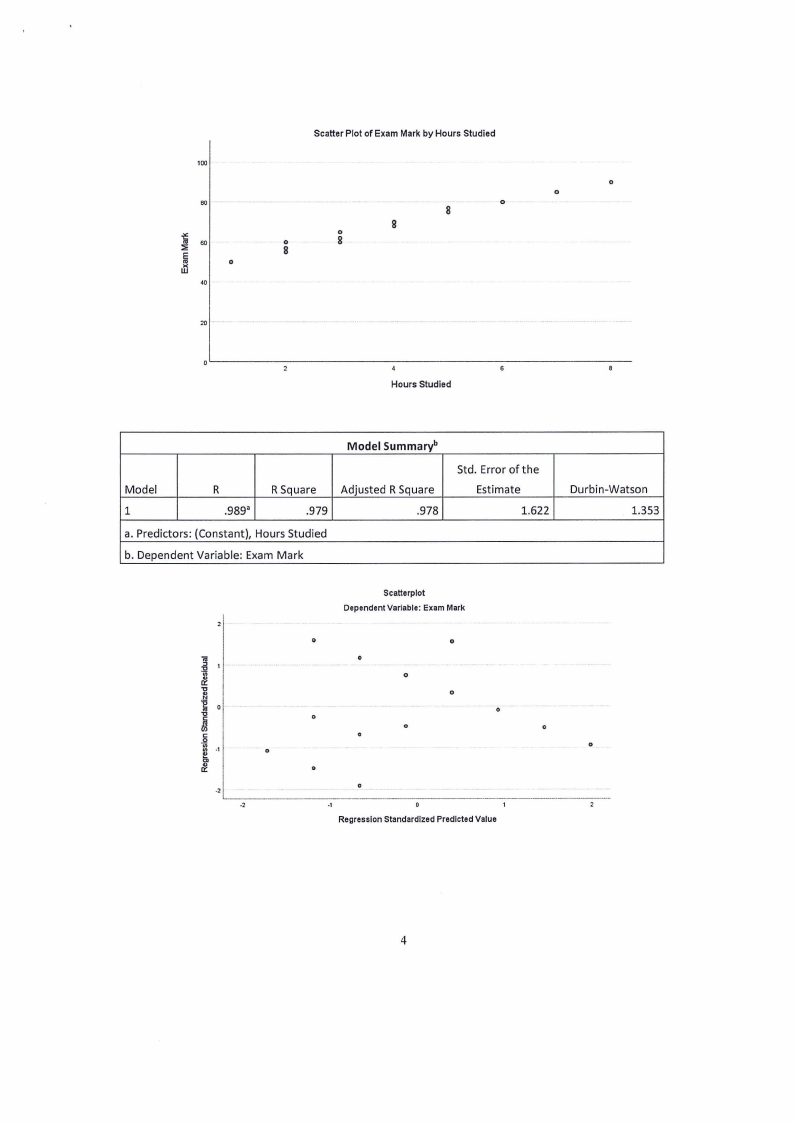
Suppose we want to investigate the relationship between the number of hours studied [25)
and the marks obtained on an exam. A sample of 20 Research Methods students were
randomly selected, and the number of hours they studied, and their exam mark were
recorded. Use the SPSSoutputs provided to answer the questions that follow.
a) Describe the general relationship that exists between exam marks and time
(3)
spent studying. Provide evidence for your answer.
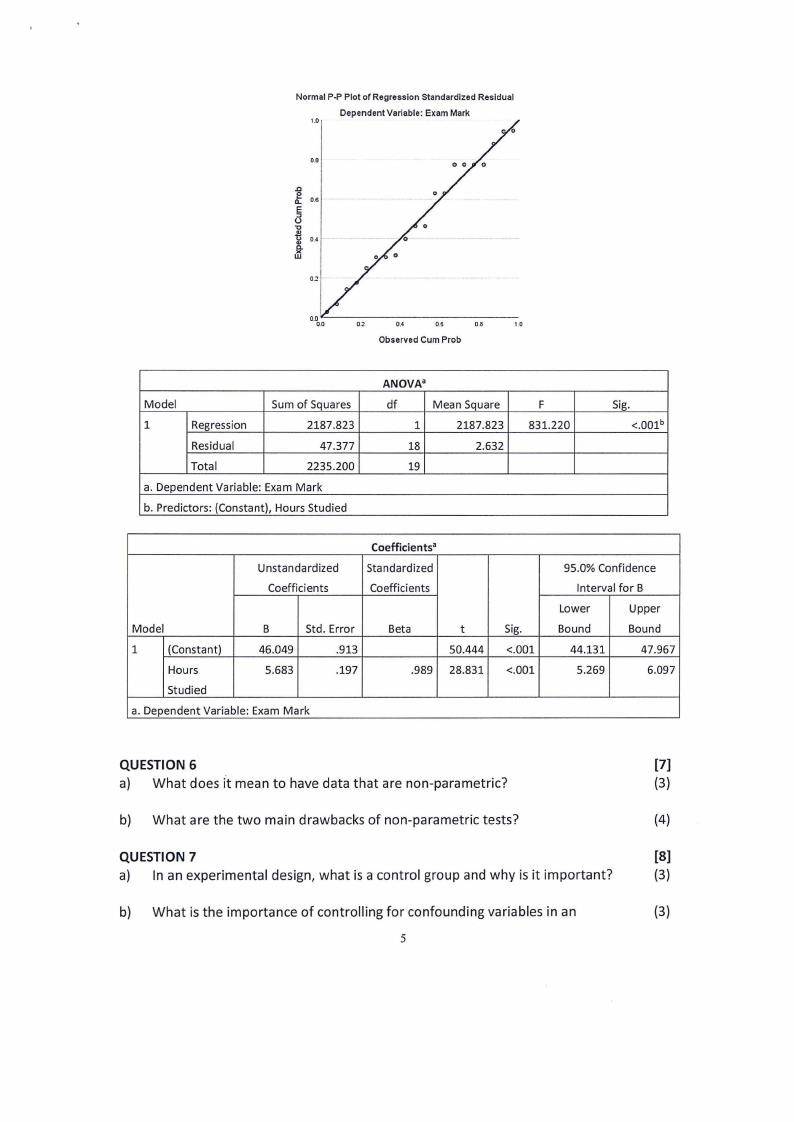
b) Did the data meet the assumption of homoscedasticity? Explain your answer. (4)
c) Did the data meet the assumption of normality? Explain your answer.
(3)
d) Did the data meet the assumption of no significant outliers? Explain your
(2)
answer.
e) What proportion of the variance in the response variable is explained by the
(4)
predictor variable? Explain fully.
f) Determine whether the regression model results in a statistically significantly (4)
better prediction of the dependent variable than if we just used the mean of
the dependent variable. Provide evidence for your explanation.
g) Compute a regression equation using the SPSSoutput provided to predict the (5)
exam mark a student would obtain if they studied for 5 hours.
3
|
|
5 Page 5 |
▲back to top |
Scatter Plot of Exam Mark by Hours Studied
100
0
0
80
0
8
::;; 60
8
0
0
8
8
wX
0
,o
20 .
Hours Studied
Model Summaryb
Model
R
R Square Adjusted R Square
1
.989"
.979
.978
a. Predictors: (Constant), Hours Studied
b. Dependent Variable: Exam Mark
Std. Error of the
Estimate
1.622
Durbin-Watson
1.353
Scatterplot
Dependent Variable: Exam Mark
0
0
"::,
e,",r
"N
,, 0
0
0
0
0
0
0
0
C
0
"e .,
0
0
Cl
e" r
0
.,
0
.,
_,
Regression Standardized Predicted Value
4
|
|
6 Page 6 |
▲back to top |
Normal P-P Plot of Regression Standardized Residual
Dependent Variable: Exam Mark
O.B
e.a
Q. 0.6
uE:::,
-c
t.l,
a.
wX
02
Observed Cum Prob
Model
Sum of Squares
1
Regression
2187.823
Residual
47.377
Total
2235.200
a. Dependent Variable: Exam Mark
b. Predictors: (Constant), Hours Studied
ANOVA"
df
Mean Square
1
2187.823
18
2.632
19
F
831.220
Sig.
<.0Olb
Unstandardized
Coefficients
Coefficients•
Standardized
Coefficients
Model
B
Std. Error
1
(Constant)
46.049
.913
Hours
5.683
.197
Studied
a. Dependent Variable: Exam Mark
Beta
.989
t
50.444
28.831
Sig.
<.001
<.001
95.0% Confidence
Interval for B
Lower
Upper
Bound
Bound
44.131
47.967
5.269
6.097
QUESTION 6
[7]
a) What does it mean to have data that are non-parametric?
(3)
b) What are the two main drawbacks of non-parametric tests?
(4)
QUESTION 7
[8]
a) In an experimental design, what is a control group and why is it important?
(3)
b) What is the importance of controlling for confounding variables in an
(3)
5
|
|
7 Page 7 |
▲back to top |
experimental design?
c) Define a simple random sample.
PAPERTOTAL MARKS
(2)
[100]
6