


 |
RAA602S - REGRESSION ANALYSIS AND ANOVA - 1ST OPP - NOVEMBER 2023 |
|
|
1 Page 1 |
▲back to top |
nAml BIA un IVERS ITY
OF SCIEnCEAnDTECHn0L0GY
Facultyof Health,Natural
ResourceasndApplied
Sciences
Schoolof NaturalandApplied
Sciences
Department of Mathematics,
Statistics and Actuarial Science
13JacksonKaujeuaStreet
Private Bag13388
Windhoe~
NAMIBIA
T: +264612072913
E: msas@nust.na
Vi/;wwv,.nust.na
QUALIFICATION: BACHELOR OF SCIENCE IN APPLIED MATHEMATICS AND STATISTICS
QUALIFICATION CODE: 07BSAM
LEVEL: 6
COURSE:REGRESSION ANALYSIS AND ANOVA
COURSECODE: RAA602S
DATE: NOVEMBER 2023
SESSION: 1
DURATION: 3 HOURS
MARKS: 100
EXAMINER:
MODERATOR:
FIRST OPPORTUNITY: QUESTION PAPER
Simon Pombili Kashihalwa
Prof Rakesh Kumar
INSTRUCTIONS:
1. Answer all questions on the separate answer sheet.
2. Please write neatly and legibly.
3. Do not use the left side margin of the exam paper. This must be allowed for the
examiner.
4. No books, notes and other additional aids are allowed.
5. Mark all answers clearly with their respective question numbers.
PERMISSIBLE MATERIALS:
1. Non-Programmable Calculator
ATTACHEMENTS
1. t- Table
This paper consists of 4 pages including this front page
|
|
2 Page 2 |
▲back to top |
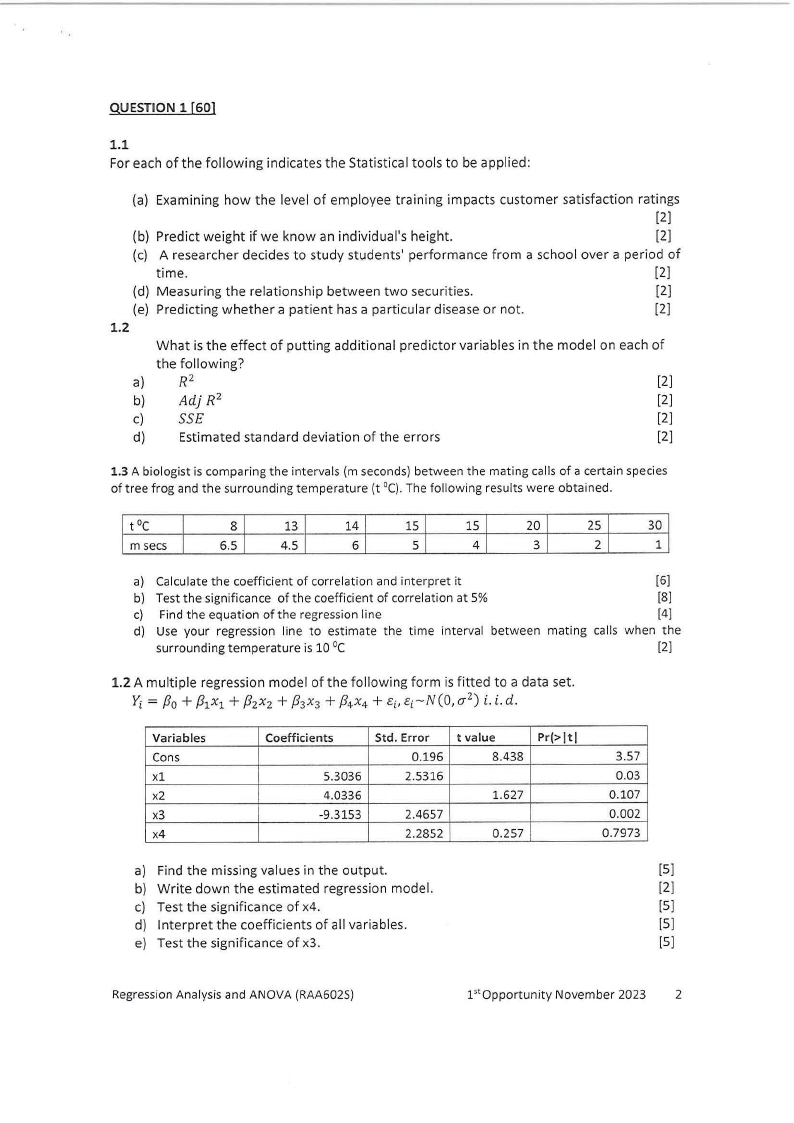
QUESTION 1 [60)
1.1
For each of the following indicates the Statistical tools to be applied:
(a) Examining how the level of employee training impacts customer satisfaction ratings
[2]
(b) Predict weight if we know an individual's height.
[2]
(c) A researcher decides to study students' performance from a school over a period of
time.
[2]
(d) Measuring the relationship between two securities.
[2]
(e) Predicting whether a patient has a particular disease or not.
[2]
1.2
What is the effect of putting additional predictor variables in the model on each of
the following?
a)
R2
[2]
b)
Adj R 2
[2]
c)
SSE
[2]
d)
Estimated standard deviation of the errors
[2]
1.3 A biologist is comparing the intervals (m seconds) between the mating calls of a certain species
of tree frog and the surrounding temperature (t 0C). The following results were obtained.
t 0c
m secs
8
13 I
14
15
15
20
25
30
6.5
4.5 I
6
5
4
3
2
1
a) Calculate the coefficient of correlation and interpret it
[6]
b) Test the significance of the coefficient of correlation at 5%
[8]
c) Find the equation of the regression line
(4]
d) Use your regression line to estimate the time interval between mating calls when the
°c surrounding temperature is 10
[2]
1.2 A multiple regression model of the following form is fitted to a data set.
Yi= /Jo+/J1X1 + /J2X2 + /33X3 + /34X4 + Ei,Ei~N(O, cr2) i. i. d.
Variables
Cons
xl
x2
x3
x4
Coefficients
5.3036
4.0336
-9.3153
Std. Error
0.196
2.5316
2.4657
2.2852
t value
8.438
1.627
0.257
Pr(>ltl
3.57
0.03
0.107
0.002
0.7973
a) Find the missing values in the output.
[5]
b) Write down the estimated regression model.
[2]
c) Test the significance of x4.
[5]
d) Interpret the coefficients of all variables.
[5]
e) Test the significance of x3.
[SJ
Regression Analysis and ANOVA (RAA602S)
l' t Opportunity November 2023
2
|
|
3 Page 3 |
▲back to top |
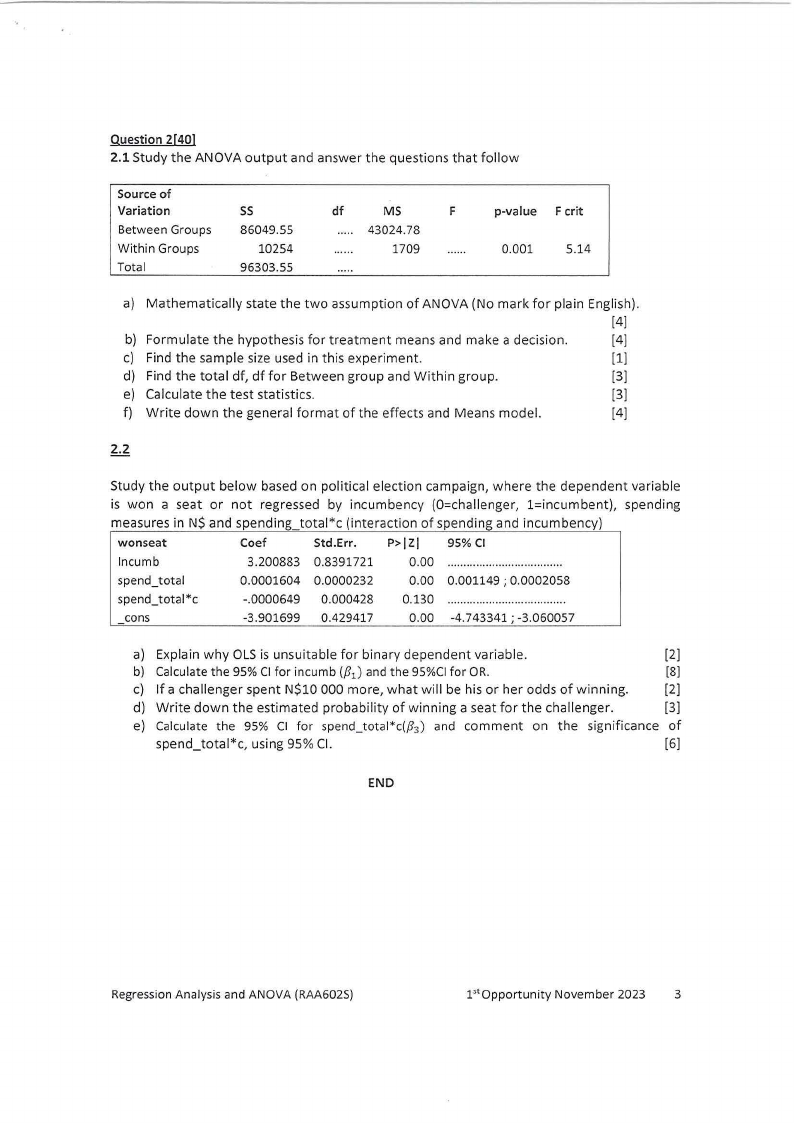
Question 2(40)
2.1 Study the ANOVA output and answer the questions that follow
Source of
Variation
Between Groups
Within Groups
Total
ss
86049.55
10254
96303.55
df
MS
F
43024.78
1709
p-value F crit
0.001
5.14
a) Mathematically state the two assumption of ANOVA (No mark for plain English).
[4]
b) Formulate the hypothesis for treatment means and make a decision.
(4]
c) Find the sample size used in this experiment.
[1]
d) Find the total df, df for Between group and Within group.
[3]
e) Calculate the test statistics.
[3]
f) Write down the general format of the effects and Means model.
(4]
Study the output below based on political election campaign, where the dependent variable
is won a seat or not regressed by incumbency (O=challenger, l=incumbent), spending
measures in N$ and spending total*c (interaction of spending and incumbency)
wonseat
Coef
Std.Err.
P> IZI 95% Cl
lncumb
3.200883 0.8391721 0.00 ....................................
spend_total
0.0001604 0.0000232
0.00 0.001149 ; 0.0002058
spend_total*c
-.0000649 0.000428 0.130 .....................................
cons
-3.901699 0.429417
0.00 -4.743341; -3.060057
a) Explain why OLS is unsuitable for binary dependent variable.
[2]
b) Calculate the 95% Cl for incumb (/31 ) and the 95%CIfor OR.
[8]
c) If a challenger spent N$10 000 more, what will be his or her odds of winning.
[2]
d) Write down the estimated probability of winning a seat for the challenger.
[3]
e) Calculate the 95% Cl for spend_total*c(/33) and comment on the significance of
spend_total*c, using 95% Cl.
[6]
END
RegressionAnalysis and ANOVA (RAA602S)
l51Opportunity November 2023 3
|
|
4 Page 4 |
▲back to top |

t Table
cum. prnb
one-tail
two-tails
df
1
2
3
4
5
6
7
8
9
,0
,1
12
13
14
15
16
17
18
19
20
21
22
23
24
25
26
2.7
28
29
t .$J
0.50
1.00
t_,g
0.25
0.50
t.:!~
0.20
0 .4. 0
0.000 u.ooo 1.376
0.00'0 0.8il6 1.0i:,1
0.000 IJ.765 0.9?8
0.000 0.741 0.9.!.1
0.000 0.727 0.920
o.oao 0.718 11906
0.000 0.711 0.8'96
0.000 0.706 0.889
o.mm 0.703 118&3
0.000 0.700 0.879
o.ocm 0.697 0.876
O.OCO O.f.95 0.873
O.OCO 0.'694 0.870
0.000 0.692 0.8€8
0.000 0.£91 Gi.86£
0.000 0.690 0.865
O.OOtl 0.689 0.86-3
0.000 0.688 0.862
0.000 0.688 0.861
0.000 0.687 0.860
0.000 o.,ass 0.859
O.OCD 0.686 G.858
O.OQO 0.1685 0.858
0.00D 0.685 !'.).857
0.00:) 0.1684 0.8!55
0.000 0.634 C.856
0.00-0 0.684 1lB55
0.000 0.£83 0.855
0.000 0.683 1).854
C.z~
0.15
o,_30
'l.S63
1.386
1.250
1.190
1.156
l.134
'l.119
1.108-
1.100
J}93
i.088
i.063
i.072
1.076
1.074
1.071
1.0£9
·1.067
Ul£6
i.064
1.063
1.061
1.c60
1.C59
l.058
1.058
1.057
1.056
1.055
r .sc
0.10
020
3.078
1.886
1.638
1.533
1.476
1.440
1.4i5
1.397
1.383,
1.372
1.363
1.356
1.350
1.345
1.34'1
1.337
1.333
1.330
1.328
1.325
1.323
1.321
1.319
1.318
1.316
1.315
1.314
1.313
U l1
t .95
t .3~;.
0.05 0.025
,0.110 0.05
6.314
2.920
2.353
2.132
2.015
1.943
1.895
1.8£0
1.833
1.812
l.796
1.782
1.771
1.761
1.753
l.746
'1.740
l.734
l.729
1.725
1.721
1.717
i.714
1.71J
1.708
1.706
'1.703
1.701
1.699
12.71
4.303
3.182
2.77€
2.571
2.447
2..365
2.306
2.262
2.228
2.201
2. !79'
2.160
2.145
2.131
2.T20
2.110
2.101
2.093
2.D86
2.080
2.074
2.069
2.06.:!
2.060
2.056
2.052
2.048
2.045
t~
0.0,1
0.02
t.99(!.
0.005
0.01
t .!l:'3
t .o'995
0.001 o.ooosl
0.002 0.001
3j.82
6.965
4.541
3.747
3.365
3.143
2.998
2.896
2.821
2.76-4
2.71-8
2.681
2.650
2.624
2.602
2.583
2.567
2.552
2.539
2.528
2.518
2.5()<8
2.5GD
2.4'3'2
2.485
2.479
2.-473
2.467
2.462
63.66
9.925
5.B41
4.604
4.032
3.707
3.499
3.355
3.25/J
3.169
3.105
3:055
3.012
2.977
2:947
2.921
2.898
2.678
2..B61
2.845
2.831
2.819'
2.807
2.797
2.787
2.779
2:771
2.763,
2.756
318.31 636.62
22.327 31.599
10.215 12.924
7.173 8.610
5.883 6.8$9
5.20-B 5.959
4.785 5AD8
4.501 5.041
.4297 4.781
-U'44 4587
4.025 4.!37
3.930 4.318
3.852 4.221
3.787 4.140
3.733 4.073
3.68'6 4.015.
3.64-6 3_g55
3.1510 3.922
.3.579 3.883
3.55'2 3.ll50
3.527 3.819
3.506 3.792
3.485 3.768
3.467 3.745
3.450 3.725
3.435 3.707
3.421 3.690
3.408 3.674
J.396 3.659
Regression Analysis and ANOVA (RAA602S)
l' t Opportunity November 2023
4