


 |
GSS721S - Geostatistics - 1st OPP - june 2023 |
|
|
1 Page 1 |
▲back to top |
,..
l
n Am I BI A u n IVER s ITY
OFSCIEnCE Ano TECHn OLOGY
DEPARTMENT OF CIVIL, MINING AND PROCESSENGINEERING
QUALIFICATION: BACHELOROF ENGINEERINGIN MINING ENGINEERING
QUALIFICATION CODE: 08BMENG
LEVEL: 7
COURSE CODE: GSS721S
COURSE NAME: GEOSTATISTICS
SESSION: JUNE 2023
DURATION: 3 HOURS
PAPER: THEORY
MARKS: 100
EXAMINER(S)
MODERATOR:
FIRST OPPORTUNITY EXAMINATION
Prof Benjamin MAPANI
Prof. Mallikarjun PILLALAMARRY
ANSWER QUESTION ONE (1) (40 marks) AND ANY OTHER THREE (3) (20 marks each)
Formulas
• Statistical Variance: cr2= L (X;-µ)2 /n
• Where n is the number of data points in the given set, and µ is the mean.
• Geostatistical Variance: cr2= L (X;-Xi+h) 2 /n
• Where n is the number of pairs
The standard deviation (SD) is the square root of the variance.
1
|
|
2 Page 2 |
▲back to top |
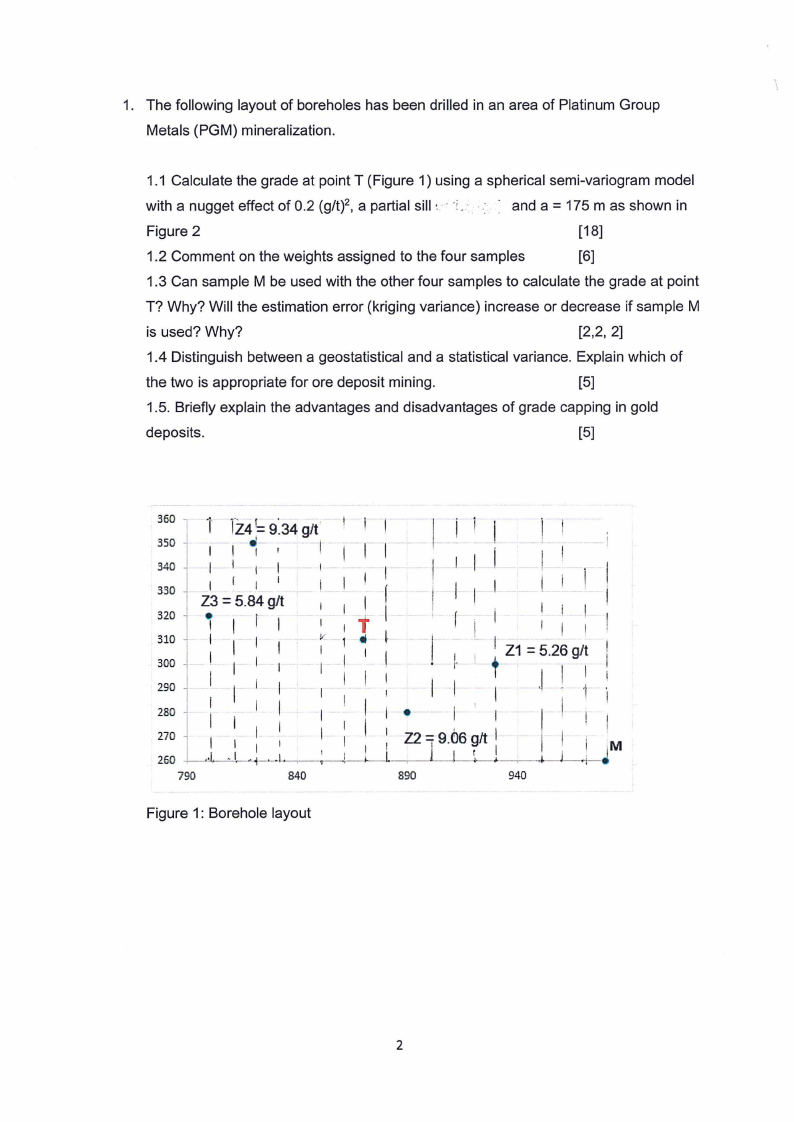
1. The following layout of boreholes has been drilled in an area of Platinum Group
Metals (PGM) mineralization.
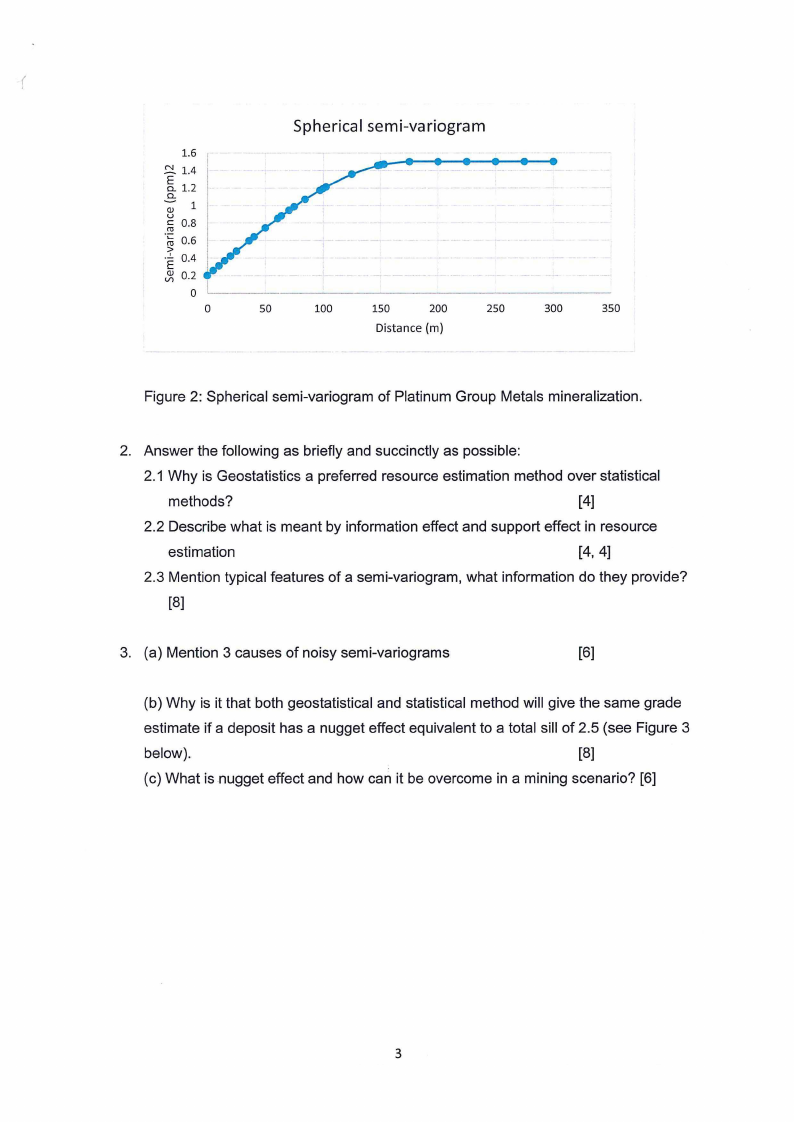
1.1 Calculate the grade at point T (Figure 1) using a spherical semi-variogram model
with a nugget effect of 0.2 (g/t)2, a partial sill : ·· ·;.·. ·i : and a = 175 m as shown in
Figure 2
[18]
1.2 Comment on the weights assigned to the four samples
[6]
1.3 Can sample M be used with the other four samples to calculate the grade at point
T? Why? Will the estimation error (kriging variance) increase or decrease if sample M
is used? Why?
[2,2, 2]
1.4 Distinguish between a geostatistical and a statistical variance. Explain which of
the two is appropriate for ore deposit mining.
[5]
1.5. Briefly explain the advantages and disadvantages of grade capping in gold
deposits.
[5]
360 l lz4h s:34 gtt'
350
1 ~- , -1 ,--I
340
I 1- I
330
I
II
Z3 = 5.84 git
• 320
I IrI
310
30D
29D
I
I
I
I
I
I
V
I
I
t
41
I
2&0
I•
_I
II
L
I
II I
ii-Z1 = 5.26 g/1
,. I
I
j I:I
·1
I
iI
270
260
.J,~.I~
I Z2.= 9.06git I
.---,------.--__,___1,___, -,----l"---<._.1_._I
II
..-.L..j-J M
79D
84D
890
940
Figure 1: Borehole layout
2
|
|
3 Page 3 |
▲back to top |
(
I
1.6
s:!..1.4
E
0..
1.2
0..
-; 1
u
Cro Q.8
-~ 0.6
.>Eo.4
,3s 0.2
0
0
Spherical semi-variogram
so
100
150
200
250
300
350
Distance (m)
Figure 2: Spherical semi-variogram of Platinum Group Metals mineralization.
2. Answer the following as briefly and succinctly as possible:
2.1 Why is Geostatistics a preferred resource estimation method over statistical
methods?
[4]
2.2 Describe what is meant by information effect and support effect in resource
estimation
[4, 4]
2.3 Mention typical features of a semi-variogram, what information do they provide?
[8]
3. (a) Mention 3 causes of noisy semi-variograms
[6]
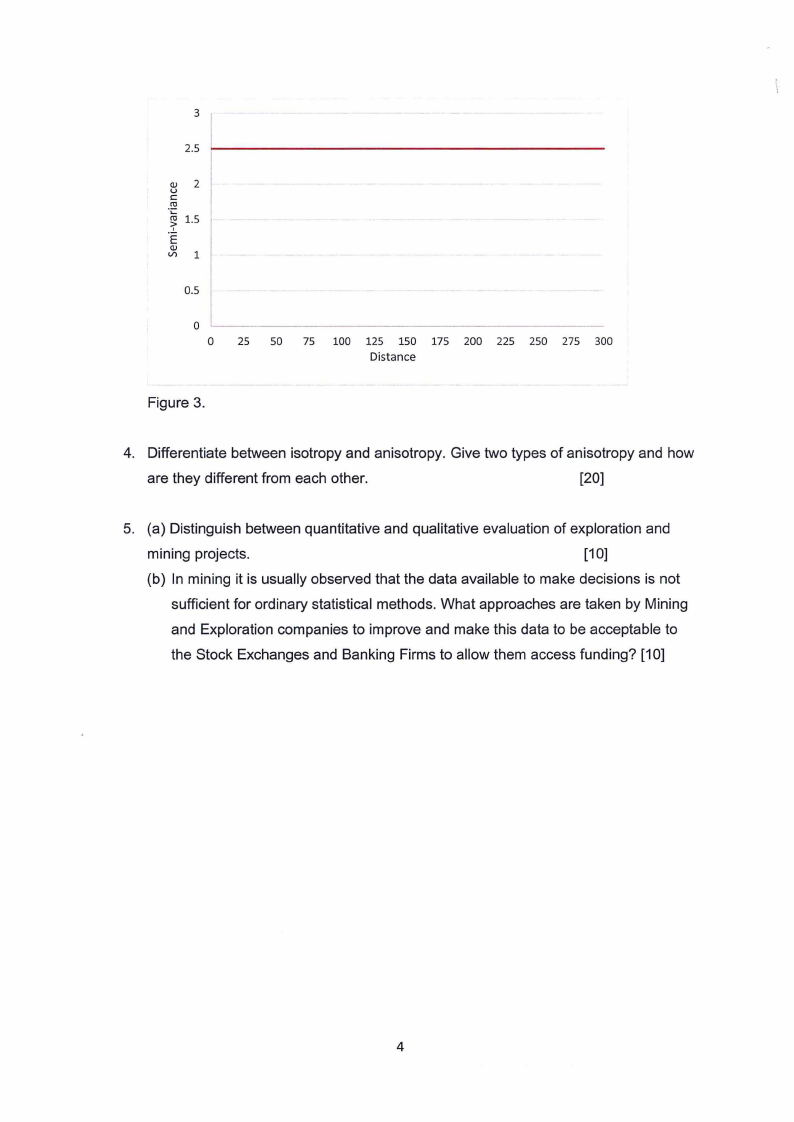
(b) Why is it that both geostatistical and statistical method will give the same grade
estimate if a deposit has a nugget effect equivalent to a total sill of 2.5 (see Figure 3
below).
[8]
(c) What is nugget effect and how can it be overcome in a mining scenario? [6]
3
|
|
4 Page 4 |
▲back to top |
3
2.5
Qu J 2
C
?·c;:u:
1.5
.E
QJ
Vl
1
0.5
0
0 25 50 75 100 125 150 175 200 225 250 275 300
Distance
Figure 3.
4. Differentiate between isotropy and anisotropy. Give two types of anisotropy and how
are they different from each other.
[20]
5. (a) Distinguish between quantitative and qualitative evaluation of exploration and
mining projects.
[1O]
(b) In mining it is usually observed that the data available to make decisions is not
sufficient for ordinary statistical methods. What approaches are taken by Mining
and Exploration companies to improve and make this data to be acceptable to
the Stock Exchanges and Banking Firms to allow them access funding? [1O]
4