


 |
DTA621S - DATA ANALYTICS - 2ND OPP - DEC 2025 |
|
|
1 Page 1 |
▲back to top |
nAm I BI AunI VER sITY
OF SC IEnC E Ano TECHnOLOG Y
FACULTY OF COMPUTING AND INFORMATICS
DEPARTMENT OF INFORMATICS
QUALIFICATIONS: Bachelor of Informatics; Bachelor of Computer Science
QUALIFICATION CODE: 07BAIT, 07BCMS LEVEL: 6
COURSE CODE: DTA621S
COURSE: Data Analytics
DATE: DECEMBER 2025
DURATION: 3 Hours
SESSION: 1
MARKS: 100
SUPPLEMENTARY/SECOND OPPORTUNITY EXAMINATION QUESTION PAPER
EXAMIN ER(S):
Dr Clopas l<wenda
M O DERATOR(S) :
Professor Stephen Fashoto
THIS EXAMINATION PAPER CONSISTS OF 8 PAGES
(INCLUDING THIS FRONT PAGE)
INSTRUCTIONS FOR THE CANDIDATE
1. Answer ALL QUESTIONS.
2. When writing, take into account: The style should inform than impress, it shou ld be
formal, in third person, paragraphs set out according to ideas or issues, and the
paragraphs flowing in a logical order.
3. Information should be brief and accurate.
4. Please ensure that your writing is legible, neat and presentable
|
|
2 Page 2 |
▲back to top |
Question one
1. Which type of chart is most appropriate for showing the composition of a
whole, like ice cream flavor preferences?
a) Bar Chart
b) Scatter Plot
c) Box Plot
d) Pie Chart
2. On a Box-and-Whisker plot, what does the length of the box itself represent?
a) The full range of the data
b) The Interquartile Range (IQR)
c) The medi an value
d) The mean value
3. A Box Plot where the median is closer to the bottom (Q1) of the box indicates
that the data is likely:
a) Symmetric
b) Left-skewed
c) Right-skewed
d) Has no outliers
4. A scatter plot is primarily used to visualize:
a) The composition of a single category.
b) The relationship between two numerical variables.
c) The distribution and quartiles of a single dataset.
d) The percentage co ntribution of parts to a whole.
5. Using the same shoe size data (1, 2, 3, 3, 4, 5, 5, 5, 6, 6), what is the median?
a) 4
b) 5
c) 4.5
d) 3
6. If Data Set A has a standard deviation of 10 and a mean of 50, and Data Set B
has a standard deviation of 15 and a mean of 100, which set has a higher
relative variation?
a) Data Set A (CV= 20%)
b) Data Set B (CV= 15%)
c) They have the same relative variation.
d) It cannot be determined from this information.
7. Standard deviation is defined as:
a) Th e average of all numbers in a data set.
1
|
|
3 Page 3 |
▲back to top |
b) The square root of the variance.
c) The difference between the maximum and minimum values.
d) The middle value of an ordered data set.
8. The Coefficient of Variation (CV) is particularly useful because it:
a) Is always a whole number.
b) Can be used to compare data sets measured in different units.
c) Is easier to calculate than standard deviation.
d) Eliminates the effect of outliers.
9. In the equation for linear regression, Y = aX + b, what does 'X' represent?
a) The dependent variable (target)
b) The slope of the line (linear coefficient)
c) They-intercept (linear coefficient)
d) The independent variable (predictor)
10. The phase of the machine learning life cycle where the model is integrated into
a real-world system is called:
a) Data Gathering
b) Model Training
c) Model Testing
d) Deployment
11. Polynomial Regression is most useful when:
a) The relationship between the independent and dependent variables is linear.
b) The data is perfectly clean and has no outliers.
c) The datapoints are related in a non-linear fashion.
d) The output variable is categorical.
12. Which type of machine learning problem would you use to categorize emails as
'spam' or 'not spam'?
a) Regression
b) Classification
c) Reinforcement Learning
d) Data Wrangling
13. If an algorithm performs well on the training data but poorly on the test data,
this problem is known as:
a) Underfitting
b) Multicollinearity
c) Overfitting
d) Correlation
14. Which of the following is a lcey difference between Al and Machine Learning
(ML)?
2
|
|
4 Page 4 |
▲back to top |
a) Al has a limited sco pe, while ML has a ve ry wid e scope.
b) ML is a subset of Al.
c) Al deals only with structured data, while ML deals with all data types.
d) ML aims to simulate human behavior, wh ile Al aims for accuracy in specifi c tasks.
15. A dataset where each row represents a person and columns include 'Age'
(numerical) and 'Purchased' (Yes/No) is an example of:
a) On ly numerical data
b) Only categorical data
c) A mix of numerical and catego ri ca l data
d) Ordinal data
16. Predictive analytics is commonly used in:
a) Predictive maintenance in manufacturing
b) Personalized marketing recommendations
c) Credit scoring in finance
d) All of the above
17. The first step in the data analytics process is:
a) Analyze t he data
b) Clea n the data
c) Define the questions
d) Sha re results
18. Which type of analytics answers the question "What happened?"
a) Diagnostic
b) Descriptive
c) Predictive
d) Prescriptive
19. Data from third-party vendors is classified as:
a) Internal source
b) External source
c) Structured data only
d) Semi-structured data
20. Which attribute is used to determine the dimensions of a DataFrame?
a) size
b) keys()
c)shape
d) index
21. To add a new column, you use:
a) df.insert()
b) df.newcol()
3
|
|
5 Page 5 |
▲back to top |
c) df["column_name"] = values
d) df.add()
22. Which function provides descriptive statistics of a DataFrame?
a) describe()
b) info()
c) stats()
d) summary()
23. Logical operators in Pandas are written as:
a) AND, OR
b) & , I
c) +, -
d) NOT, NOR
24. Which indexer is used to extract rows/columns by their numeric positions?
a) loc
b)iloc
c) index
d) key
25. Which function returns an array of evenly spaced values?
a)linspace()
b) arange()
c) range()
d) both a and b
Question two
1. You can use the append() method to add a new element to an existing tuple.
True/ False
2. Elements of a tuple can be accessed using indexing and slicing, similar to lists.
True I False
3. The sorted() function modifies the original tuple when it sorts it.
True/ False
4. You can create a tuple from a list using the tuple() function.
True/ False
5. Dictionary l<eys are always stored in sorted order.
True/ False
6. Using my_dict['key'J on a non-existing l<ey will raise a l<eyError.
True/ False
7. You can update the value of an existing key in a dictionary.
True/ False
4
|
|
6 Page 6 |
▲back to top |
8. The .drop() method can be used to remove both rows and columns from a
Data Frame.
True/ False
9. Index labels in a DataFrame must always be numeric.
True/ False
10. The .loc[] indexer is used to access data by labels, while .iloc[] is used to
access data by integer positions.
True I False
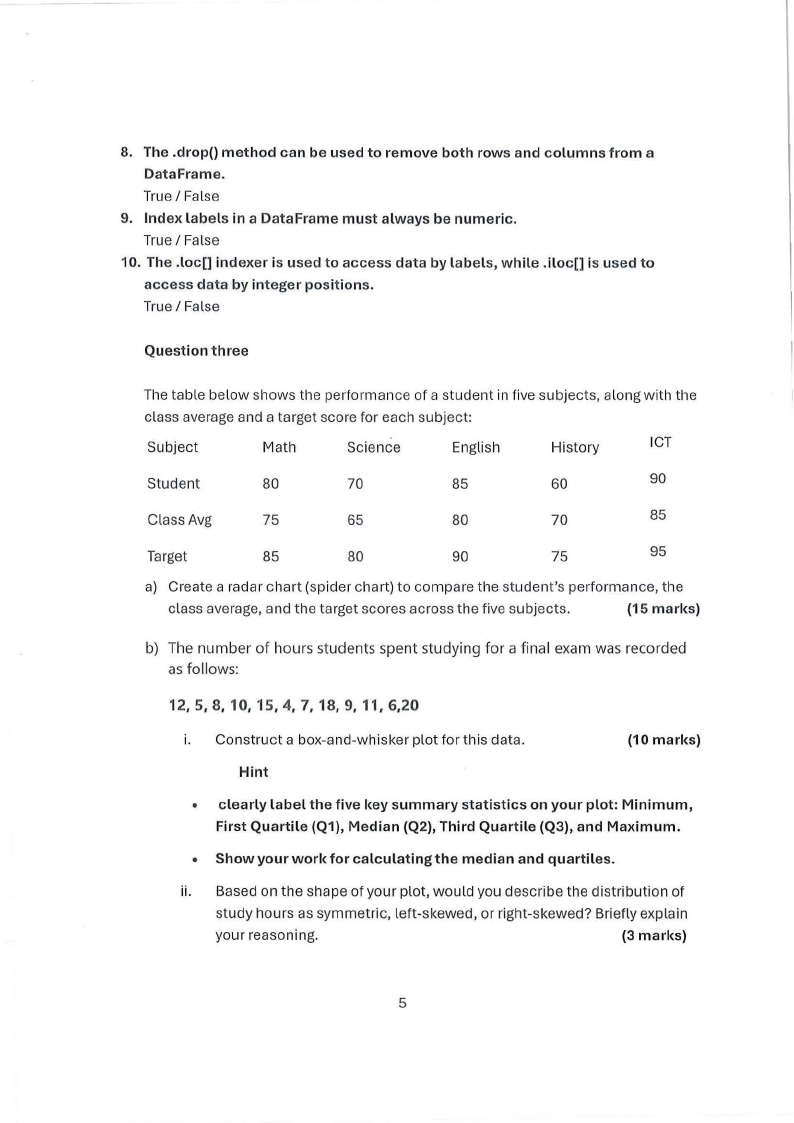
Question three
The table below shows the performance of a student in five subjects, along with the
class average and a target score for each subject:
Subject
Math
Science
English
Hi story
ICT
Student
80
70
85
60
90
Class Avg
75
65
80
70
85
Target
85
80
90
75
95
a) Creat e a rad ar c hart (sp id er chart) to co mpare the student's performance, the
class ave rage, and the target scores across the five subjects.
(15 marks)
b) The number of hours students spent studying for a final exa m was recorded
as follows:
12, 5, 8, 10, 15, 4, 7, 18, 9, 11 , 6,20
i. Construct a box-a nd-whisker plot for this data.
Hint
(10 marks)
• clearly label the five key summary statistics on your plot: Minimum,
First Quartile (Q1), Median (Q2), Third Quartile (Q3), and Maximum.
• Show your work for calculating the median and quartiles.
ii. Based on the shape of your plot, would you describe the distribution of
study hours as symmetric, left-skewed, or right-skewed? Bri efly explain
your reaso nin g.
(3 marks)
5
|
|
7 Page 7 |
▲back to top |
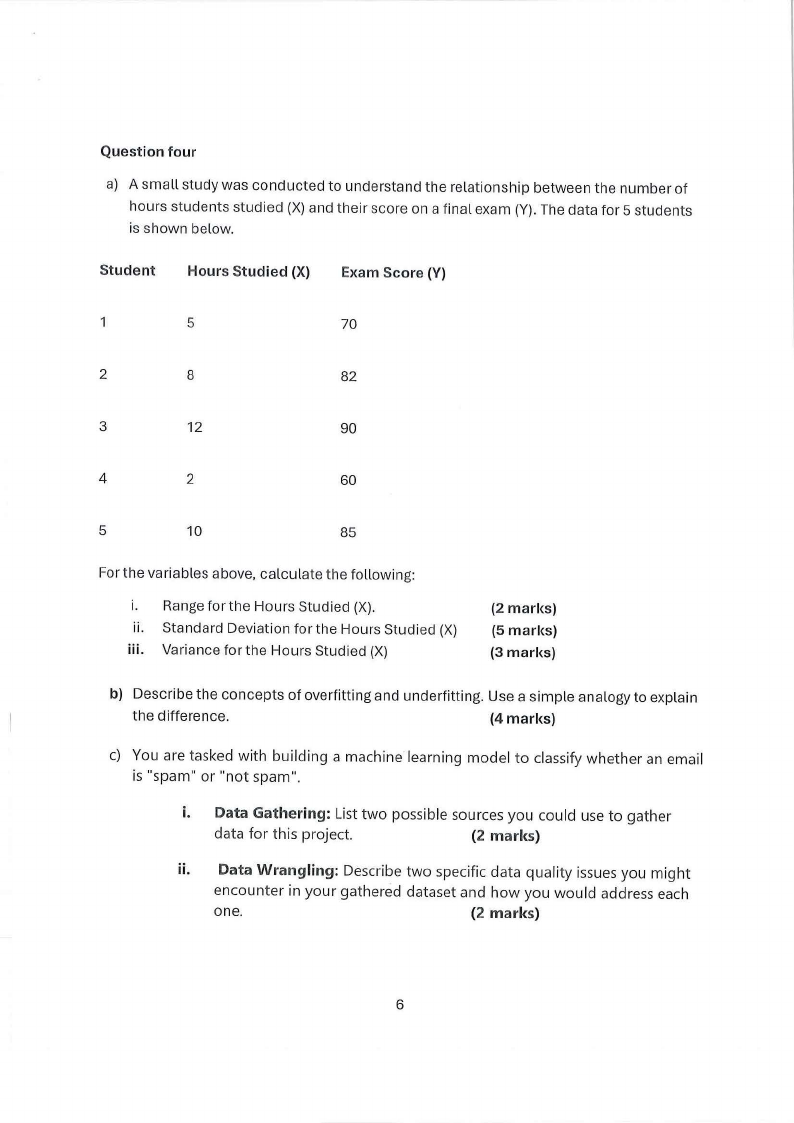
Question four
a) A small study was conducted to understand the relationship between the number of
hours students studied (X) and their score on a final exam (Y). The data for 5 students
is shown below.
Student Hours Stud ied (X) Exam Score (V)
5
70
2
8
82
3
12
90
4
2
60
5
10
85
For the variables above, calculate the following:
i. Range for the Hours Studied (X).
ii. Standard Deviation for the Hours Studied (X)
iii. Variance for the Hours Studied (X)
(2 marks)
(5 marks)
(3 marks)
b) Describe the concepts of overfitting and underfitting. Use a simple analogy to explain
the difference.
(4 marks)
c) You are tasked with building a machine learning model to classify whether an email
is "spam" or "not spam".
i. Data Gathering: List two possible sources you could use to gather
data for this project.
(2 marks)
ii. Data Wrangling: Describe two specific data quality issues you might
encounter in your gathered dataset and how you would address each
one.
(2 marks)
6
|
|
8 Page 8 |
▲back to top |
iii. Model Selection: Would you use a Regress ion or Classification
algorithm for this task? Name one specific algorithm suitable for this
problem.
(2 marks)
iv. Deployment: What does it mean to deploy the final spam
classification model?
(2 marks)
Question Five
a) For each of the statements listed below, identify whether it represents
descriptive, diagnostic, predictive, or prescriptive analytics:
( 5 marks)
i)
Why did sales decline in the second quarter of the year?
ii) What will the company's revenue be in the next six months based on
current trends?
iii) Which marketing strategy should we implement to maximize customer
retention?
iv) What was the average website traffic over the past 12 months?
v)
How many students passed the final exam last semester?
b) State four principles behind Nate Silver's modeling
( 8 marks)
c) Differentiate between an array and a list
(2 marks)