


 |
SAT802S- SAMPLING THEORY - JAN 2020 |
|
|
1 Page 1 |
▲back to top |
5
NAMIBIA UNIVERSITY
OF SCIENCE AND TECHNOLOGY
FACULTY OF HEALTH AND APPLIED SCIENCES
DEPARTMENT OF MATHEMATICS AND STATISTICS
QUALIFICATION: Bachelor of science Honours in Applied Statistics
QUALIFICATION CODE: O8BSSH
LEVEL: 8
COURSE CODE: SAT802S
COURSE NAME: SAMPLING THEORY
SESSION: JANUARY 2020
DURATION: 3 HOURS
PAPER: THEORY
MARKS: 100
SECOND OPPORTUNITY/SUPPLEMENTARY EXAMINATION QUESTION PAPER
EXAMINERS
DR. C.R KIKAWA
MODERATOR:
PROF SATHIYA APPUNNI
INSTRUCTIONS
1. Answer ALL the questions in the booklet provided.
2. Show clearly all the steps used in the calculations.
3. All written work must be done in blue or black ink and sketches must
be done in pencil.
PERMISSIBLE MATERIALS
1. Non-programmable calculator without a cover.
THIS QUESTION PAPER CONSISTS OF 5 PAGES (including this front page)
|
|
2 Page 2 |
▲back to top |
NAMIBIA UNIVERSITY OF SCIENCE AND TECHNOLOGY
DEPARTMENT OF MATHEMATICS AND STATISTICS
SAMPLING THEORY: SAT802S
SECOND/SUPPLEMENTARY EXAMINATION, JANUARY 2020
Time - 3 Hrs. Attempt all Questions. Maximum marks - 100
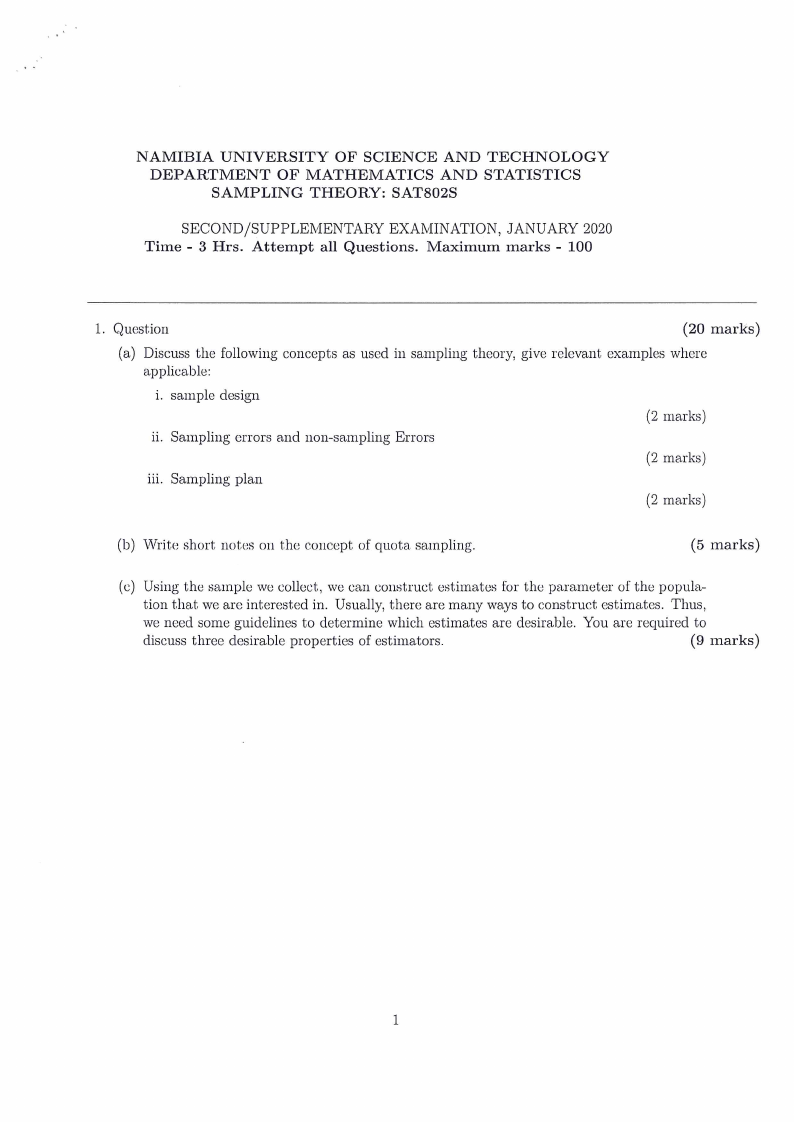
1. Question
(20 marks)
(a) Discuss the following concepts as used in sampling theory, give relevant examples where
applicable:
i. sample design
ii. Sampling errors and non-sampling Errors
iii. Sampling plan
(2 marks)
(2 marks)
(2 marks)
(b) Write short notes on the concept of quota sampling.
(5 marks)
(c) Using the sample we collect, we can construct estimates for the parameter of the popula-
tion that we are interested in. Usually, there are many ways to construct estimates. Thus,
we need some guidelines to determine which estimates are desirable. You are required to
discuss three desirable properties of estimators.
(9 marks)
|
|
3 Page 3 |
▲back to top |
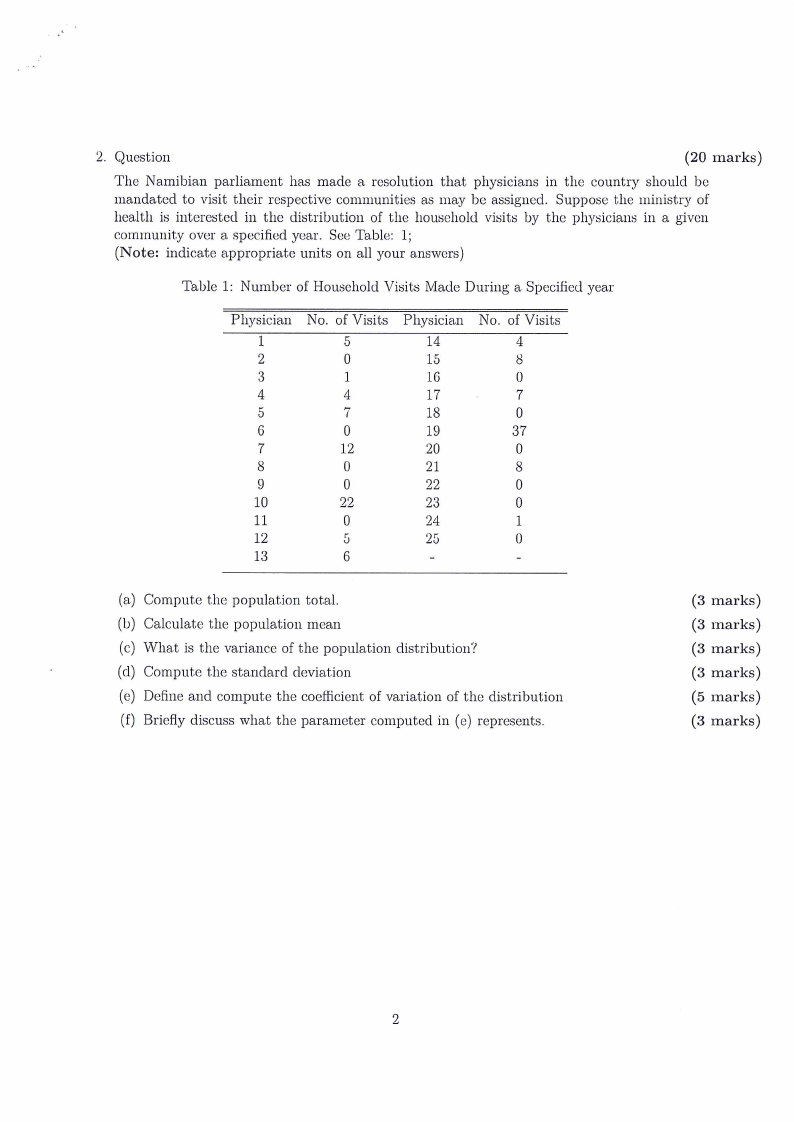
2. Question
(20 marks)
The Namibian parliament has made a resolution that physicians in the country should be
mandated to visit their respective communities as may be assigned. Suppose the ministry of
health is interested in the distribution of the household visits by the physicians in a given
community over a specified year. See Table: 1,
(Note: indicate appropriate units on all your answers)
Table 1: Number of Household Visits Made During a Specified year
Physician
1
2
3
4
5
6
7
8
9
10
11
12
13
No. of Visits
5
0
1
4
7
0
12
0
0
22
0
5
6
Physician
14
15
16
17
18
19
20
21
22
23
24
25
=
No. of Visits
4
38
0
7
0
37
0
8
0
0
1
0
:
(a) Compute the population total.
(b) Calculate the population mean
(c) What is the variance of the population distribution?
(d) Compute the standard deviation
(e) Define and compute the coefficient of variation of the distribution
(f) Briefly discuss what the parameter computed in (e) represents.
(3 marks)
(3 marks)
(3 marks)
(3 marks)
(5 marks)
(3 marks)
|
|
4 Page 4 |
▲back to top |
3. Question
(20 marks)
(a) Discuss the concept a simple random sample in relation to n the sample size and N the
population size clearly stating the selection probability of each sample.
(5 marks)
(b) Assume you have a population of N elements and you wish to take a sample of n of these
elements. Required to state a well known formula from the theory of permutations and
combinations which is used to select, the number T of possible samples of 1 elements
from a population of N elements.
(4 marks)
Given that a population contains 25 elements and one wishes to take a sample of 5
elements. Use the relation stated in (b) to compute the possible samples of 5 elements
from the population given.
(2 marks)
Explain, stepwise how to take a Simple Random Sample.
(4 marks)
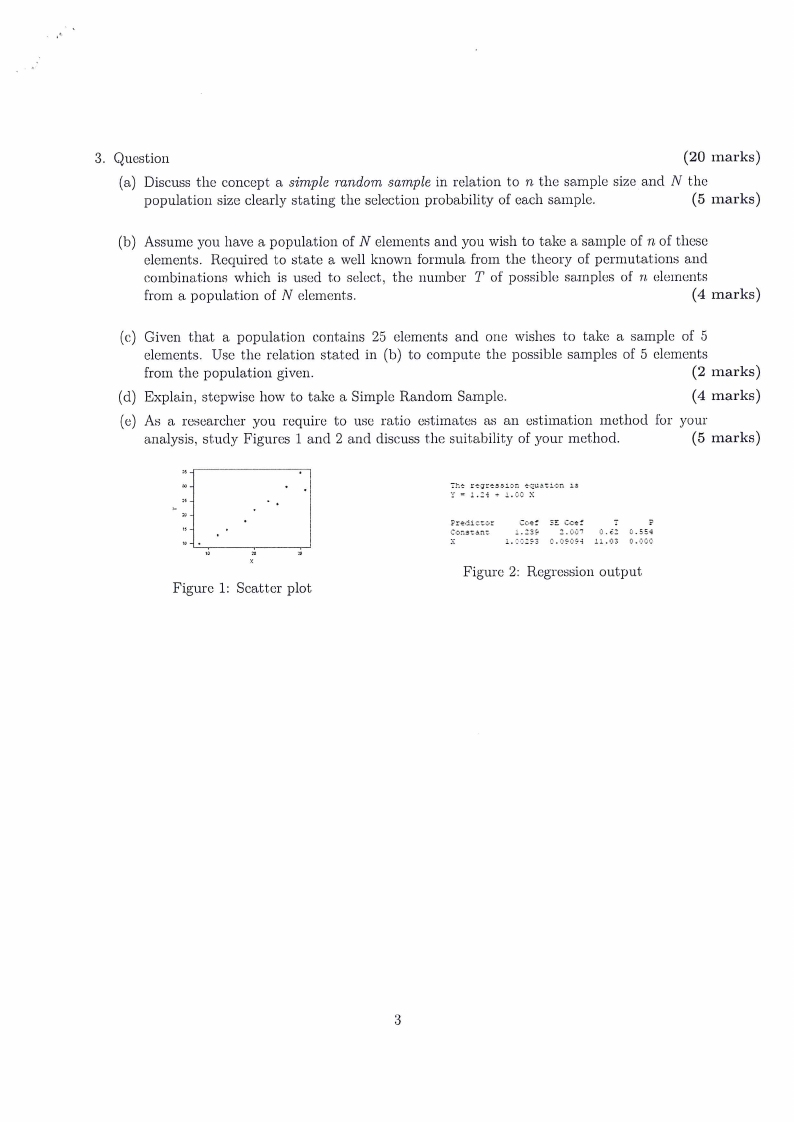
As a researcher you require to use ratio estimates as an estimation method for your
analysis, study Figures 1 and 2 and discuss the suitability of your method.
(5 marks)
° regression equation is
i£.224¢ + 1.60 N .
Figure 1: Scatter plot
Figure 2: Regression output
|
|
5 Page 5 |
▲back to top |
4, Question
(20 marks)
(a) Discuss the three principal reasons for using stratified random sampling rather than simple
random sampling.
(6 marks)
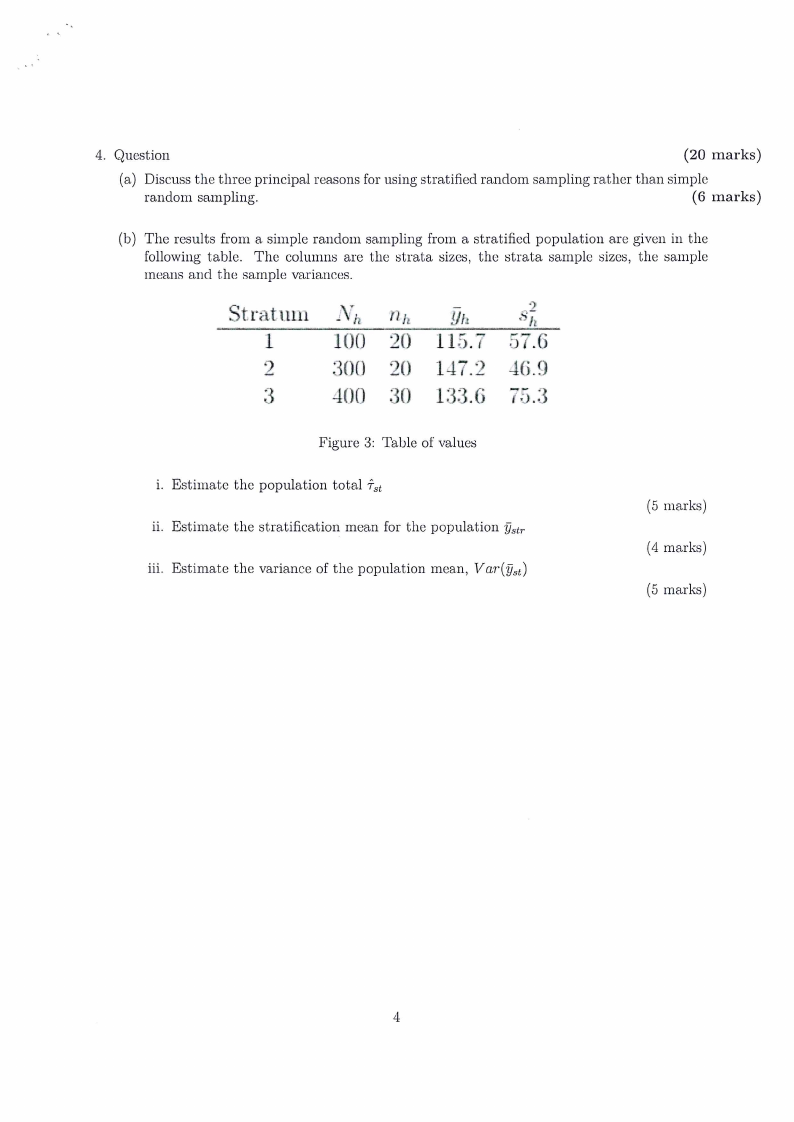
(b) The results from a simple random sampling from a stratified population are given in the
following table. The columns are the strata sizes, the strata sample sizes, the sample
means and the sample variances.
Stratum NN, np,
Uh
SF
1
100 20) «115.7 57.6
2
300 20 147.2 46.9
3
400 30 133.6 75.3
Figure 3: Table of values
i. Estimate the population total 7,;
ii. Estimate the stratification mean for the population ise,
iii. Estimate the variance of the population mean, Var(%s)
(5 marks)
(4 marks)
(5 marks)
|
|
6 Page 6 |
▲back to top |
5. Question
(a) Discuss the concept, design effect as used in sampling theory.
(20 marks)
(3 marks)
(b) Briefly describe (generally) how a systematic sample can be selected from a given popu-
lation.
(5 marks)
Discuss two different scenarios in which cluster sampling is an effective design .
(4 marks)
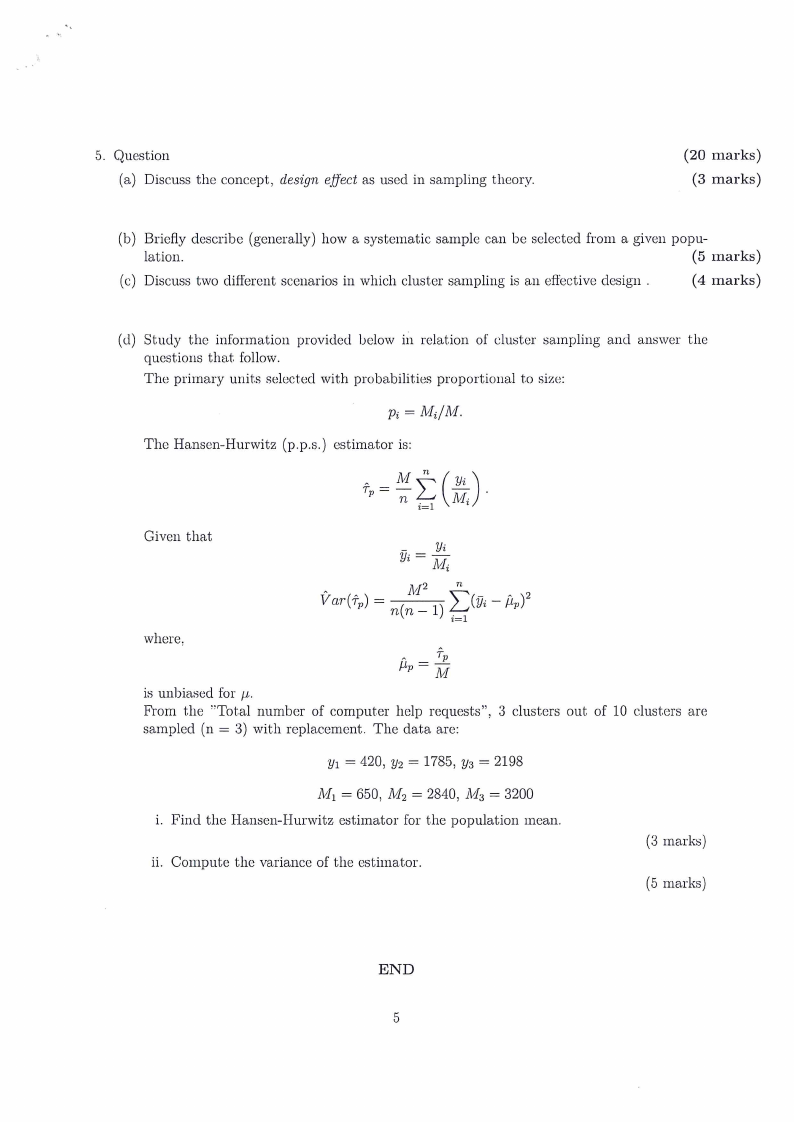
Study the information provided below in relation of cluster sampling and answer the
questions that follow.
The primary units selected with probabilities proportional to size:
p; = M;/M.
The Hansen-Hurwitz (p.p.s.) estimator is:
~ MOK
T=
M,
i=l
Given that
_ Yi
Yi = My,
vont)= eS
where,
;
[lp = 7
is unbiased for p.
From the *Total number of computer help requests”, 3 clusters out of 10 clusters are
sampled (n = 3) with replacement. The data are:
yi = 420, yo = 1785, y3 = 2198
M, = 650, Mz = 2840, M3 = 3200
i. Find the Hansen-Hurwitz estimator for the population mean.
ii. Compute the variance of the estimator.
(3 marks)
(5 marks)
END