


 |
DSA821S - DATA SCIENCE AND ANALYTICS - 1ST OPP - NOV 2024 |
|
|
1 Page 1 |
▲back to top |
n Am I BI A u n IVER s ITY
OF SCIEnCE AnD TECHnOLOGY
FACULTYOF COMPUTING AND INFORMATICS
DEPARTMENT OF INFORMATICS
QUALIFICATION: Bachelor of Informatics Honours
QUALIFICATIONCODE:08BIHW, 08BIFB
COURSE:Data Science and Analytics
DATE: NOVEMBER 2024
DURATION: 2 Hours
COURSELEVEL:NQF LEVEL8
COURSECODE:DSA821S
SESSION:1
MARKS: 60
EXAMINER(S):
FIRSTOPPORTUNITY EXAMINATION QUESTION PAPER
MR. SEBASTIAN MUKUMBIRA
MODERATOR (S):
MS. EMILIA SHIKEENGA
THIS EXAMINATION PAPER CONSISTSOF 3 PAGES
(INCLUDING THIS FRONT PAGE)
Instructions for the students
1. There are four Sections in this paper Section 1, Section 2, Section 3 and Section 4.
2. Answer ALL the questions in ALL Sections.
3. Write clearly and neatly.
4. Number the answers clearly.
5. IIJon-programmable calculators may be used.
|
|
2 Page 2 |
▲back to top |
Question 1: Regression Analysis [15 marks]
Answer the following questions:
(a) Explain the difference between linear regression and multiple regression. Provide an example for
each. (4 marks)
(b) What is the purpose of the R-square (R2) statistic in regression analysis, and how is it interpreted?
(3 marks)
(c) What is overfitting in regression analysis, and how can it be prevented? (3 marks)
(d) Suppose you have the following regression equation to predict a student's exam score based on
hours of study (Hours) and their attendance (Attendance, measured in days):
ExamScore = 50 + 3 x Hours + 2 x Attendance
(i) Interpret the coefficients for Hours and Attendance. (3 marks)
(ii) Predict the exam score for a student who studied for 10 hours and attended 20 days of classes.
(2 marks)
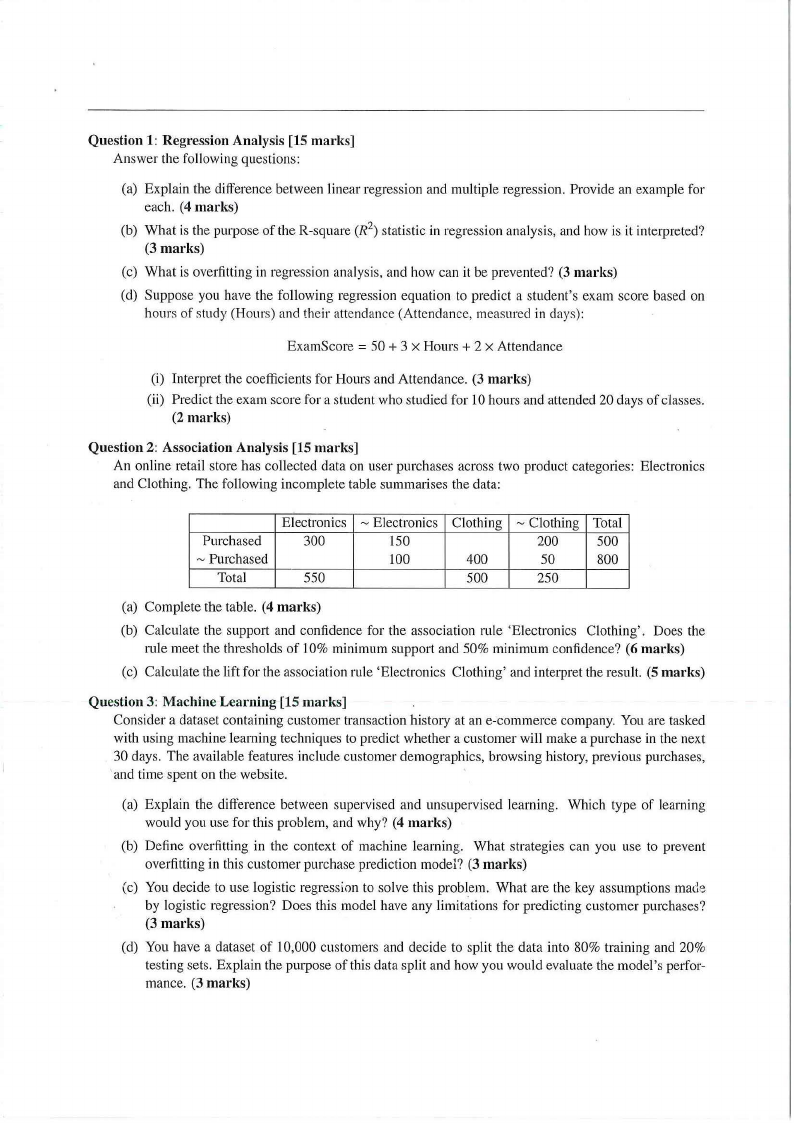
Question 2: Association Analysis [15 marks]
An online retail store has collected data on user purchases across two product categories: Electronics
and Clothing. The following incomplete table summarises the data:
Purchased
~ Purchased
Total
Electronics
300
550
~ Electronics
150
100
Clothing
400
500
~ Clothing
200
50
250
Total
500
800
(a) Complete the table. (4 marks)
(b) Calculate the support and confidence for the association rule 'Electronics Clothing'. Does the
rule meet the thresholds of 10% minimum support and 50% minimum confidence? (6 marks)
(c) Calculate the lift for the association rule 'Electronics Clothing' and interpret the result. (5 marks)
Question 3: Machine Learning [15 marks]
Consider a dataset containing customer transaction history at an e-commerce company. You are tasked
with using machine learning techniques to predict whether a customer will make a purchase in the next
30 days. The available features include customer demographics, browsing history, previous purchases,
and time spent on the website.
(a) Explain the difference between supervised and unsupervised learning. Which type of learning
would you use for this problem, and why? (4 marks)
(b) Define overfitting in the context of machine learning. What strategies can you use to prevent
overfitting in this customer purchase prediction model? (3 marks)
(c) You decide to use logistic regression to solve this problem. What are the key assumptions made
by logistic regression? Does this model have any limitations for predicting customer purchases?
(3 marks)
(d) You have a dataset of 10,000 customers and decide to split the data into 80% training and 20%
testing sets. Explain the purpose of this data split and how you would evaluate the model's perfor-
mance. (3 marks)
|
|
3 Page 3 |
▲back to top |
(e) If you were to use a random forest model for this task, what would be the benefit of using this over
logistic regression? Mention at least two advantages. (2 marks)
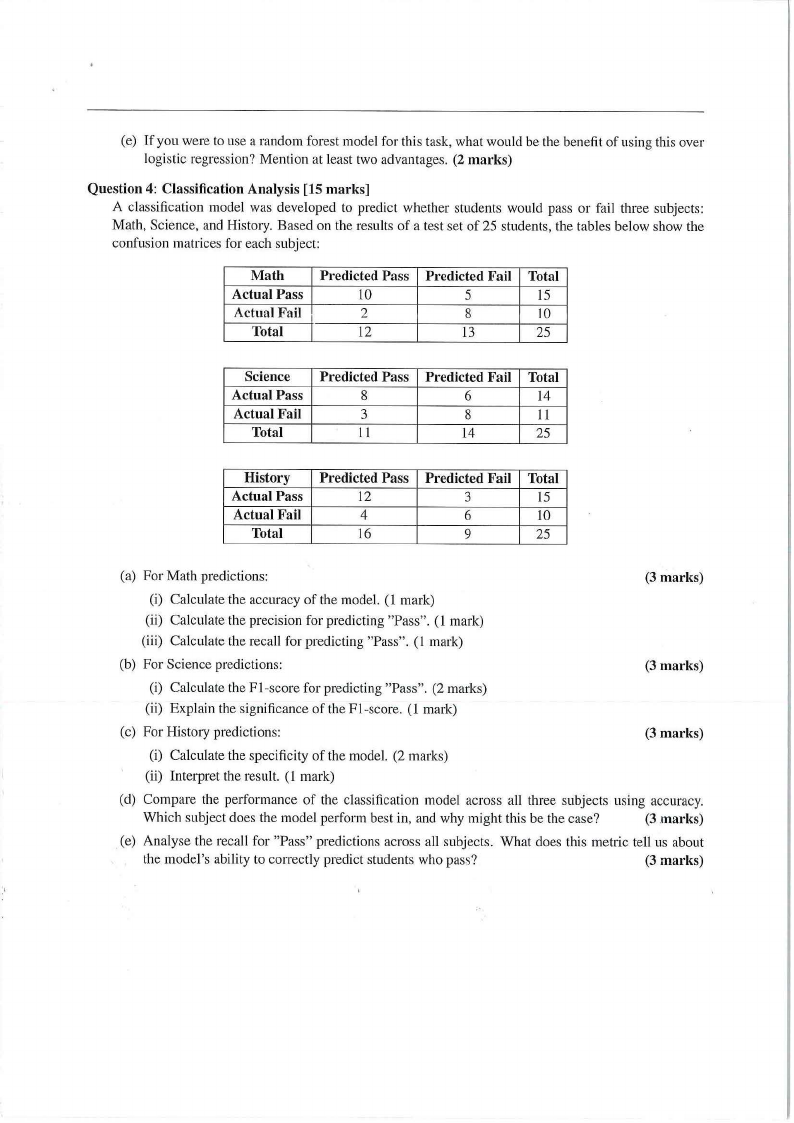
Question 4: Classification Analysis [15 marks]
A classification model was developed to predict whether students would pass or fail three subjects:
Math, Science, and History. Based on the results of a test set of 25 students, the tables below show the
confusion matrices for each subject:
Math
Predicted Pass
Actual Pass
10
Actual Fail I
2
Total
12
Predicted Fail
5
8
13
Total
15
10
25
Science
Actual Pass
Actual Fail
Total
Predicted Pass
8
3
11
Predicted Fail
6
8
14
Total
14
11
25
History
Actual Pass
Actual Fail
Total
Predicted Pass
12
4
16
Predicted Fail
3
6
9
Total
15
10
25
(a) For Math predictions:
(3 marks)
(i) Calculate the accuracy of the model. (1 mark)
(ii) Calculate the precision for predicting "Pass". (l mark)
(iii) Calculate the recall for predicting "Pass". (I mark)
(b) For Science predictions:
(3 marks)
(i) Calculate the Fl-score for predicting "Pass". (2 marks)
(ii) Explain the significance of the Fl-score. (1 mark)
(c) For History predictions:
(3 marks)
(i) Calculate the specificity of the model. (2 marks)
(ii) Interpret the result. (1 mark)
(d) Compare the performance of the classification model across all three subjects using accuracy.
Which subject does the model perform best in, and why might this be the case?
(3 marks)
(e) Analyse the recall for "Pass" predictions across all subjects. What does this metric tell us about
the model's ability to correctly predict students who pass?
(3 marks)