AGS520S - AGRICULTURAL STATISTICS - 1ST OPP - JUNE 2025


AGS520S - AGRICULTURAL STATISTICS - 1ST OPP - JUNE 2025


1 Pages 1-10

▲back to top


1.1 Page 1

▲back to top


nAml BIA UntVERSITY
OF SCIEnCEAnDTECHnOLOGY
FacultoyfHealthN, atural
ResourceasndApplied
Sciences
Schoool f NaturalandApplied
Sciences
Departmentof Mathematics,
StatisticsandActuarialScience
13JacksonKaujeuaStreet
PrivateBag13388
Windhoek
NAMIBIA
T: +264612072913
E: msas@nust.na
W:www.nust.na
QUALIFICATION : BACHELOR OF SCIENCE IN AGRICULTURE & BACHELOR OF SCIENCE IN
HORTICULTURE
QUALIFICATION CODE: 07BAGA & 07BHOR
LEVEL: 5
COURSE: AGRICULTURAL STATISTICS
COURSECODE: AGS520S
DATE: JUNE 2025
SESSION: 1
DURATION: 3 HOURS
MARKS: 100
EXAMINER:
MODERATOR:
FIRST OPPORTUNITY: QUESTION PAPER
Mr. Jonas Amunyela, Mr. Polykarp Amukuhu
Mr. Andrew Roux
INSTRUCTIONS:
1. Answer all questions on the separate answer sheet.
2. Please write neatly and legibly.
3. Do not use the left side margin of the exam paper. This must be allowed for the
examiner.
4. No books, notes and other additional aids are allowed.
5. Mark all answers clearly with their respective question numbers.
PERMISSIBLE MATERIALS:
1. Non-Programmable Calculator
ATTACHEMENTS
1. Z distribution Table
2. T distribution table
3. Chi-square table
4. Formula sheet
This paper consists of 7 pages including this front page

1.2 Page 2

▲back to top


QUESTION 1: MULTIPLE CHOICE QUESTIONS
(20 marks]
Evaluate the statements in each numbered section and select the most appropriate answer or
phrase from the given possibilities
1.1. When re-ordering, Pick' n Pay manager is interested in ordering different milk
flavour. Looking at the sales data, which measure of central tendency is useful to
him?
a) Mean
b) Mode
c) Median
d) All the above
[2]
1.2. A sample of a population is
a) A subset of the population
b) An experiment in the population
c)
A variable in the population
d)
An outcome of the population
[2]
1.3. Which of the following is a measure of central tendency in a statistical distribution?
a) Coefficient of variation
b) Range
c) Standard deviation
d) Mode
[2]
1.4. Fill in the blank to make the following sentence true. "The ______
of a
particular outcome is the number of times it occurs within a specific sample of a
population."
a) Frequency
b) Variance
c) Mean deviation
d) Distribution
[2]
Agricultural Statistics (AG55205)
1'1 Opportunity JUNE 2025
2

1.3 Page 3

▲back to top


1.5 Which of the following is true about two mutually exclusive events A and B?
a) P(A u B) = P(A) + P(B)
b) P(A u B) = P(A) + P(B) - P(A n B)
c) P(A) + P(B) = P(S)
d) P(A n B) = P(A) + P(B)
[2]
1.6 Which of the following is true about a mathematical probability:
a) Between -1 and 1 inclusive
b) Corresponding to any positive real number
c) Between O and 1 inclusive
d) Quotients of positive whole numbers or zero
[2]
1.7 A student is chosen at random from a class of 16 girls and 14 boys. What is the
probability that the student chosen is not a boy?
a)8/15
b)7/15
c) 0.35
d)O
[2]
1.8 If you believe that the probability of purchasing a new tractor is dependent on
getting a new higher paying job next year, the probability of purchasing the tractor is
an example of:
a) Simple probability
b) Conditional probability
c) Joint probability
d) Subjective probability
[2]
1.9 The sampling technique whereby members of the population are placed in an array
and every tenth member is selected is an example of:
[2]
a)
Random sampling
b)
Systematic sampling
c)
Cluster sampling
d)
Stratified sampling
1.10 You are doing research on farm personnel-orderlies, chief technicians, scientific
officer, and implement operator. You want to be sure you draw a sample that has
elements in each of the personnel categories. You want to use probability sampling.
An appropriate strategy would be:
[2]
Agricultural Statistics (AGS520S)
1st Opportunity JUNE 2025
3

1.4 Page 4

▲back to top


a}
Simple random sampling
b}
Quota sampling
c}
Cluster sampling
d}
Stratified sampling
SECTION B (Show all your working)
QUESTION 2
[40 marks]
2.1 Consider the following daily maximum temperature data for 10 winter days recorded
in Otavi.
24,37,26,46,58,30,32,
Calculate the following:
13, 12,38,
2.1.1 The mean.
[2]
2.1.2 The median.
[2]
2.1.3 The standard deviation.
[5]
2.2 As part of disease control system the veterinary department has recorded the
number of cases per farm related to food and mouth disease in various regions of
the country during year 2021.The table below present the data
10 31 21 60 12 30 42 45 50 50 36
43 52 64 40 44 40 55 48 46 59 58
51 61 47 53 41 31 47 48 33 59 53
62 49 35 48 26 36 24 62 32 41 20
2.2.1 Using classes 10 to less than 20, 20 to less than 30, and 30 to less than 40, construct
a frequency distribution table for the data.
[7]
2.3 Let X be the random variable with the following probability distribution
Agricultural Statistics (AGS520S)
1st Opportunity JUNE 2025
4

1.5 Page 5

▲back to top


I :.OS
I:.25 I:.15
2.3.1 Estimate the mean for a random variable X
[3]
2.3.2 Estimate the variance and the standard deviation for a random variable X
[6]
2.3.3 Find P(X > 4)
[2]
2.4 The incidence of disease in a grape garden is such that 20% of the grape trees in the
garden have the chance of being infected. If a random sample of six grape trees is
selected,
2.4.1 What is the probability that at least three trees will have the symptoms of the
disease
[5]
2.4.2 What is the probability that at most two trees will have the symptoms of the disease
[4]
2.4.3 What is the probability that exactly two trees will have the symptoms of the disease
[2]
2.4.4 What is the average number of the infected trees
[2]
QUESTION 3
[20 marks]
3.1 The Auditing procedures require you to have 95% confidence in estimating the
population proportion of sales invoices with errors to within ± 0.07 of the true
population proportion. The results from past month indicated that the largest
proportion has been not more than 0.15. Find the sample size
[4]
= 3.2 In a particular variety of wheat, leaf area is normally distributed with meanµ
= 100 cm 2 , and standard deviation (J' 9 cm2 . If a random sample of 36 trees is
considered, calculate the probability that the average area of the leaves is less than
100 cm 2
[3]
Agricultural Statistics (AGS520S)
1'1 Opportunity JUNE 2025
5

1.6 Page 6

▲back to top


3.3 Milk yields of dairy cows generally follow a normal distribution. The monthly yield of
a particular breed (Breed X} is believed to be normally distributed with a standard
deviation a= 45 litres when grazed without dietary supplements. Several farmers
start feeding their Breed X cattle on experimental supplement. The monthly yield of
= a random sample of 35 of these cows shows a mean yield x 220 litres per month.
3.3.3 Construct and interpret a 95% confidence interval for estimating the actual milk
yields of dairy cows
[6]
3.4 The following data are of milk fat yield (kg) per month from 17 Holstein cows:
27, 17,31,20,29,22,40,28,26,28,34,32,32,32,30,23,25
3.4.1 Use the data to construct a 98% confidence interval for the average milk fat yield of
all Holstein cows
[7]
QUESTION 4
[20 marks]
4.1 In a certain cattle-raising region of the country, it had become a practice among
some farmers to feed their Breed X cows a protein supplement which, when fed to
other dairy breeds, had never been known to do anything except increase milk
yields. The monthly milk yields of a random sample of 50 protein-supplemented
cows were recorded. The mean value x was 209 litres and the population standard
deviation was believed to be 40 litres.
4.1.1 Is there any reason to believe that the protein supplement has increased the average
= milk yield of Breed X cows to more than 200 litres? Use a 5%
[10]
4.2 The eggs of the Cuckoo family have a length which is approximately normally
distributed with mean ofµ = 20 mm. The Cuckoo is a nest parasite, especially on
nests of the Warbler family, the Sylviidae. Fifteen Cuckoo eggs were taken at random
from nests of the Marsh Warbler. The length of these eggs (units mm) were,
19
20
20
20
20
20
21
21
21
21
21
22
22
22
22
Agricultural Statistics (AGS520S)
i5t Opportunity JUNE 2025
6

1.7 Page 7

▲back to top


4.2.1 Is there any evidence to suggest that the average length of the Cuckoo eggs in Marsh
Warbler nests is different from the general population? Use a = 2%
[10]
END OF QUESTION PAPER
Agricultural Statistics (AGS520S)
151 Opportunity JUNE 2025
7

1.8 Page 8

▲back to top


FORMULASHEET
= + Me L c[O.Sn-CF]
fme
x- =-
"i,fx
n
tstat
=
x-µ
-s-
..[ii.
= 2
Xstat
(n-l)S 2
<J2
E(X) = L XiPi
P(X = x) = (~) pxqn-x
= b n"i,xy-"i,x"i,y
n"i,x2-("i,x)2
g.= XI +X2
n1+n2
x- =-
"i,x
n
p±z)¥
Z = x-µ
(J
P(X = k) = e-eex
x!
z = -i-,µ,-
..[ii.
'°' Xs2tat
_
-
Cfo-fe)2
L... fe
a= y- bx
s = 2 "i,(x·-x)2
=..:..-"-' __;_
n-1
= S 2
"i,(x--x)2
l
l
n-1

1.9 Page 9

▲back to top


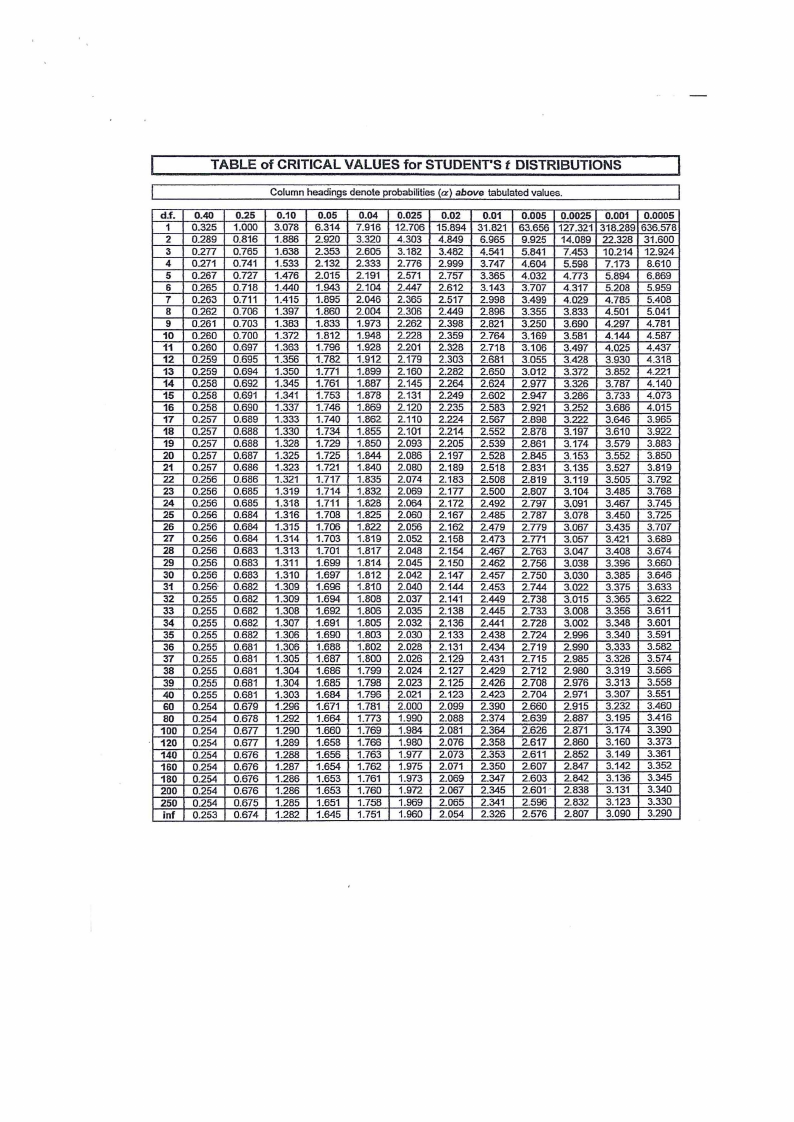
TABLE of CRITICAL VALUES for STUDENT'S t DISTRIBUTIONS
Column headings denote probabilities (a) above tabulated values.
d.f. 0.40 0.25 0.10 0.05 0.04 0.025 0.02 0.01 0.005 0.0025 0.001 0.0005
1 0.325 1.000 3.078 6.314 7.916 12.706 15.894 31.821 63.656 127.321 318.289 636.578
2 0.289 0.816 1.886 2.920 3.320 4.303 4.849 6.965 9.925 14.089 22.328 31.600
3 0.277 0.765 1.638 2.353 2.605 3.182 3.482 4.541 5.841 7.453 10.214 12.924
4 0.271 0.741 1.533 2.132 2.333 2.776 2.999 3.747 4.604 5.598 7.173 8.610
5 0.267 0.727 1.476 2.015 2.191 2.571 2.757 3.365 4.032 4.773 5.894 6.869
6 0.265 0.718 1.440 1.943 2.104 2.447 2.612 3.143 3.707 4.317 5.208 5.959
7 0.263 0.711 1.415 1.895 2.046 2.365 2.517 2.998 3.499 4.029 4.785 5.408
8 0.262 0.706 1.397 1.860 2.004 2.306 2.449 2.896 3.355 3.833 4.501 5.041
9 0.261 0.703 1.383 1.833 1.973 2.262 2.398 2.821 3.250 3.690 4.297 4.781
10 0.260 0.700 1.372 1.812 1.948 2.228 2.359 2.764 3.169 3.581 4.144 4.587
11 0.260 0.697 1.363 1.796 1.928 2.201 2.328 2.718 3.106 3.497 4.025 4.437
12 0.259 0.695 1.356 1.782 1.912 2.179 2.303 2.681 3.055 3.428 3.930 4.318
13 0.259 0.694 1.350 1.771 1.899 2.160 2.282 2.650 3.012 3.372 3.852 4.221
14 0.258 0.692 1.345 1.761 1.887 2.145 2.264 2.624 2.977 3.326 3.787 4.140
15 0.258 0.691 1.341 1.753 1.878 2.131 2.249 2.602 2.947 3.286 3.733 4.073
16 0.258 0.690 1.337 1.746 1.869 2.120 2.235 2.583 2.921 3.252 3.686 4.015
17 0.257 0.689 1.333 1.740 1.862 2.110 2.224 2.567 2.898 3.222 3.646 3.965
18 0.257 0.688 1.330 1.734 1.855 2.101 2.214 2.552 2.878 3.197 3.610 3.922
19 0.257 0.688 1.328 1.729 1.850 2.093 2.205 2.539 2.861 3.174 3.579 3.883
20 0.257 0.687 1.325 1.725 1.844 2.086 2.197 2.528 2.845 3.153 3.552 3.850
21 0.257 0.686 1.323 1.721 1.840 2.080 2.189 2.518 2.831 3.135 3.527 3.819
22 0.256 0.686 1.321 1.717 1.835 2.074 2.183 2.508 2.819 3.119 3.505 3.792
23 0.256 0.685 1.319 1.714 1.832 2.069 2.177 2.500 2.807 3.104 3.485 3.768
24 0.256 0.685 1.318 1.711 1.828 2.064 2.172 2.492 2.797 3.091 3.467 3.745
25 0.256 0.684 1.316 1.708 1.825 2.060 2.167 2.485 2.787 3.078 3.450 3.725
26 0.256 0.684 1.315 1.706 1.822 2.056 2.162 2.479 2.779 3.067 3.435 3.707
27 0.256 0.684 1.314 1.703 1.819 2.052 2.158 2.473 2.771 3.057 3.421 3.689
28 0.256 0.683 1.313 1.701 1.817 2.048 2.154 2.467 2.763 3.047 3.408 3.674
29 0.256 0.683 1.311 1.699 1.814 2.045 2.150 2.462 2.756 3.038 3.396 3.660
30 0.256 0.683 1.310 1.697 1.812 2.042 2.147 2.457 2.750 3.030 3.385 3.646
31 0.256· 0.682 1.309 1.696 1.810 2.040 2.144 2.453 2.744 3.022 3.375 3.633
32 0.255 0.682 1.309 1.694 1.808 2.037 2.141 2.449 2.738 3.015 3.365 3.622
33 0.255 0.682 1.308 1.692 1.806 2.035 2.138 2.445 2.733 3.008 3.356 3.611
34 0.255 0.682 1.307 1.691 1.805 2.032 2.136 2.441 2.728 3.002 3.348 3.601
35 0.255 0.682 1.306 1.690 1.803 2.030 2.133 2.438 2.724 2.996 3.340 3.591
36 0.255 0.681 1.306 1.688 1.802 2.028 2.131 2.434 2.719 2.990 3.333 3.582
37 0.255 0.681 1.305 1.687 1.800 2.026 2.129 2.431 2.715 2.985 3.326 3.574
38 0.255 0.681 1.304 1.686 1.799 2.024 2.127 2.429 2.712 2.980 3.319 3.566
39 0.255 0.681 1.304 1.685 1.798 2.023 2.125 2.426 2.708 2.976 3.313 3.558
40 0.255 0.681 1.303 1.684 1.796 2.021 2.123 2.423 2.704 2.971 3.307 3.551
60 0.254 0.679 1.296 1.671 1.781 2.000 2.099 2.390 2.660 2.915 3.232 3.460
80 0.254 0.678 1.292 1.664 1.773 1.990 2.088 2.374 2.639 2.887 3.195 3.416
100 0.254 0.677 1.290 1.660 1.769 1.984 2.081 2.364 2.626 2.871 3.174 3.390
120 0.254 0.677 1.289 1.658 1.766 1.980 2.076 2.358 2.617 2.860 3.160 3.373
140 0.254 0.676 1.288 1.656 1.763 1.977 2.073 2.353 2.611 2.852 3.149 3.361
160 0.254 0.676 1.287 1.654 1.762 1.975 2.071 2.350 2.607 2.847 3.142 3.352
180 0.254 0.676 1.286 1.653 1.761 1.973 2.069 2.347 2.603 2.842 3.136 3.345
200 0.254 0.676 1.286 1.653 1.760 1.972 2.067 2.345 2.601 · 2.838 3.131 3.340
250 0.254 0.675 1.285 1.651 1.758 1.969 2.065 2.341 2.596 2.832 3.123 3.330
inf 0.253 0.674 1.282 1.645 1.751 1.960 2.054 2.326 2.576 2.807 3.090 3.290

1.10 Page 10

▲back to top


APPENDIX E: The Chi-Square Distribution
Page7 or7

2 Pages 11-20

▲back to top


2.1 Page 11

▲back to top


Cumulative probabilities for POSITIVE z-values are shown below.
z
0.0
0.1
0.2
-
0.3
0.4
0.5
0.6
I 0.7
I 0.8
l 0.9
1.0
1.1
I 1.2
I 1.3
1.4
1.5
1.6
' 1.7
I 1.8
' 1.9
f 2.0
2.1
2.2
2.3
: 2.4
2.5
I 2.6
2.7
2.8
2.9
3.0
3.1
3.2
3.3
3.4
.00
.5000
.5398
.5793
.6179
.6554
.69'15
.7257
.7580
.7881
.8"159
.84"13
.8643
.8849
.9032
.9192
.9332
.9452
.9554
.9641
.97"13
.9772
.9821
.986"1
.9893
.9918
.9938
.9953
.9965
.9974
.9981
.9987
.9990
.9993
.9995
.9997
.01
.5040
.5438
.5832
.6217
.6591
.6950
.729'1
.761'1
.7910
.8186
.8438
.8665
.8869
.9049
.9207
.9345
.9463
.9564
.9649
.9719
.9778
.9826
.9864
.9896
-.9920
.9940
.9955
.9966
.9975
.9982
.9987
.9991
.9993
.9995
.9997
.02
.5080
.5478
.587"1
.6255
.6628
.6985
.7324
.7642
.7939
.8212
.8461
.8686
.8888
.9066
.9222
.9357
.9474
.9573
.9656
.9726
.9783
.9830
.9868
.9898 :
.9922
.9941
.9956
.9967
.9976
.9982
.9987
.9991
.9994
.9995
.9997
.03
.04
S-120 .5160
.5517 .5557
.5910 .5948
.6293 .633"1
.6664 ' .6700 :
.7019 .7054
.7357 .7389
.7673 .7704
.7967 .7995
.8238 .8264
.8485 .8508
.8708 .8729
.8907 .8925
.9082 .9099
.9236 .9251
.9370 .9382
.9484 .9495
.9582 _959·1
-
.9664 .9671
.9732 .9738
.9788 .9793
.9834 .9838
.9871 .9875
.990"1 .9904
.9925 .9927
.9943 .9945
.9957 .9959
.9968 .9969
.9977 .9977
.9983
.9988
.99--8. 4
.9988
.9991 I .9992
.9994 .9994
.9996 .9996
.9997 ! .9997
.05
.5199
.5596
.5987
.6368
.6736
.7088
.7422
.7734
.8023
.8289
.8531
.8749
.8944
.9115
.9265
.9394
.9505
.9599
.9678
.9744
.9798
.9842
.9878
.9906
.9929
.9946
.9960
.9970
.9978
.9984
.9989
.9992
.9994
.9996
.9997
.06
.5239
.5636
.6026
.6406
.6772
.7123
.7454
.7764
.8051
.8315
.8554
.8770
.8962
.9131
.9279
.9406
.9515
.9608
.9686
.9750
.9803
.9846
.9881
.9909
.9931
.9948
.9961
.9971
.9979
.9985
.9989
.9992
.9994
.9996
.9997
.07
.5279
.5675
.6064
.6443
.6808
.7157
.7486
.7794
.8078
.8340
.8577
.8790
.8980
.9147
.9292
.9418
.9525
.9616
.9693
.9756
.9808
.9850
.9884
.9911
.9932
.9949
.9962
.9972
.9979
.9985
.9989
.9992
.9995
.9996
.9997
.08
.5319
.5714
.6103
.6480
.6844
.7190
.7517
.7823
.8106
.8365
.8599
.8810
.8997
.9162
.9306
.9429
.9535
.9625
.9699
.9761
.9812
.9854
.9887
.9913
.9934
_995·1
.9963
.9973
.9980
.9986
.9990
.9993
.9995
.9996
.9997
.09
.5359
.5753
.6141
.6517
.6879
.7224
.7549
.7852
.8133
.8389
.862·1
.8830
.9015
.9177
.9319
.9441
.9545
.9633
.9706
.9767
.9817
.9857
.9890
.9916
.9936
.9952
.9964
.9974
.9981
.9986
.9990
.9993
.9995
.9997
.9998

2.2 Page 12

▲back to top


Z-Table
The table shows cumulative probabilities for the standard normal curve.
Cumulative probabilities for NEGATIVEz-values are shown first. SCROLL
DOWNto the 2nd page for POSITIVEz
z
-3.4
-3.3
-3.2
I -3.1
I -3.0
.I -2.9
-2.8
-2.7
-2.6
-2.5
-2.4
-2.3
-2.2
I -2.1
-2.0
-1.9
-1.8
-1.7
-1.6
-1.5
-1.4
-1.3
-1.2
-1.1
! -1.0
! -0.9
i -0.8
! -0.7
i -0.6
-0.5
-0.4
-0.3
-0.2
-0.1
0.0
.00
.0003
.0005
.0007
.00"10
.0013
.0019
.0026
.0035
.0047
.0062
.0082
.0"107
.0139
.0"179
.0228
.0287
.0359
.0446
.0548
.0668
.0808
.0968
.115"1
.1357
.1587
.1841
.2"1"19
.2420
.2743
.3085
.3446
.3821
.4207
.4602
.5000
.01
.0003
.0005
.0007
.0009
.0013
.00"18
.0025
.0034
.0045
.0060
.0080
.0104
.0136
.0. 174
.0222
.0281
_035·1
.0436
.0537
.0655
.0793
.0951
.1131
.1335
.'1562
."1814
.2090
.2389
.2709
.3050
.3409
.3783
.4"168
.4562
.4960
.02
.0003
.0005
.0006
.0009
.0013
.0018
.0024
.0033
.0044
.0059
.0078
.0"102
.0132
.0170
.02"17
.027_4
.0344
.0427
.0526
.0643
.0778
.0934
.1112
.1314
."1539
.1788
.2061
.2358
.2676
.30"15
.3372
.3745
.4"129
.4522
.4920
.03
.04
.0003 ' .0003
.0004 .0004
.0006 .0006
.0009 .0008
.0012 I .0012
.0017 .0016
.0023 .0023
.0032 .003·1
.0043 .004"1
.0057 .0055
.0075 .0073
.0099 .0096
.0129 .0125
.O·l66 .0162
.0212 .0207
.0268 .0262
.0336 .0329
.04"18 -..0409
.05'16 .0505
.0630 .06"18
.0764 .0749
.0918 .090"1
."1093 .1075
.1292 .127"1
.1515 .1492
.1762 I .1736
.2033 .2005
.2327 .2296
.2643 .261"1
.2981 .2946
.3336 .3300
.3707 .3669
.4090 .4052
.4483 .4443
.4880 .4840
.05
.0003
.0004
.0006
.0008
.0011
.0016
.0022
.0030
.0040
.0054
.0071
.0094
.0122
.0158
.0202
.0256
.0322
.0401
.0495
.0606
.0735
.0885
.1056
.1251
.1469
.1711
.1977
.2266
.2578
.2912
.3264
.3632
.4013
.4404
.4801
.06
.0003
.0004
.0006
.Q00,8
.0011
.0015
.0021
.0029
.0039
.0052
.0069
.0091
.0119
.0154
.0197
.0250
.0314
.0392
.0485
.0594
.0721
.0869
."1038
.1230
.1446
."1685
."1949
.2236
.2546
.2877
.3228
.3594
.3974
.43S4
.4761
.07
.0003
.0004
.0005
.0008
.0011
.0015
.0021
.0028
.0038
.0051
.0068
.0089
.0116
.0·150
.0192
.0244
.0307
.0384
.0475
.0582
.D708
.0853
.1020
.1210
.1423
.1660
."1922
.2206
.2514
.2843
.3192
.3557
.3936
.4325
.4721
.08
.0003
.0004
.0005
.0007
.0010
.0014
.0020
.0027
.0037
.0049
.0066
.0087
.0113
.0146
.0188
.0239
_030·1
.0375
.0465
.057"1
.0694
.0838
.1003
.1190
."1401
.1635
."1894
.2177
.2483
.2810
.3156
.3520
.3897
.4286
.468"1
.09
.0002
.0003
.0005
.0007
.0010
.00·14
.0019
.0026
.0036
.0048
.0064
.0084
.01"10
.0143
.0183
.0233
.0294
.0367
.0455
.0559
.0681
.0823
.0985
.1170
.1379
.1611
."1867
.2148
.2451
.2776
_3·121
.3483
.3859
.4247
.464"1