


 |
HSS511S - HEALTH SCIENCES STATISTICS - 2ND OPP - JULY 2022 |
|
|
1 Page 1 |
▲back to top |
n Am I BI A u n IVER s ITY
0 F SCIEn CE Ano TECHnOLOGY
I
'
Facultyof Health,Applied
ScienceasndNaturalResources
Department of Health Sciences
c/oBrahmsandHaydnStreets
Private Bag13388
Windhoek
NAMIBIA
T: +264 61207 2899
F: +264 61 207 9899
E: dhs@nust.na
W: www.nust.na
QUALIFICATION : BACHELOR OF MEDICAL LABORATORY SCIENCES; BACHELOR OF HUMAN
NUTRITION; BACHELOR OF SCIENCE IN HEALTH INFORMATION SYSTEMS
MANAGEMENT; BACHELOR OF ENVIRONMENTAL HEAL TH SCIENCES
QUALIFICATIONCODE: 08BMLS;
08BOHN; 08BOHS; 07BSHM
COURSECODE: HSSSllS
SESSION:JULY 2022
DURATION: 3 HOURS
LEVEL: 5
COURSENAME: HEALTHSCIENCESTATISTICS
PAPER:THEORY
MARKS: 100
SUPPLEMENTARY/SECONDOPPORTUNITYQUESTION PAPER
EXAMINER(S) Dr D. NTIRAMPEBA
Dr D.B.GEMECHU
MODERATOR: Dr Laria Aku-Akai
.INSTRUCTIONS
l. Answer ALL the questions.
2. Part I of this question paper entails multiple choice questions. Write down the letter
corresponding to the best option for each question.
3. For Part 11,you are required to write only your final solution on the answer sheet.
4. For Part Ill, you are required to show clearly all the steps used in the calculations.
5. Write clearly and neatly.
6. Number the answers clearly.
PERMISSIBLEMATERIALS
Nonprogrammable scientific calculator
THIS QUESTION PAPERCONSISTSOF 5 PAGES{Including this front page)
|
|
2 Page 2 |
▲back to top |
PART I: Write down the letter corresponding to the best option for each question.
QUESTION 1 [12 marks)
1.1. What is an event?
[21
A. The sample from a national survey
B. The space between events A and B
C. The subset of a sample space
D. None of the above
1.2. A parameter refers to
[21
A. Calculation made from the population
B. A measurement that is made from the population
C. A value observed in the experiment
D. All of the above.
1.3. What level of measurement would ethnicity be classified ?
[2]
A. Nominal
B. Ordinal
C. Interval
D. Ratio
1.4. Which of the following methods are used in presenting quantitative data?
[2]
A. Bar charts, pie charts and Histogram
B. Bar charts, pie charts and frequency distribution tables
C. Bar charts, Mean, Median, and Mode
D. Mean, Median, Mode, Variance, Standard deviation, and Coefficient of Variation
1.5. If P (A)= 0.10, P (B) = 0.40 and P (A and B) = 0.03, then A and Bare:
[2]
A. Statistically dependent events
B. Statistically independent events
C. Non-mutually exclusive events
D. Mutually exclusive events
1.6. What is the median of the following scores: 7, 3, 0, 1, 67
A.O
C. 4.5
[2]
B.3
D. 3.4
Page 2 ofS
|
|
3 Page 3 |
▲back to top |
Part II [28 MARKS]: Short answer questions. You are required to write down only your final
answer on your answer sheet.
QUESTION 2 [28 MARKS]
2.1. Classify each random variable as either discrete or continuous.
[3]
2.1.1. The number of assignments submitted by mail.
2.1.2. The number of stones in a basket.
2.1.3. The distance I walk to campus.
1, 10 2.2. The sum of the weight of 10 new-born babies in a hospital A x x 2 , x 3 , x 4 , .. , x is known
to be 28kg. The sum of the weight of 10 new-born babies in a hospital B
1, 10 y y2, y 3 , y4, .. , y is known to be 25kg. Answer the following questions based on this
information.
2.2.1. Lf21(xi + 3) = __
[2]
2.2.2. Lf21(2xi - 3) = __
[2]
ya 2.2.3. Y=---
2.2.4. L[ 21(xi +
= __
[2]
[2]
2.3. Solve for x and provided your final answer on your answer sheet
= a) 3x-l 27
= b) 81 x2 33x+l
= c) x+3 + x-5
2
4
8
d) --:,4;;--:,;;- 2 6
x+2 1+x X
Part Ill [60 MARKS]: show clearly all the steps used in the calculations
[3] .
[S] .
[3]
[6]
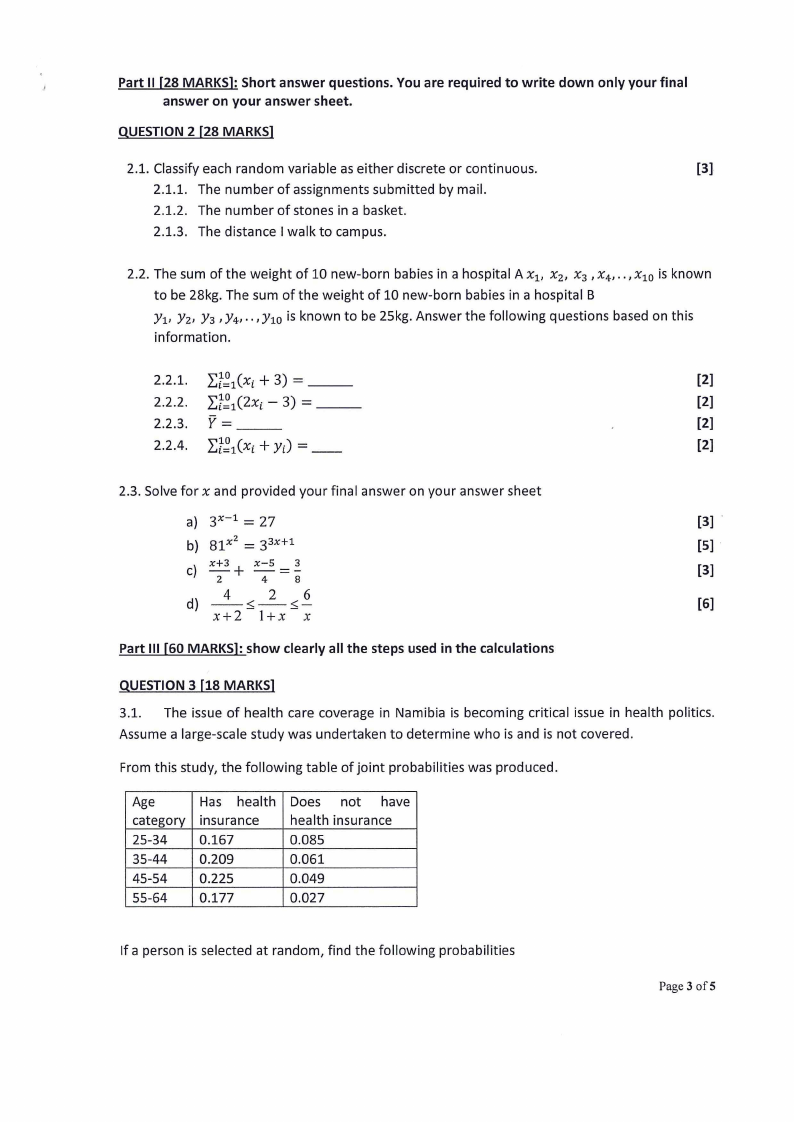
QUESTION 3 [18 MARKS]
3.1. The issue of health care coverage in Namibia is becoming critical issue in health politics.
Assume a large-scale study was undertaken to determine who is and is not covered.
From this study, the following table of joint probabilities was produced.
Age
category
25-34
35-44
45-54
55-64
Has health
insurance
0.167
0.209
0.225
0.177
Does not have
health insurance
0.085
0.061
0.049
0.027
If a person is selected at random, find the following probabilities
Page 3 ofS
|
|
4 Page 4 |
▲back to top |
3.1.1. What is the probability the person is between 55 and 64 years old or does not have health
insurance?
[2]
3.1.2. If the person is below 55 years of age, what is the probability that he/she has health
insurance
[4] .
3.2. Suppose that the four food inspectors at a food factory are supposed to stamp the
expiration date on each package of food at the end of the production line. John, who
stamps 20% of the packages, fails to stamp the expiration date once in every 200 packages;
Tom, who stamps 60% of the packages, fails to stamp the expiration date once in every
100 packages; Jeff, who stamps 15% of the packages, fails to stamp the expiration date
once in every 90 packages; and Pat, who stamps 5% of the packages, fails to stamp the
expiration date once in every 200 packages.
3.2.1. If a customer picks at random a package of a package, what is the probability that it does
not show the expiration date?
[4]
3.2.2. If a customer complains that her package does not show the expiration date, what is the
probability that it was inspected by John
[4] .
3.3. A diagnostic test for cancer is said to be 98% accurate if a person has the disease. Also, if a
person does not have cancer, the test will report that he or she does not have it with
probability 0.1. Only 0.1% has the disease in question. If a person is chosen at random from
the population and diagnostic test indicates that he or she has cancer, what is the
probability that he or she does, in fact, have cancer.
[4]
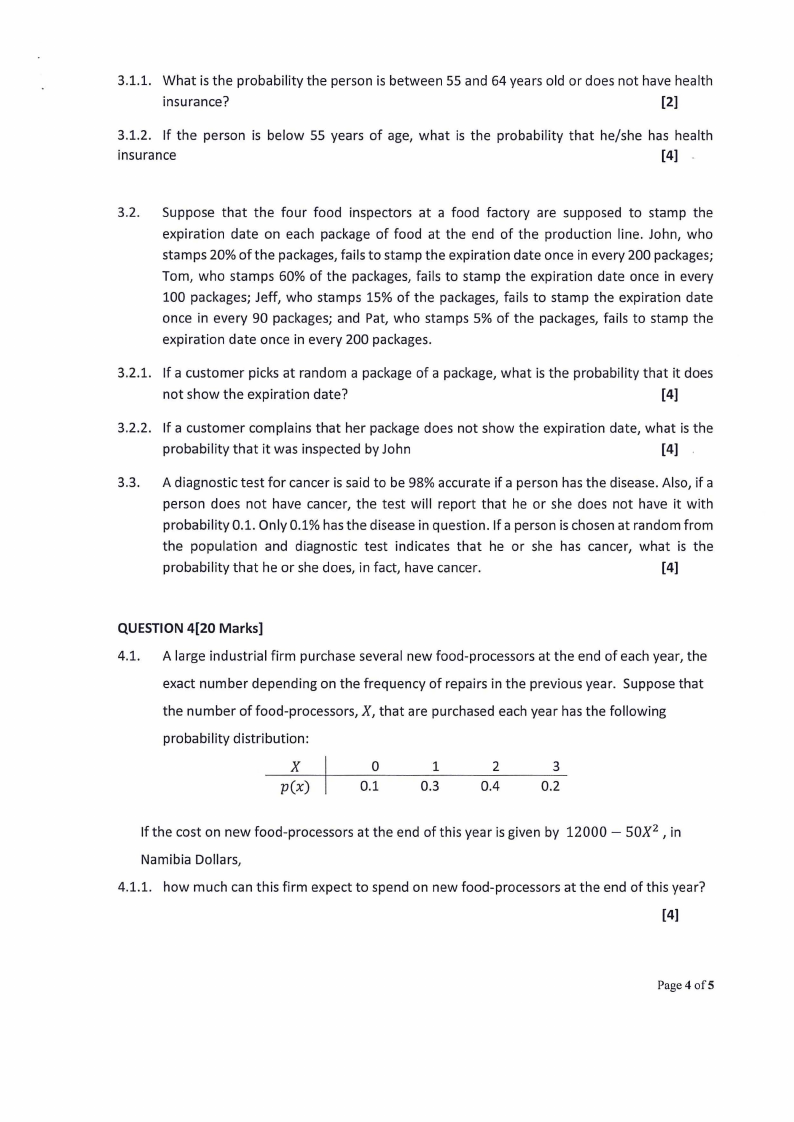
QUESTION 4[20 Marks]
4.1. A large industrial firm purchase several new food-processors at the end of each year, the
exact number depending on the frequency of repairs in the previous year. Suppose that
the number of food-processors, X, that are purchased each year has the following
probability distribution:
X
0
1
2
3
p(x)
0.1
0.3
0.4
0.2
If the cost on new food-processors at the end of this year is given by 12000 - SOX2 , in
Namibia Dollars,
4.1.1. how much can this firm expect to spend on new food-processors at the end of this year?
[4]
Page 4 ofS
|
|
5 Page 5 |
▲back to top |
\\
4.1.2. find the variance of the number of food-processors that are purchased for this firm at the
end of this year.
[6]
4.1.3. find the coefficient of variation for the number of food-processors that are purchased for
this firm at the end of this year.
[2]
4.2.
The loaves of rye bread distributed to local stores by a certain bakery have an average length
of 30 centimeters and a standard deviation of 2 centimeters. Assuming that the lengths are
normally distributed,
4.2.1. what percentage of the loaves are longer than 31.7 centimeters?
[3]
4.2.2. below what length of rye bread loaf will 15% of the loaves fall?
[5]
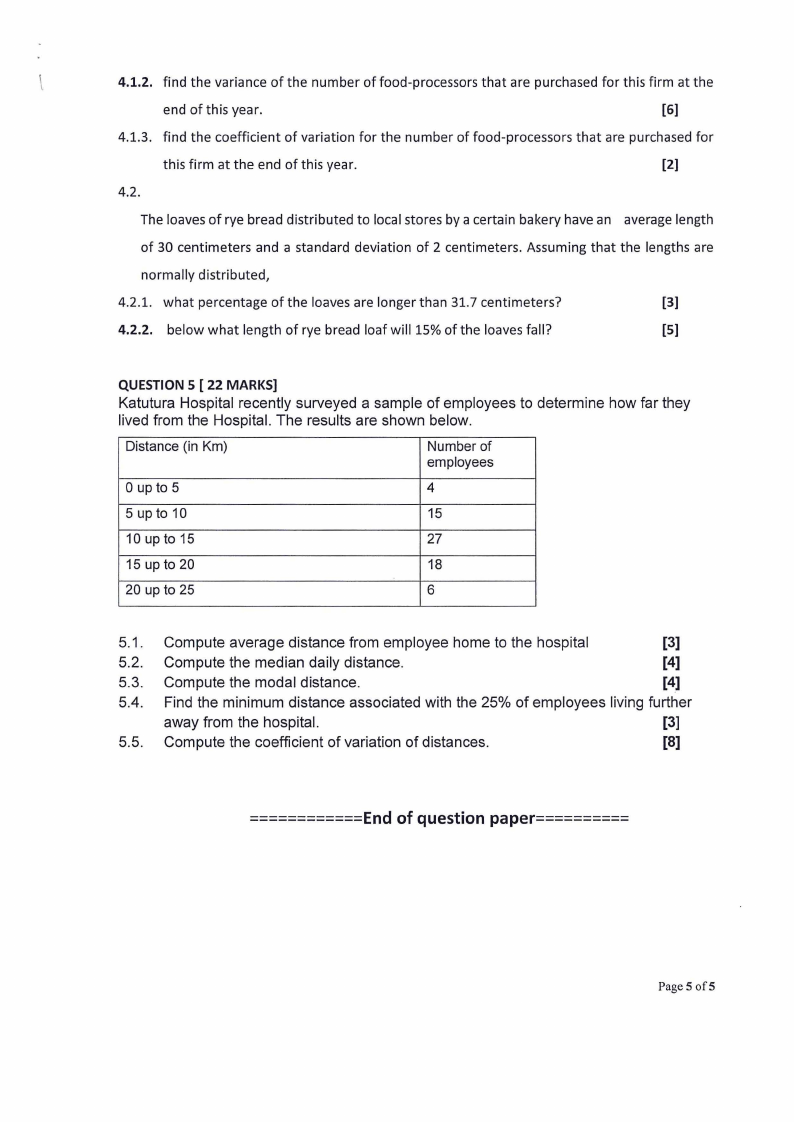
QUESTION 5 [ 22 MARKS]
Katutura Hospital recently surveyed a sample of employees to determine how far they
lived from the Hospital. The results are shown below.
Distance (in Km)
Number of
employees
0 up to 5
4
5 up to 10
15
10 upto 15
27
15 up to 20
18
20 up to 25
6
5.1. Compute average distance from employee home to the hospital
[3]
5.2. Compute the median daily distance.
[4]
5.3. Compute the modal distance.
[4]
5.4. Find the minimum distance associated with the 25% of employees living further
away from the hospital.
[3]
5.5. Compute the coefficient of variation of distances.
[8]
---------------------E-n--d of quest,·on paper--------------------
Page 5 of5