


 |
PBT501S - PROBABILITY THEORY 1 - 2ND OPP - JANUARY 2024 |
|
|
1 Page 1 |
▲back to top |
nAml BIA UnlVERSITY
OF SCJEnCEAnOTECHnOLOGY
FacultyofHealthN, atural
ResourceasndApplied
Sciences
Schoool f NaturalandApplied
Sciences
Departmentof Mathematics,
StatisticsandActuarialScience
13JacksonKaujeuaStreet
PrivateBag13388
Windhoek
NAMIBIA
T: •264 612072913
E: msas@nust.na
W: www.nust.na
QUALIFICATION: BACHELORof SCIENCE
QUALIFICATIONCODE: 07BOSC
COURSE:PROBABILITYTHEORY 1
DATE: JANUARY 2024
DURATION: 3 HOURS
LEVEL:5
COURSECODE: PBTS0lS
SESSION: 1
MARKS: 100
SECOND OPPORTUNITY/ SUPPLEMENTARY: EXAMINATION QUESTION PAPER
EXAMINER:
MODERATOR:
Dr, Dismas Ntirampeba
Mr, Jonas Amunyela
INSTRUCTIONS:
1. Answer all questions on the separate answer sheet.
2. Please write neatly and legibly.
3. Do not use the left side margin of the exam paper. This must be allowed for the examiner.
4. No books, notes and other additional aids are allowed.
5. Mark all answers clearly with their respective question numbers.
PERMISSIBLEMATERIALS:
1. Non-Programmable Calculator
ATTACHEMENTS
1. Z Table
This paper consists of 4 pages including this front page
|
|
2 Page 2 |
▲back to top |
Question 1 [20 marks]
1.1 Briefly explain the following terminologies as they are applied in set theory and probability
theory.
(i) Set
[2]
(ii) Size of a set
[2]
(iii) Sample space
[2]
(iv) Event
[2]
(v) Mutually exclusive events (say A and B)
[2]
1.2 Consider the sample space S = {l, 2, 3, 4, 5, 6, 7, 8, 9, 10} and the events A = {1, 2, 5, 6},
B = {3, 4, 5, 6, 7}, C = {2, 4, 6}, D = {l, 3, 6}, E = {l, 2, 5, 9}.
(i) Are A, B, C, D , and E pairwise mutually exclusive? Explain why.
[2]
Assuming that all elements are equiprobable, find:
(ii) P(S - S)
[2]
(iii) P(A u C)
[3]
(iv) P(E - D)
[3]
Question 2 [20 marks]
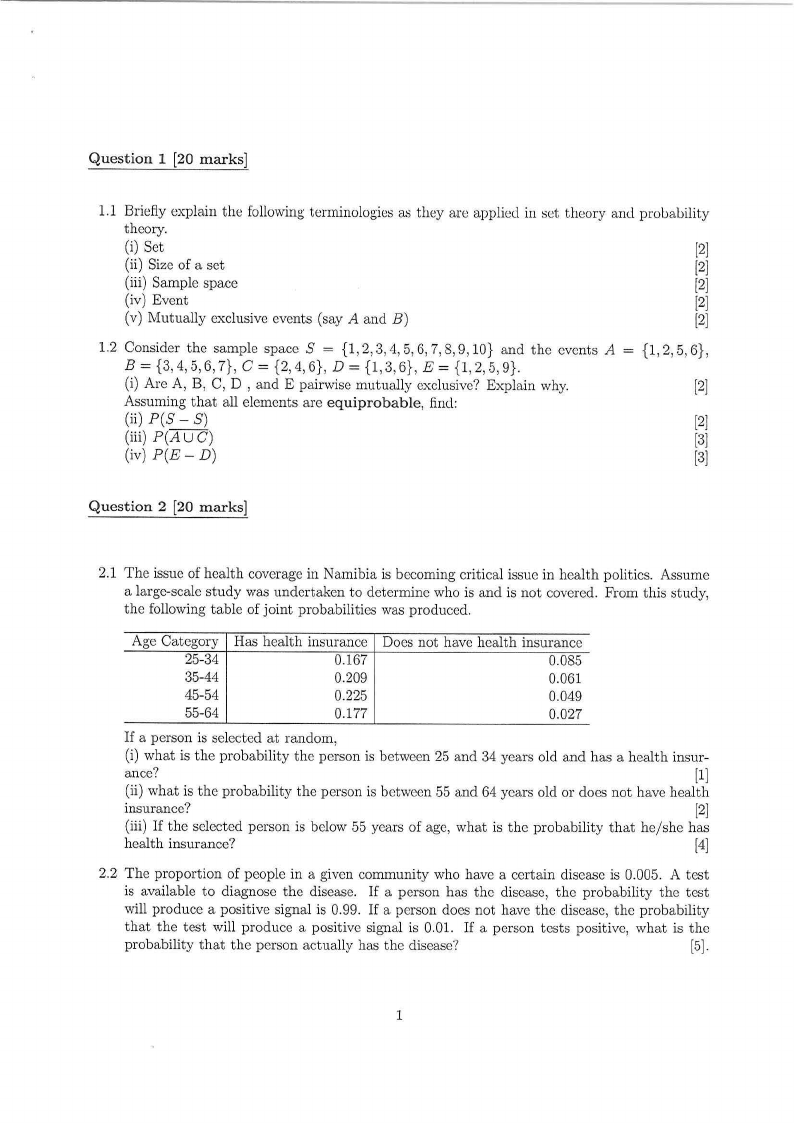
2.1 The issue of health coverage in Namibia is becoming critical issue in health politics. Assume
a large-scale study was undertaken to determine who is and is not covered. From this study,
the following table of joint probabilities was produced.
Age Category
25-34
35-44
45-54
55-64
Has health insurance
0.167
0.209
0.225
0.177
Does not have health insurance
0.085
0.061
0.049
0.027
If a person is selected at random,
(i) what is the probability the person is between 25 and 34 years old and has a health insur-
ance?
[l]
(ii) what is the probability the person is between 55 and 64 years old or does not have health
insurance?
[2]
(iii) If the selected person is below 55 years of age, what is the probability that he/she has
health insurance?
[4]
2.2 The proportion of people in a given community who have a certain disease is 0.005. A test
is available to diagnose the disease. If a person has the disease, the probability the test
will produce a positive signal is 0.99. If a person does not have the disease, the probability
that the test will produce a positive signal is 0.01. If a person tests positive, what is the
probability that the person actually has the disease?
[5].
1
|
|
3 Page 3 |
▲back to top |
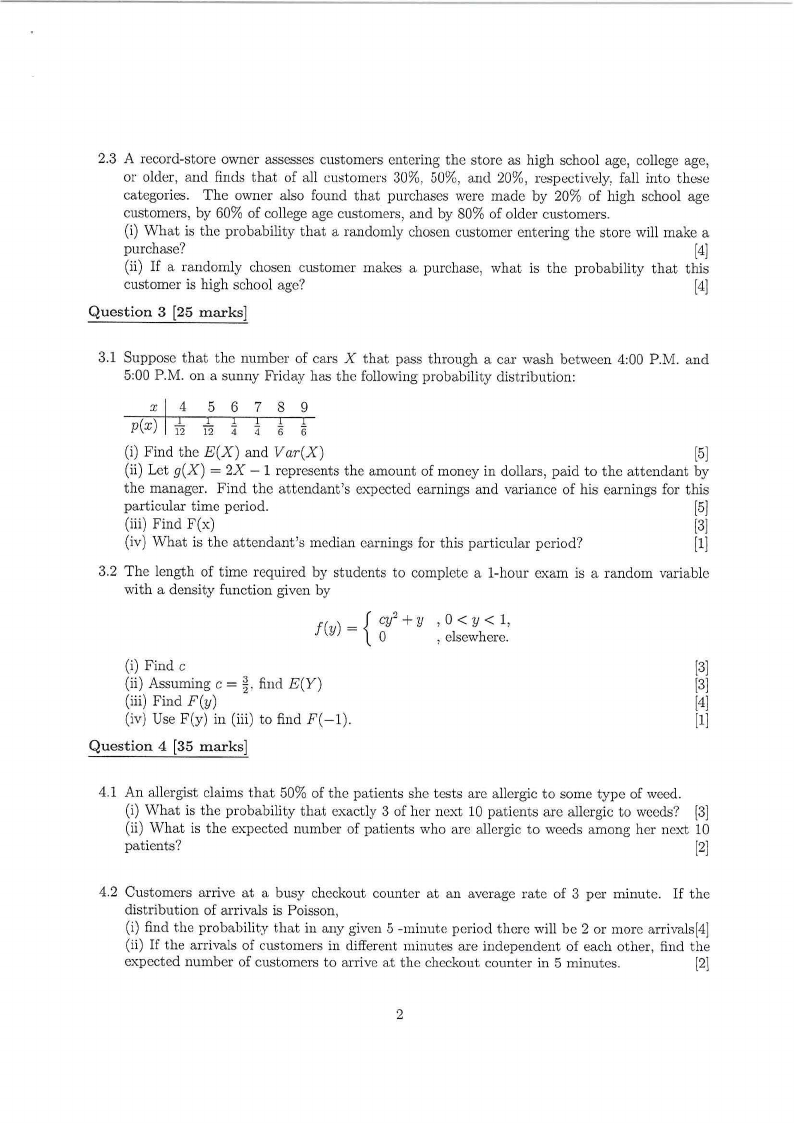
2.3 A record-store owner assesses customers entering the store as high school age, college age,
or older, and finds that of all customers 30%, 50%, and 20%, respectively, fall into these
categories. The owner also found that purchases were made by 20% of high school age
customers, by 60% of college age customers, and by 80% of older customers.
(i) What is the probability that a randomly chosen customer entering the store will make a
purchase?
[4]
(ii) If a randomly chosen customer makes a purchase, what is the probability that this
customer is high school age?
[4]
Question 3 [25 marks]
3.1 Suppose that the number of cars X that pass through a car wash between 4:00 P.M. and
5:00 P.M. on a sunny Friday has the following probability distribution:
t i I r p(x) I
¼
£
(i) Find the E(X) and Var(X)
[5]
(ii) Let g(X) = 2X - 1 represents the amount of money in dollars, paid to the attendant by
the manager. Find the attendant's expected earnings and variance of his earnings for this
particular time period.
[5]
(iii) Find F(x)
[3]
(iv) What is the attendant's median earnings for this particular period?
[1]
3.2 The length of time required by students to complete a I-hour exam is a random variable
with a density function given by
f(y) = { cOy+2 y '0 < y < l,
, elsewhere.
t (i) Find c
(ii) Assuming c = find E(Y)
[3]
[3]
(iii) Find F(y)
[4]
(iv) Use F(y) in (iii) to find F(-1).
[1]
Question 4 [35 marks]
4.1 An allergist claims that 50% of the patients she tests are allergic to some type of weed.
(i) What is the probability that exactly 3 of her next 10 patients are allergic to weeds? [3]
(ii) What is the expected number of patients who are allergic to weeds among her next 10
patients?
[2]
4.2 Customers arrive at a busy checkout counter at an average rate of 3 per minute. If the
distribution of arrivals is Poisson,
(i) find the probability that in any given 5 -minute period there will be 2 or more arriva1s[4]
(ii) If the arrivals of customers in different minutes are independent of each other, find the
expected number of customers to arrive at the checkout counter in 5 minutes.
[2]
2
|
|
4 Page 4 |
▲back to top |
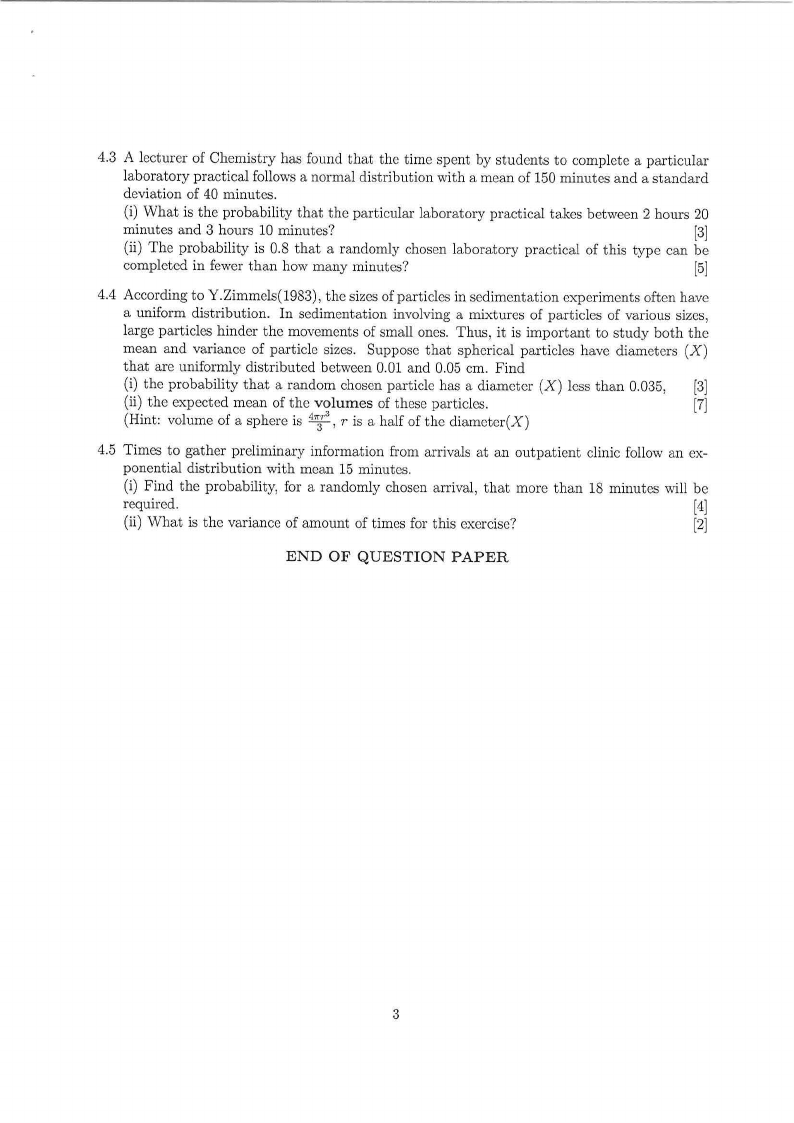
4.3 A lecturer of Chemistry has found that the time spent by students to complete a particular
laboratory practical follows a normal distribution with a mean of 150 minutes and a standard
deviation of 40 minutes.
(i) What is the probability that the particular laboratory practical takes between 2 hours 20
minutes and 3 hours 10 minutes?
[3]
(ii) The probability is 0.8 that a randomly chosen laboratory practical of this type can be
completed in fewer than how many minutes?
[5]
4.4 According to Y.Zimmels(1983), the sizes of particles in sedimentation experiments often have
a uniform distribution. In sedimentation involving a mixtures of particles of various sizes,
large particles hinder the movements of small ones. Thus, it is important to study both the
mean and variance of particle sizes. Suppose that spherical particles have diameters (X)
that are uniformly distributed between 0.01 and 0.05 cm. Find
(i) the probability that a random chosen particle has a diameter (X) less than 0.035, [3]
(ii) the expected mean of the volumes of these particles.
[7]
(Hint: volume of a sphere is 4";· 3 , r is a half of the diameter(X)
4.5 Times to gather preliminary information from arrivals at an outpatient clinic follow an ex-
ponential distribution with mean 15 minutes.
(i) Find the probability, for a randomly chosen arrival, that more than 18 minutes will be
required.
[4]
(ii) What is the variance of amount of times for this exercise?
[2]
END OF QUESTION PAPER
3
|
|
5 Page 5 |
▲back to top |
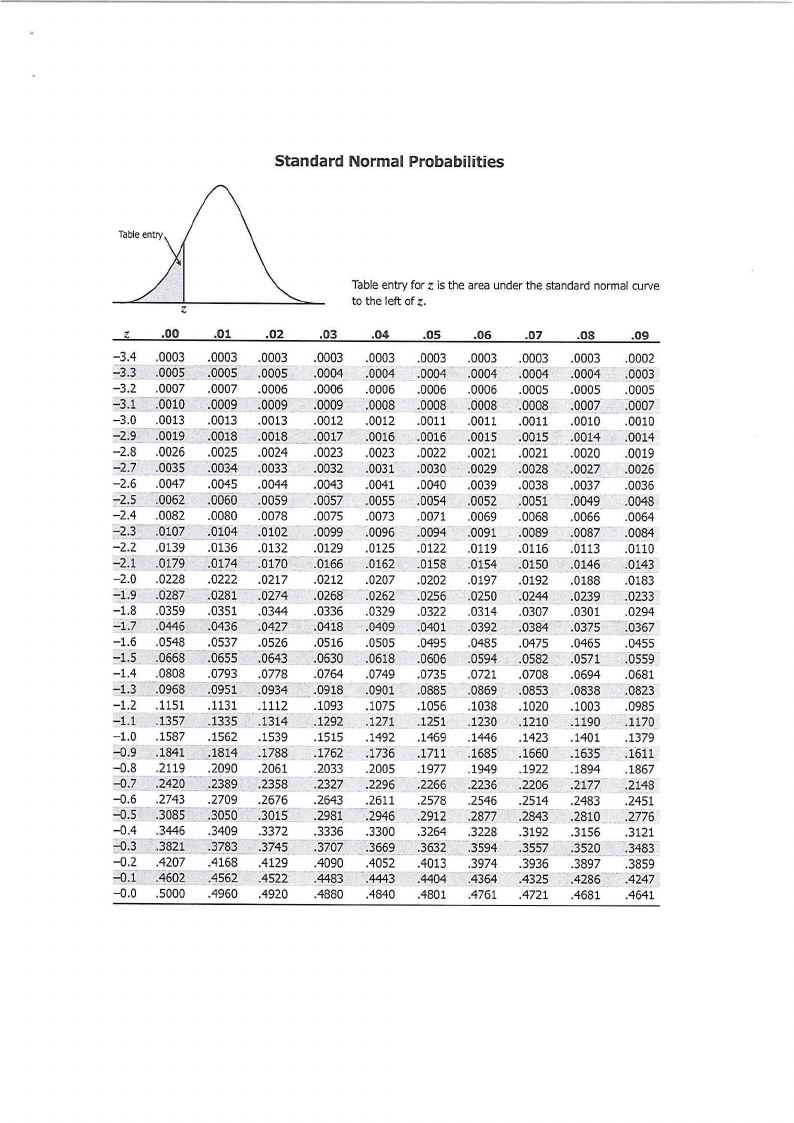
Standard Normal Probabilities
Tableentry
Table entry for z is the area under the standard normal curve
z
to the left of z.
z .oo .01
.02
.03
.04
.OS
.06
.07
.08
.09
-3.4 .0003 .0003 .0003 .0003
-3.3 .000~_ .boos .000~ .0004
-3.2 .0007 .0007 .0006 .0006
-3.1 -.0010
.0009 .0009 .0009
-3.0
-2.9
-2.8
.0013
.0019
.0026
-
-
.0013
.0018
.0025
.0013 .0012
.0018
.0024
--
.0017
.0023
-2.7 .0035 .0034 .0033 .0032
-2.6 .0047 .0045 .0044
-2.5 7)og .0060 .0059
.0043
.0057
-2.4 .0082 .0080 .0078 .0075
-2.3 .0107 .0104 .0102 .0099
-2.2 .0139 .0136 .0132 .0129
-2.1 .01[9 .0174 .0170 .0166
-2.0 .0228 .0222 .0217 .0212
-1.9 .0287 .0281 -.0274
.0268
-1.8 .0359 .0351 .0344 .0336
-1.7 .0446 .0436 ,0127 .0418
-1.6 .0548 .0537 .0526 .0516
-1.5 .06§? .0655 .0643 .0630
-1.4 .0808 .0793 .0778 .0764
-1.3 -.0968 _ _,.Q951 .0934 .0918
-1.2 .1151 .1131 .1112 .1093
-1.1 .1357 .1335 .1314 .1292
-1.0 .1587 .1562 .1539 .1515
-0.9 .1841 .1814 .1788 .1762
-0.8 .2119 .2090 .2061 .2033
-0.7 .242Q .2389 .2358 .2327
-0.6 .2743 .2709 .2676 .2643
-0.5 .30~ .3_050..•. 1Q15 .2981
-0.4 .3446 .3409 .3372 .3336
-0.3 .3821 .3783 .3745 :3707
-0.2 .4207 .4168 .4129
-oT -1602 ~4562 .4522
.4090
.4483
-0.0 .5000 .4960 .4920 .4880
.0003
.0004
.0006
.0008
.0012
.0016
.0023
.0031
.0041
.0055
.0073
.0096
.0125
.0162
.0207
.0262
.0329
.0409
.0505
.0618
.0749
.0901
.1075
.1271
.1492
.1736
.2005
.2296
.2611
.2946
.3300
.3669
.4052
.4443
.4840
.0003
.0004
.0006
.0008
.0011
.0016
.0022
.0030
.0040
.0054
.0071
.0094
.0122
.0158
.0202
.0256
.0322
.0401
.0495
.0606
.0735
.0885
.1056
.1251
.1469
.1711
.1977
.2266
.2578
.2912
.3264
.3632
.4013
.4404
.4801
.0003
.0004
.0006
.0008
.0011
.0015
.0021
.0029
.0039
.0052
.0069
.0091
.0119
.0154
.0197
.0250
.0314
.0392
.0485
.0594
.0721
.0869
.1038
.1230
.1446
.1685
.1949
.2236
.2546
.2877
.3228
.3594
.3974
.4364
.4761
.0003
.0004
.0005
.0008
.0011
.0015
.0021
.0028
.0038
.0051
.0068
.0089
.0116
.0150
.0192
.0244
.0307
.0384
.0475
.0582
.0708
.0853
.1020
.1210
.1423
.1660
.1922
.2206
.2514
.2843
.3192
.3557
.3936
.4325
.4721
.0003
.0004
.0005
.0007
.0010
.0014
.0020
.0027
.0037
.0049
.0066
.0087
.0113
.0146
.0188
.0239
.0301
.0375
.0465
.0571
.0694
.0838
.1003
.1190
.1401
.1635
.1894
.2177
.2483
.2810
.3156
.3520
.3897
.4286
.4681
.0002
.0003
.0005
:-0007
.0010
.0014
.0019
.0026
.0036
.0048
.0064
.0084
.0110
.0143
.0183
.0233
.0294
.0367
.0455
.0559
.0681
.0823
.0985
.1170
.1379
.1611
.1867
.2148
.2451
.2776
.3121
.3483
.3859
.4247
.4641
|
|
6 Page 6 |
▲back to top |
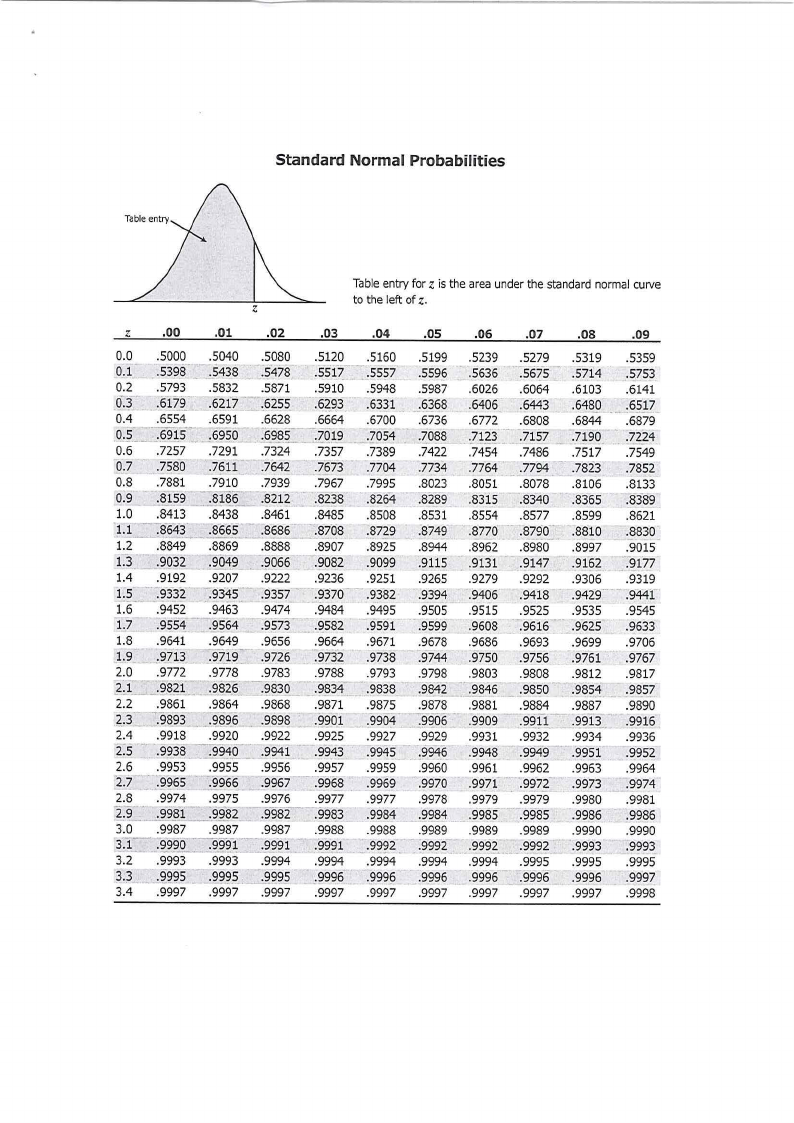
Standard Normal Probabilities
z Table entry for is the area under the standard normal curve
to the left of z.
z .oo .01
.02
.03
0.0 .5000 .5040 .5080 .5120
0.1 .5398 .5438 .5478 .5517
0.2 .5793 .5832 .5871 .5910
0-:3 .6179 .6217 .6255 .6293
0.4
0.5
.6554
.. 6915--
.6591
..=.6950
..666_298_-8~
.6664
.7019
0.6 .7257 .7291 .7324 .7357
0.7 .7580 .7611 .7642 .7673
0.8 .7881 .7910 .7939 .7967
0.9 .8159 .8186 .8212 .8238
1.0 .8413 .8438 .8461 .8485
1.1 .8643
.8686 .8708
1.2 .8849 .8869 .8888 .8907
1.3 .9032 .9049 .9066 .9082
1.4 .9192 .9207 .9222 .9236
1.5 .9332 .9345 .9357 .9370
1.6 .9452 .9463 .9474 .9484
1.7 .9554 :,9564 .9573 .9582
- 1.8 .9641 .9649 .9656 .9664
1.9 ,9713 .9719 .9726 -~97~2
2.0 .9772 .9778 .9783 .9788
2.1 .9821 .9826 -:9830 .9834
2.2 .9861 .9864 .9868 .9871
- 2.3 ~893 .9896 .9898 .9901
2.4 .9918 .9920 .9922 .9925
2.5 .9938 .9940 .9941 .9943
2.6 .9953 .9955 .9956 .9957
2.7 .9965 .9966 .9967 .9968
2.8 .9974 .9975
23].0--
.9981 --~82
.9987 .9987
.9976
.9982
.9987
.9977
.99~3
.9988
3-:Y-- ~~_9..799.9.1
.9991 .9991
3.2 .9993 .9993 .9994 .9994
3.3 -~~95 .9995 -.9995 .9996-
3.4 .9997 .9997 .9997 .9997
.04
.5160
.5557
.5948
.6331
.6700
.zo54
.7389
.7704
.7995
.8264
.8508
.8729
.8925
.9099
.9251
.9382
.9495
.9591
.9671
.9738
.9793
.9838
.9875
.9904
.9927
.9945
.9959
.9969
.9977
.9984
.9988
.9992
.9994
.9996
.9997
.05
.06
.5199
.5596
.5987
.6368
.6736
.7088
.7422
.7734
.8023
.8289
.8531
.8749
.8944
.9115
.9265
.9394
.9505
.9599
.9678
.9_744
.9798
.9842
.9878
.9906
.9929
.9946
.9960
.9970
.9978
.9984
.9989
.9992
.9994
.9996
.9997
.5239
.5636
.6026
.6406
.6772
.7123
.7454
.7764
.8051
.8315
.8554
.8770
.8962
.9131
.9279
.9406
.9515
.9608
.9686
.9750
.9803
.9846
.9881
.9909
.9931
.9948
.9961
.9971
.9979
.9985
.9989
.9992
.9994
.9996
.9997
.07
.08
.09
.5279
.56i5
-
.6064
.6443
.6808
.7157
.7486
.7794
.8078
.8340
.8577
.8790
.8980
.9147
.9292
.9418
.9525
.9616
.9693
.9756
.9808
.9850
.9884
.9911
.9932
.9949
.9962
.9972
.9979
.9985
.9989
.9992
.9995
.9996
.9997
.5319 .5359
.5714 .5753
.6103 .6141
.648.9 - - .6517
.6844 .6879
.7190 .7224
.7517 .7549
.7823 .7852
.8106 .8133
.8365 .8389
.8599 .8621
.8810 .8830
.8997 .9015
.9162 .9177
.9306 .9319
.9429 .9441
.9535 .9545
.9625 .9633
.9699 .9706
.9761 .9767
.9812 .9817
.9854 .9857
.9887 .9890
.9913 .9916
.9934 .9936
.9951 .9952
.9963 .9964
.9973 .9974
.9980 .9981
.9986 .9986
.9990 .9990
.9993 .9993
.9995 .9995
.9996 .9997
.9997 .9998