


 |
AME820S-ADVANCED MACROECONOMICS -1ST OPP-NOV 2024 |
|
|
1 Page 1 |
▲back to top |
nAm I BI A un IVE RSITY
OF SCIEnCE Ano TECHnOLOGY
FACULTY OF COMMERCE, HUMAN SCIENCES AND EDUCATION
DEPARTMENT OF ECONOMICS ACCOUNTING AND FINANCE
QUALIFICATION:
BACHELOR OF ECONOMICS HONOURS DEGREE
QUALIFICATION CODE:
08HECO LEVEL:
8
COURSE CODE:
AME820S COURSE NAME: ADV AN CED MACROECONOMICS
SESSION: Nnv ;;)h _<j:_/,_-:-_ PAPER:
DURATION:
3 HOURS MARKS:
THEORY
100
FIRST OPPORTUNITY EXAMINATION QUESTION PAPER
EXAMINER (S)
Prof. T. Sunde
MODERATOR:
Dr Reinhold Kamati
INSTRUCTIONS
1. Answer FOUR (4) questions.
2. Write clearly and neatly.
3. Number all the answers.
PERMISSIBLE MATERIALS
I.Ruler
2. Calculator
THIS QUESTION PAPER CONSISTS OF 4 PAGES, INCLUDING THE COVER PAGE
1
|
|
2 Page 2 |
▲back to top |
QUESTION 1 [25 marks]
Explain how economists use models to understand the economy and discuss the limitations of
market-clearing models in the context of macroeconomic analysis. In your answer, address the
following:
a) Define and differentiate between microeconomics and macroeconomics.
(5 marks)
b) Describe the process of building an economic model and explain its usefulness in
summarising the relationships among economic variables. Provide an example of such a
model.
(10 marks)
c) Define a market-clearing model and explain why the assumption of price flexibility may
not always be realistic in the short run. Use real-world examples to support your argument.
(10 marks)
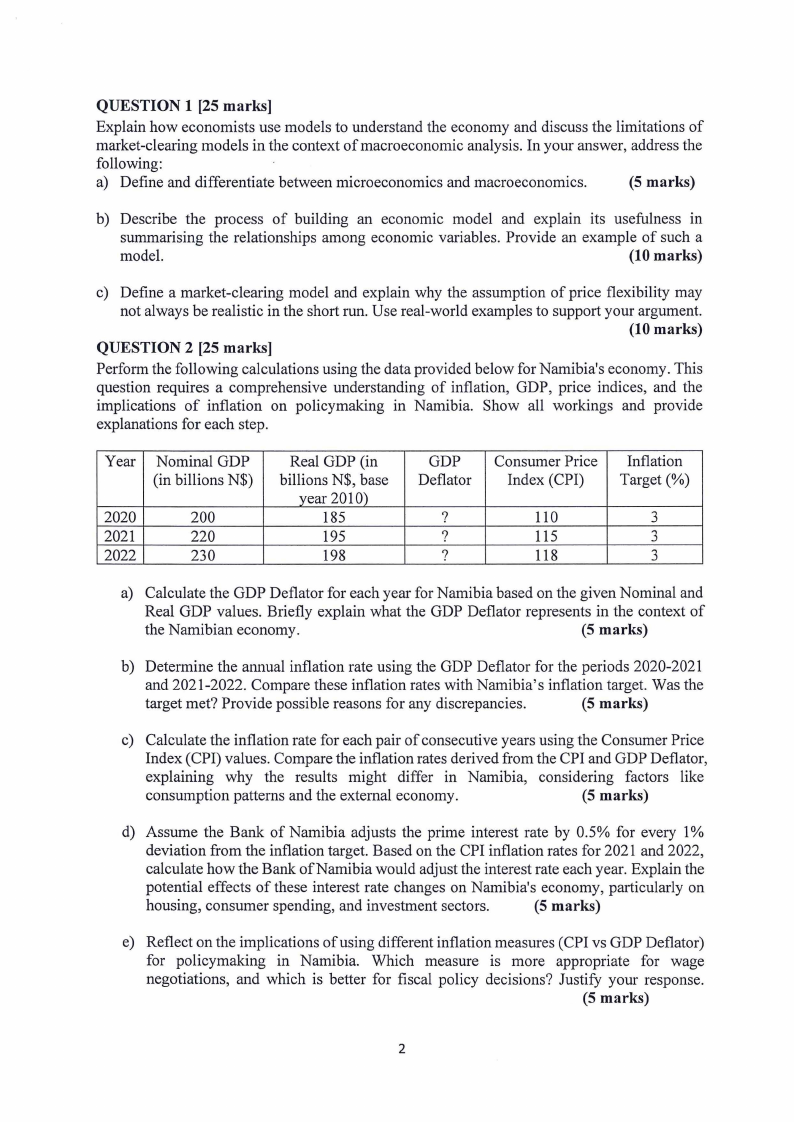
QUESTION 2 [25 marks]
Perform the following calculations using the data provided below for Namibia's economy. This
question requires a comprehensive understanding of inflation, GDP, price indices, and the
implications of inflation on policymaking in Namibia. Show all workings and provide
explanations for each step.
Year Nominal GDP
(in billions N$)
2020
200
2021
220
2022
230
Real GDP (in
billions N$, base
year 2010)
185
195
198
GDP Consumer Price Inflation
Deflater Index (CPI) Target(%)
?
110
3
?
115
3
?
118
3
a) Calculate the GDP Deflater for each year for Namibia based on the given Nominal and
Real GDP values. Briefly explain what the GDP Deflater represents in the context of
the Namibian economy.
(5 marks)
b) Determine the annual inflation rate using the GDP Deflater for the periods 2020-2021
and 2021-2022. Compare these inflation rates with Namibia's inflation target. Was the
target met? Provide possible reasons for any discrepancies.
(5 marks)
c) Calculate the inflation rate for each pair of consecutive years using the Consumer Price
Index (CPI) values. Compare the inflation rates derived from the CPI and GDP Deflater,
explaining why the results might differ in Namibia, considering factors like
consumption patterns and the external economy.
(5 marks)
d) Assume the Bank of Namibia adjusts the prime interest rate by 0.5% for every 1%
deviation from the inflation target. Based on the CPI inflation rates for 2021 and 2022,
calculate how the Bank of Namibia would adjust the interest rate each year. Explain the
potential effects of these interest rate changes on Namibia's economy, particularly on
housing, consumer spending, and investment sectors.
(5 marks)
e) Reflect on the implications of using different inflation measures (CPI vs GDP Deflater)
for policymaking in Namibia. Which measure is more appropriate for wage
negotiations, and which is better for fiscal policy decisions? Justify your response.
(5 marks)
2
|
|
3 Page 3 |
▲back to top |
QUESTION 3 (25 marks]
As a small open economy, Namibia interacts significantly with the rest of the world through
trade and capital flows. Using the open economy framework, answer the following questions:
1. National Income Identity for an Open Economy: Namibia's national income identity can
be expressed as Y = C + I + G + NX, where Y is the GDP, C is consumption, I is
investment, G is government spending, and NX is net exports. Given the following data for
Namibia in 2023:
o GDP (Y) = N$ 500 billion
o Consumption (C) = N$ 300 billion
= o Government spending (G) N$ 100 billion
o Net Exports (NX) = N$ - 20 billion
a) Calculate Namibia's investment (I) for 2023.
(5 marks)
b) Namibia has been running a trade deficit (NX < 0). Discuss how a trade deficit is
related to net capital outflow (NCO) and explain what the sign of net exports (-20
billion) implies for Namibia's net capital outflow.
(5 marks)
c) Suppose Namibia's real exchange rate depreciates by 10% due to market forces.
Explain how this depreciation might affect Namibia's trade balance (NX) in the short
and long run. What would be the likely impact on exports, imports, and net exports?
(5 marks)
d) The Namibian government plans to increase its spending by N$ 50 billion without
increasing taxes. Use the open economy model to predict how this fiscal policy could
affect Namibia's trade deficit and exchange rate. Provide a step-by-step explanation.
(5 marks)
e) As an economic advisor to the Namibian government, recommend two policies to
reduce the trade deficit. Justify how each policy would influence net exports, exchange
rates, and overall economic stability.
(5 marks)
3
|
|
4 Page 4 |
▲back to top |
QUESTION 4 [25 marks]
Namibia is working to boost its economic growth through policies that affect capital
accumulation and population growth. Using the Solow Growth Model, answer the following
questions and provide well-labelled diagrams to support your explanations:
a) Explain how the Solow growth model determines the steady-state levels of capital per
worker and output per worker. Draw a figure showing the steady-state capital per worker
and output per worker, labelling the savings curve and depreciation line and indicating the
steady-state level of capital.
(10 marks)
b) Analyse the impact of an increase in the savings rate on the steady-state level of capital per
worker and output per worker. Draw a new figure showing how the increase in the savings
rate shifts the savings curve and indicates the new steady state.
(5 marks)
c) Discuss the concept of the Golden Rule level of capital in the Solow model. Explain the
conditions that must be met to achieve the Golden Rule level of capital and draw a diagram
showing how the Golden Rule level of capital compares to the current steady state.
(5 marks)
d) Describe the effect of an increase in the population growth rate on the steady-state level of
capital per worker. Draw a figure that illustrates how the increase in population growth
shifts the steady state, labelling the new steady-state levels of capital per worker and output
per worker.
(5 marks)
QUESTION 5 [25 marks]
Economic fluctuations, often referred to as business cycles, are a key feature of macroeconomic
analysis. Using the Aggregate Demand (AD) and Aggregate Supply (AS) model, answer the
following questions and provide well-labelled diagrams where necessary.
a) Explain how short-run economic fluctuations are measured using GDP and unemployment
data. Provide a diagram to illustrate the business cycle, showing expansions and recessions.
(5 marks)
b) Discuss how the Aggregate Demand curve is derived and explain why it slopes downward.
Illustrate how a decrease in consumer confidence might shift the Aggregate Demand curve
with a diagram.
(5 marks)
c) Analyse the difference between the short-run and long-run Aggregate Supply curves.
Explain how price flexibility, in the long run, affects the economy's output and
employment. Provide a diagram to support your answer.
(5 marks)
d) Suppose Namibia experiences a negative supply shock due to a disruption in oil supply.
Using the AD-AS model, explain how this shock would affect the economy in the short
run. Provide a diagram to show how the Aggregate Supply curve shifts and the resulting
changes in output and prices.
(5 marks)
e) Discuss the role of stabilisation policies in managing short-run economic fluctuations.
Explain how monetary or fiscal policy can mitigate the effects of a recession. Use a diagram
to illustrate how these policies can shift the Aggregate Demand curve.
(5 marks)
4