SFE611S - STATISTICS FOR ECONOMISTS - 2ND OPP - JULY 2022


SFE611S - STATISTICS FOR ECONOMISTS - 2ND OPP - JULY 2022


1 Page 1

▲back to top


:p i
FACULTY
NAMIBIA UNIVERSITY
OF SCIENCE AND TECHNOLOGY
OF HEALTH, APPLIED SCIENCES AND NATURAL
DEPARTMENT OF MATHEMATICS AND STATISTICS
RESOURCES
QUALIFICATION: BACHELOR OF ECONOMICS
QUALIFICATION CODE: 07BECO
COURSE CODE: SFE611S
LEVEL: 5
COURSE NAME: STATISTICS FOR ECONOMIST
SESSION: JULY 2022
DURATION: 3 Hrs
PAPER: THEORY
MARKS: 100
SECOND OPPORTUNITY/SUPPLEMENTARY EXAMINATION QUESTION PAPER
EXAMINER
Mr J. Amunyela
MODERATOR:
Mr A.Roux
INSTRUCTIONS
1. Answer ALL the questions in the booklet provided.
2. Show clearly all the steps used in the calculations (SECTION B).
3. All written work must be done in blue or black ink and sketches must
be done in pencil.
ATTACHMENT: T-Table, Z-Tables, Chi-square
PERMISSIBLE MATERIALS
1. Non-programmable calculator without a cover.
THIS QUESTION PAPER CONSISTS OF 6 PAGES (Including this front page)

2 Page 2

▲back to top


SECTION A
QUESTION 1 [22 MARKS]
(Write down the question number and the letter corresponding to your best option)
1.1 A random sample of size n = 11 was selected from a population and the data are as
follows: 29,30, 45, 23, 51, 82 ,69, 12 ,71 ,65, 39. Use this dataset to answer questions
1.1.1 and 1.1.3
1.1.1 The point estimate for the mean is
[2]
50.5
12
46.91
45.47
47.45
1.1.2 The standard deviation of the sample mean is equal to
[2]
50.3
6.7
71.6
22.6
.
6.8
1.1.3. What is the range of the dataset above
[2]
70
59
40
11
0
1.2 Which of the following hypothesis test can be used in statistics when
n= 34ando = 29?
[2]
A.
T-test
B.
Z-test
C.
one-way ANOVA
D.
Kruskal-Wallis test
E.
chi-square test

3 Page 3

▲back to top


1.3 A research firm conducted a survey to determine the mean amount of money steady
smokers spend on cigarettes during a week. They found the distribution of amounts
spent per week followed a normal distribution with a standard deviation of NS5. A
random sample of 49 steady smokers revealed that x = N$20 . Determine the 95%
confidence interval for pu:
[3]
A
(18.60; 25;40)
B
(19.37; 20.63)
C.
(20; 1.40)
D
(19.83; 20.17)
E
(18.6; 21.40)
1.4 If A and B are any two arbitrary events and P(A N B) = P(A) x P(B), then the
following is true about events A and B
[2]
A.
Event A and B are collectively exhaustive
B.
Event A and B are mutual exclusive
C.
Events A and B are independent
D.
Events A and B are dependent
E.
None
1.5
If a variable X represent the annual income per person in an organization, then X is
a
random variable
[2]
continuous
descriptive
discrete
normal
none
1.6
A new vaccine introduced for foot & mouth disease will either cure it or not, this is a
possible application of;
[2]
Poisson distribution
Normal distribution
Binomial distribution
Z-distribution
none
1.7 In a Poisson distribution the mean (jw) for a random variable x is the same as;
[2]
Variance (a7)
Standard deviation (c)
Number of success
Number of occurrences

4 Page 4

▲back to top


E.
none
1.8 What is the probability of getting one success in five observations if the probability
of a success is 0.1
[3]
A.
0.066
B.
0.328
Cc.
0.933
D.
0.234
E.
none
SECTION B
(Attempt all questions and show all your working)
QUESTION 2 [46 MARKS]
2.1 The annual rainfall figures (in mm) for the past 20 years for Tsumeb are given below:
142 | 133 | 138 | 127 | 148 | 154 | 161 | 155 | 131 | 176
152 | 136 | 129 | 121 | 128 | 162 | 145 | 133 | 137 | 132
21,1
24.2
2.1.3
Determine the range for the rainfall data.
[2]
Group the data into a grouped frequency distribution with a lowest class lower limit
of 120 mm and a class width of 10 mm. (NB include class, frequency, and relative
frequency)
[7]
What percentage of the rain fall was received between 160 mm to 170 mm?
[2]
2.2
Cabbage is among the highest nitrates containing vegetarian food available in terms
of quantity. The following table present the distribution of nitrates in grams that was
measured from 29 cabbages.
Nitrates contents
(in grams)
Frequency
0-<9
9-<18
18-<27
27-<36
36-<45
2.2. Estimate the mean nitrate for the cabbages
[4]
4

5 Page 5

▲back to top


2.2.2 Estimate the median nitrate for the cabbages
[4]
2.2.3 Estimate the mode nitrate for the cabbages
[4]
2.2.4 Estimate the variance and the standard deviation of nitrate for the cabbages
[6]
2.3 Suppose you and a friend have contributed equally to a portfolio of $10 000 invested
in a risky venture. The income X that will be earned on this portfolio over the next
year has the following probability distribution.
X
$500| $100 | $2000
P(X)
0.5
0.3
0.2
2.3.1 Determine the expected value and variance of the income earned on this portfolio.
[5]
2.3.2 Determine the expected value of your share (one half) of the income.
[2]
2.4 It is known that 80% of all business startups in the IT industry report that they
generate a profit in their first year. If a sample of 10 new IT business startups is
selected, find the probability that:
2.4.1 Exactly seven will generate a profit in their first year
[2]
2.4.2 At least nine will generate a profit in their first year
2.4.3 P77 <X <8)
[4]
- [4]
Question 3 (32 marks)
3.1 You sample 34 oranges from your farm’s harvest of over 500 000 oranges. The mean
weight of the sample is 110 grams. The population standard deviation and mean are
30 grams and 115 grams respectively. What is the probability that the mean weight of
all 500 000 oranges is less than 110 grams?
[3]
3.2
During July 2018, tomatoes yield figures (in tons) were recorded over 10 farms around
Tsumeb.
Farm
A
B CG
D
E
F
G
H
|
J
Tomato yield | 35 | 21 | 33 | 24 | 30 | 36 |27 |39 | 25 | 26
(ton)
B.delis Construct a 95% confidence interval to estimate the true mean tomato yield in

6 Page 6

▲back to top


Tsumeb.
[8]
3.2.2 Is this a T-statistic or a Z statistic, and why?
[2]
3.2.3 At the 5% level of significance test the hypothesis that the mean tomato yield around
Tsumeb is below 30 ton.
[6]
3.3 The variance protein content (in mg) of a random sample of 10 bags of beans was
found to be 0.67 mg.
3.3.1 Estimate the variance for protein content of the entire population of beans with a
95% degree of confidence.
[7]
3.3.2 Can we conclude that the population protein variance for the beans is less than 1.05
mg? usea =0.05
[6]
END OF EXAMINATION QUESTION PAPER

7 Page 7

▲back to top


TABLE of CRITICAL VALUES for STUDENT'S ¢ DISTRIBUTIONS
0.25
us
0.765
0.741
7
0.711
0.706
0.
0.700
Column headings denote probabilities (2) above tabulated values.
0.10
0.025
7.916 12:
-821 63.
0.0025 | 0.001
2.605
2.333
2.191
2.104
2.046
7
2.776
2.571 2.
2.447
2.365 2.5
2.306
4
3.747
3.
2.998
10.214
1.948 2.228
764
1
718
1
2.1
4
0.0005
12)
0
6.869
5.959
5.
5.041

8 Page 8

▲back to top


Cumulative probabilities for POSITIVE z-values are shown below.
00
:
.06
9983
S997
9994

9 Page 9

▲back to top


Z - Table
The table shows cumulative probabilities for the standard normal curve.
Cumulative probabilities for NEGATIVE z-values are shown first. SCROLL
DOWN to the 2™ page for POSITIVE z
z
00
1
02
.03
04
.05
.06
07
08
.09
-3.4
0003 | .0003
4903
0003
0003 ; .0003
0003 | .0003
0003 {| .0002
-3.3
0005
.0005
0005
0004
0004
.0004
.0004
0004
0004
.0003
-3.2
0007
0007
0006
0006
0005
.0006
0008
.0005
0005 | .0005
31
0010
.0003
0099
0009
.0008
.0008
0008 | .0008
0007 | .0007
-3.0
0013
0013
013
0012
0012
0011
0011
0011
.0010
0010
29
0019 | 0018
018 | 0017 | 0016 | O016 | 0015 | 0015 | 0014 | 0014
-2.8
0026 | .0025 | 0024 | 0023 | 0023 | 0022 | 0021
0021
0020 | .0019
-2.7
0035 | .0034
0033 ; 0032 | .0031
0030 | 0029 | 0028 | 0027 | .0026
-2.6
0047
0045
0044
0043
0041
.0040
.0039
.0038
.0037
.0036
-2.5
-0062
.0060
0059
0057
0055 | 0054
.0052
0051
0049
0048
-2.4
0082 | .0080
0078 | 0075 | 0073 | .0O71
0069 | 0068 | 0066 | .0064
-2.3
0107 {| .0104
0102 |} 0099 ; .0096 | 0094 | .0091
0089 | .0087 | .0084
-2.2
0139 | 0136
0132
0129
0125}
0122
O19 | O16 | 113 | 0110
-2.1
0179 | 0174
0170 | 0166 | 0162 | 0158 | O14 | 0150 | 0146 | 0143
-2.0
0228
0222
0217 | 0212
0207
0202
0197 | .0192
0188 | 0183
193
0287
0281
274
268
0262
0256
.0250
0244
0239 | .0233
-1.8
0359 | .0351
0344
0336
0329 | .0322
0314
.0307
.0301
0254
AT
0446
0436
0427 | 0418 | 0409 | 0401
0392 | 0384 | .0375 | .0367
-1.6
0548 | 0537 } 0526 | 0516 | .0505 | 0495 | 0485 | 0475 | 0465 | 0455
-1.5
0668 | .0665
0643 {| 0630 | 0618 | 0606 ; 0594 | .0582
0571
0559
-1.4
0808 | 0793
O778 | 0764 | 0749 | 0735 | 0721
0708 | 0694 | .0681
-1.3
0968
0951
.0934
0918
0901
0885 | .0869 | .0853
0838 | 0823
1.2
1181
134
1442
1093
1075
1056 | .1038
1020
- 1003
0985
AA
1357
1335
A344
A292 | 1271
1251
1230 | 1210 | .1190 | .1170
-1.0
1587
1562
1639
1615
1492
1469
1446
1423
1401
1379
-0.9
1841
1814
1788
1762
1738
711
1685
. 1660
1635
1611
-0.8
2119 | 2090
2081
2933
2005 | 1977
W849 7 1922 | .1894
1867
0.7
.2420
2389 | 2358
2327 | 2296 | 2266 | 2236 | 2206 | 2177 | 2148
-0.6
2743
2709
2676
2643
2614
2578 | 2848
2614
2483
245)
-0.5
3085
3050
3015
2981
2946
2912 | 2877
.2843
2610 | 2776
0.4
3446 | 3409 | 3372 | 3336 | 3300 | 3264 | 3228 | 3192 | 3156 | 3121
-0.3
3821
3783 | 3745 | 3707
3669 | 3632 | 3694 | 3657 | 3520 | 3483
-0.2
4207 | 4168
4429
4099
4052 | 4013 | 3974 | 3936 | 3897 | 3859
-0.1
4602
A5G2
4522
4483
A443
4404
4364
4325
4286
4247
0.0
5000 | .4960
4920
4880
AB40
4801
4761
AT214
A651
4641

10 Page 10

▲back to top


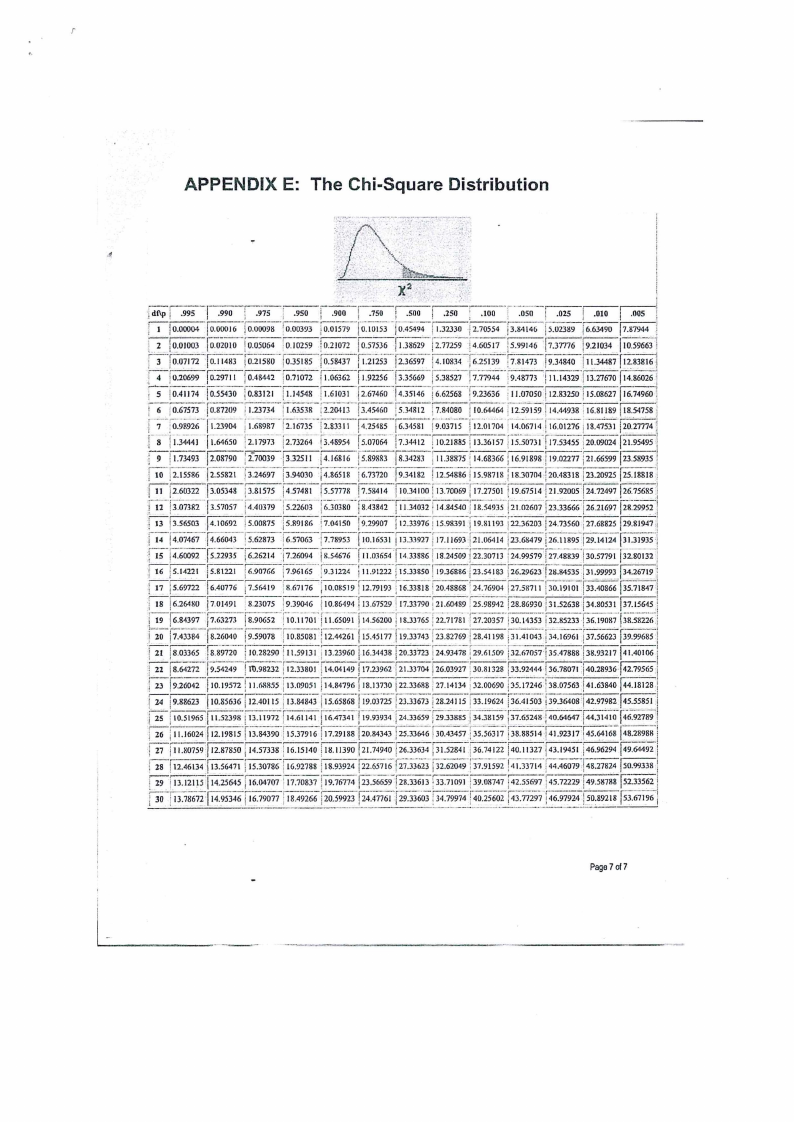
APPENDIX E: The Chi-Square Distribution
,r af1p
| 995
| 0.00004
[990
| 0.00016
/i 975
:0.00098
i -950
| 0.00393
i; 900
(0.01579
| £750} 500 | «250 ' «100
050 | 025 | 010
0.10153 (0.45494 |1.32330 |2.70554 [3.84146 |5.02389 |6.63490
605
7.87944
r"2. af [0.01003 [o.oz010 0.05064 0.10259 0.21072 0.57536 {1.38629 j 2.77259 14.60517 :5.99146 [7.37776 (9.21034 |10.59663 |:
3 [oon [0.11483
|0.20699 fo29711
| 0.41174 | 0.55430
0.67573 {0.87209
“0. 9926 s 1.23904
\\(1.3444) ‘}1.64650
(0.21580
‘0.48442
(0.83121
| 1.23734
“1.68987
2.17973
0.35185
0.71072
‘114sag
| 1.63538
2.16735
[2.73264
[0.58437
(1.06362
1.61031
[1.21253 |2.365
[1.92256 [3.35669
| 2.67460 [4.35146
‘4.10834 6.25139
| 5.38527 |7.77944
| 6.62568 | 9,23636
‘7.81473 (9.34840 | 11.34487 | 12.83816 {{{
9.48773
*11.07050
{1.14329
| 12.83250
| 13.27670
} 15.08627
| 14.86026
16.74960
|{i:
i
+ 10.64464 (2.2a 0413 |3.45460nnn p5.a34c81e2s + 7.t 840n 80 eo
li p1e2n.n59an1ne59 |Ro1s4e.ni4e4r9o3a8te | 1f6.a8t11a89 |pet1e8.54S7E58
2.83311 [4.25485 } 6.34581 {9.03715 $12.01704 | 14.06714 | 16.01276 | 18.47531 | 20.27774
1 3.48954 [5.07064 {7.34412 :10.21885 | 1i 13.36157 | 1 30731 1 17.53455 | 20.09024 [21.9549
{2.08790 123 70039
(2.15586 [2.55821
{2.60322 |3.05348
{3.57087 4 40379
3.32511 i 16816 iS: 89883 8.34283 |_ 11,38875 | 14.68366| ; 16.91898 119. 02277 j2 66599 |23.58935 |
(3.94030, |4.86518 |6.73720 _[psaa [iaseeds | 1s98718 | 181:8.30704 |
4.57481 | 5.57778 i7seaa 1 10.34100 |' 13.70069 | {7.27501 | |19.67514 | 21.92005 24.72497 Eosal |
|5.22603| 2829952 | le5..30380 “fs 43842 i 11.34032: (14.8844540 1i| 8. 15493: 1. 02607 123. 33666 | 26.21697
1433 a 56503 + 10692 |5.00875 | 5.89186 ' 7.04150 !9.29907 | 12.33976 !15.98391 /19.81193 “| 2236203 | 24.73560 127.6825 29.81947
i 14 «(40707467
“5.62873 | 6.57063 | 7.78953 {0.16531 {13.33927 1711693 |21.006644114 | 23.68479 |26.11895 [29. 14124 [31.31935
| 4.60092
| 6.26214 i 7.26094 18. 54676 f 11.03654 i 14.33886| 18.24509 (22. 30713 |24.99579 (27, AB839 |'30. S7791 j32. 80132,
1514221 Ciel "6.90766 i7.96165 “931224 11,91222|j 1s. 33850| 19.36886; | 23.54183| | 26.29623 128. 84535 3| 99993 [3426719 |
| 5.69722 6.40776 )7.S6419 8.67176 ,10.08519 | | 12.79193 "1633818 | 20.48868 | 24.76904 }27.58711 £30.19101 (35.4086 [35.71847
19
| (2200
{6.26480
{6.84397
| 7.43384
sapo7ns.n6e0e31a24l79313
8.23075: 9.39046 "10.86494 | 13.67529 | 17.3790 | 21.60489| 25.98942 | 28.86930 | 31.52638 [34 80531 |37.15645 i
[anes |“/10.11701 /11.65091 [14scan0 vassies | 2.1781 |"7.20357| 0.14353 |32.85233| 36.19087 (38. 58226 |
9 28. 41198 a 41043 /34, 1696 7.56666223 [399.96585 |
Pa21 8.03365 ha 1| 10.28290| ‘it -59131 | 13.23960 fie 34438 20.33723 |124, 93478 29.61509 |}32, 67057 |135. 47888 (3a 93217 }41.400110066 |
2
8.64272 [osazas (To.98232 | 1 12,3380! | 14,04149 {17.23962 | 21.33704 (3603027 - 30.81328 /33.92444 (36.78071 /40.28936 142.79565
| 23 |9.26042 } 10.19572 | 1.68855 | 13.09051 | 14.84796 | 18.13730 | 22.3688 27.14134 |32,00690 | 35.17246' 38.07563 |41.63840 [44.18128
| 24 {9.88623 fio 85636 4; 12. 401 5; | 13. 84843| | 15.65868 H19.03725 |123. 33673; 28.24115 : : 33.19624| 136. 41503 139. 36408 [4297987982. |45. 55851
|| 2255 | 10.51965 | 11.5298 | | 13.1197 14.61 141 \\ 16.47341 1i9. 93934 (24, 33659 9. 33885 | 4.38159. {31 65248| 40.64647 |44.31410 [46.92789.
26 j1l..1610602244 [12.1 1981| 5 13,8439 }¥55..37916 || 7. 29188 [ao8e4343 | (25. 133646 | 30. 43457 | 135, 56317, 138.88514 |(41.92317 [14455,64168g | 48. 28988
127 111.8079 fraa7es0_ , 14.57338 +16.15140 18.1390 |21.74940 } 26.33634 ,31.52841 | 36.74122 F40.11327 1| 43.19451 } 46.96294 |49.64492
28 {12.46134 | 13.56471 | 15.30786 | 16.92788 | 18.93924 | 22.65716 |27.3623 |32.62049 |37.91592 |41.33|447.4160479 | 48.27824 |50.99338
——
£29 113.12115
14.25645 | 166.04707
|"17.70837 | 19.1674 |23,56659| 28.33613{33.71091 |39.08747 {42.55697 |45.72229 | 49.58788 [52.33562
130 |13.78672' [ra9s34 | (16.7907| | 18.49266;20. 59923 (24, 47761 [299.33603 . 34, 194 140. 25602 (4(43.77297 |146. 97924 |}50.89218 [53. 67196 ,
Page 7 of7