


 |
GDG621S - GEODEMOGRAPHICS - 1ST OPP - JUNE 2023 |
|
|
1 Page 1 |
▲back to top |
nAmlBIA UnlVERSITY
OF SCIEn CE Ano TECHn OLOGY
FACULTY OF ENGINEERING AND THE BUILT ENVIRONMENT
DEPARTMENT OF LAND AND SPATIAL SCIENCES
QUALIFICATION: BACHELOR OF GEOINFORMATION TECHNOLOGY
QUALIFICATION CODE: 07BGEI
LEVEL: 7
COURSECODE: GDG6215
COURSE NAME: GEODEMOGRAPHICS
SESSION:
JUNE 2023
PAPER:
i5t OPPORTUNITY
DURATION:
3 HOURS
MARKS:
100
EXAMINER(S}
FIRST OPPORTUNITY EXAMINATION QUESTION PAPER
Mr Miguel Vallejo Orti
MODERATOR:
Ms Celeste Espach
INSTRUCTIONS
1. Answer ALL the questions.
2. Write clearly and neatly.
3. Number the answers clearly.
PERMISSIBLE MATERIALS
Calculator, ruler, pencil and eraser.
THIS QUESTION PAPER CONSISTS OF 6 PAGES (Including this front page)
|
|
2 Page 2 |
▲back to top |
Geodemographics
GDG621S
Question 1
Please explain the meaning of the following terms in the field of Geodemographics:
1.1
Geodemography
(2)
1.2
Reverse ecological fallacy
(3)
1.3 Clustering
(3)
1.4
Geocoding
(2)
1.5
Moran Index
(3)
[13]
Question 2
2.1 Define the concept of a neighbourhood in the context of geodemographics and
mention the three geographical scales which are typically used for
geodemographic analysis.
(3)
2.2 List the 10 inner characteristics defined by Glaster and provide one example of
each.
(10)
[13]
Question 3
3.1 What are geodemographic classifications?
(4)
3.2 What are the suggested steps in geodemographic classification?
(7)
[11]
First Opportunity Question Paper
Page 2 of 6
June 2023
|
|
3 Page 3 |
▲back to top |
Geodemographics
Question 4
4.1 What is the Huff Model?
GDG621S
(3)
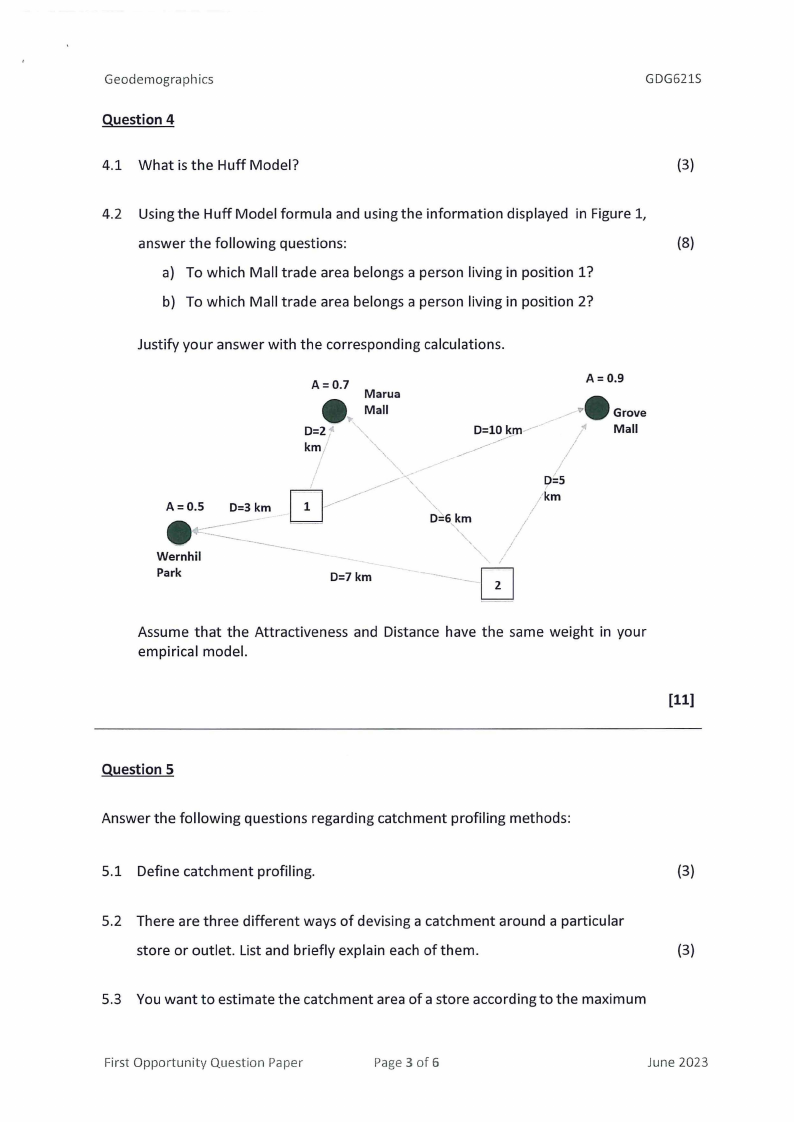
4.2 Using the Huff Model formula and using the information displayed in Figure 1,
answer the following questions:
(8)
a) To which Mall trade area belongs a person living in position 1?
b) To which Mall trade area belongs a person living in position 2?
Justify your answer with the corresponding calculations.
e. A=0.7
Marua
Mall
D=2t
km;
A=0.9
,----..,.-Grove
D=lO km.,..,.--- /
Mall
/
Park
D=7 km
Assume that the Attractiveness and Distance have the same weight in your
empirical model.
[11]
Question 5
Answer the following questions regarding catchment profiling methods:
5.1 Define catchment profiling.
(3)
5.2 There are three different ways of devising a catchment around a particular
store or outlet. List and briefly explain each of them.
(3)
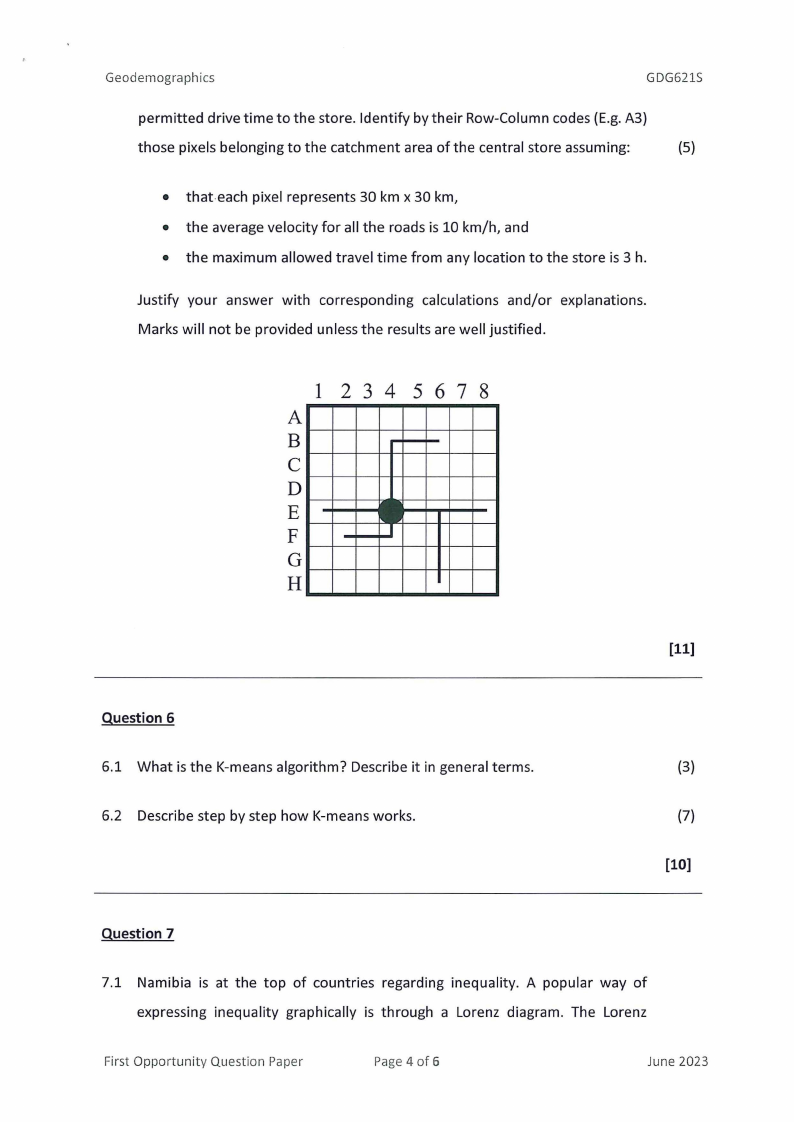
5.3 You want to estimate the catchment area of a store according to the maximum
First Opportunity Question Paper
Page 3 of 6
June 2023
|
|
4 Page 4 |
▲back to top |
Geodemographics
GDG621S
permitted drive time to the store. Identify by their Row-Column codes (E.g. A3)
those pixels belonging to the catchment area of the central store assuming:
(5)
• that-each pixel represents 30 km x 30 km,
• the average velocity for all the roads is 10 km/h, and
• the maximum allowed travel time from any location to the store is 3 h.
Justify your answer with corresponding calculations and/or explanations.
Marks will not be provided unless the results are well justified.
1 234
A
B
C
D
E
F
G
H
5678
[11]
Question 6
6.1 What is the K-means algorithm? Describe it in general terms.
6.2 Describe step by step how K-means works.
(3)
(7)
[10]
Question 7
7.1 Namibia is at the top of countries regarding inequality. A popular way of
expressing inequality graphically is through a Lorenz diagram. The Lorenz
First Opportunity Question Paper
Page 4 of 6
June 2023
|
|
5 Page 5 |
▲back to top |
Geodemogra ph ics
GDG621S
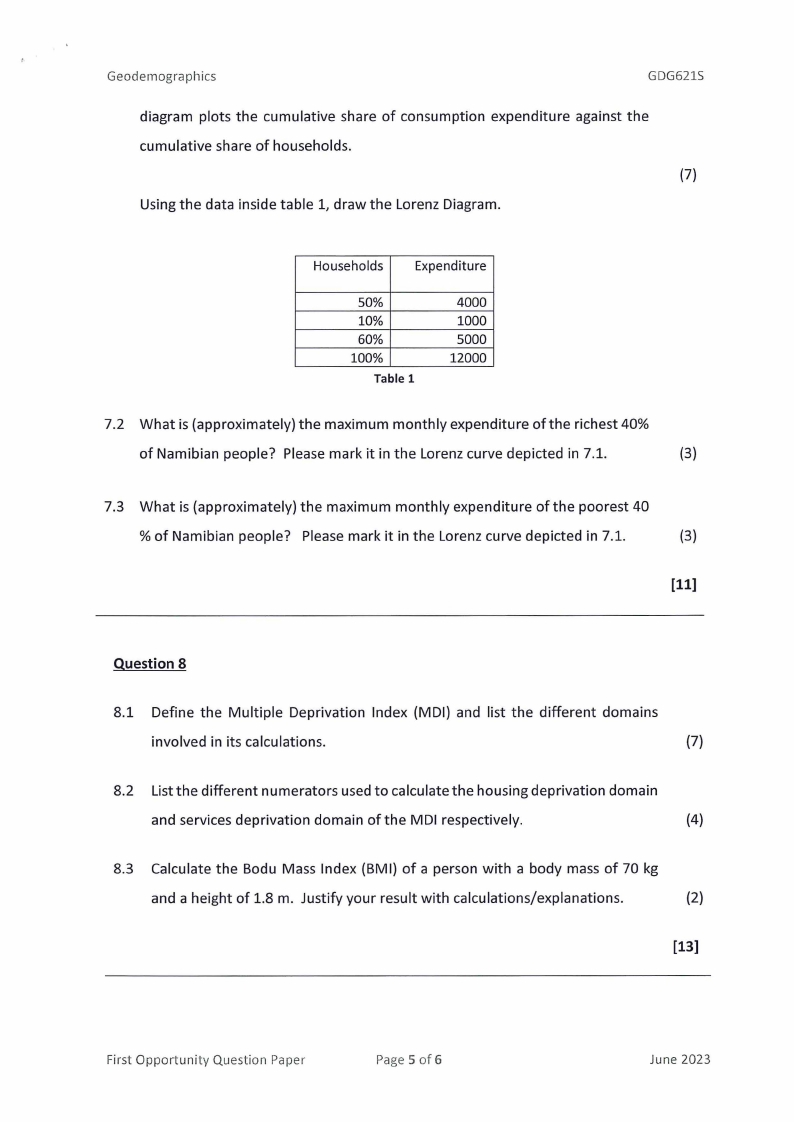
diagram plots the cumulative share of consumption expenditure against the
cumulative share of households.
(7)
Using the data inside table 1, draw the Lorenz Diagram.
Households Expenditure
50%
10%
60%
100%
Table 1
4000
1000
5000
12000
7.2 What is (approximately) the maximum monthly expenditure of the richest 40%
of Namibian people? Please mark it in the Lorenz curve depicted in 7.1.
(3)
7.3 What is (approximately) the maximum monthly expenditure ofthe poorest 40
% of Namibian people? Please mark it in the Lorenz curve depicted in 7.1.
(3)
[11]
Question 8
8.1 Define the Multiple Deprivation Index (MDI) and list the different domains
involved in its calculations.
(7)
8.2 List the different numerators used to calculate the housing deprivation domain
and services deprivation domain of the MDI respectively.
(4)
8.3 Calculate the Bodu Mass Index (BMI) of a person with a body mass of 70 kg
and a height of 1.8 m. Justify your result with calculations/explanations.
(2)
First Opportunity Question Paper
Page 5 of 6
June 2023
|
|
6 Page 6 |
▲back to top |
Geodemographics
GDG621S
Question 9
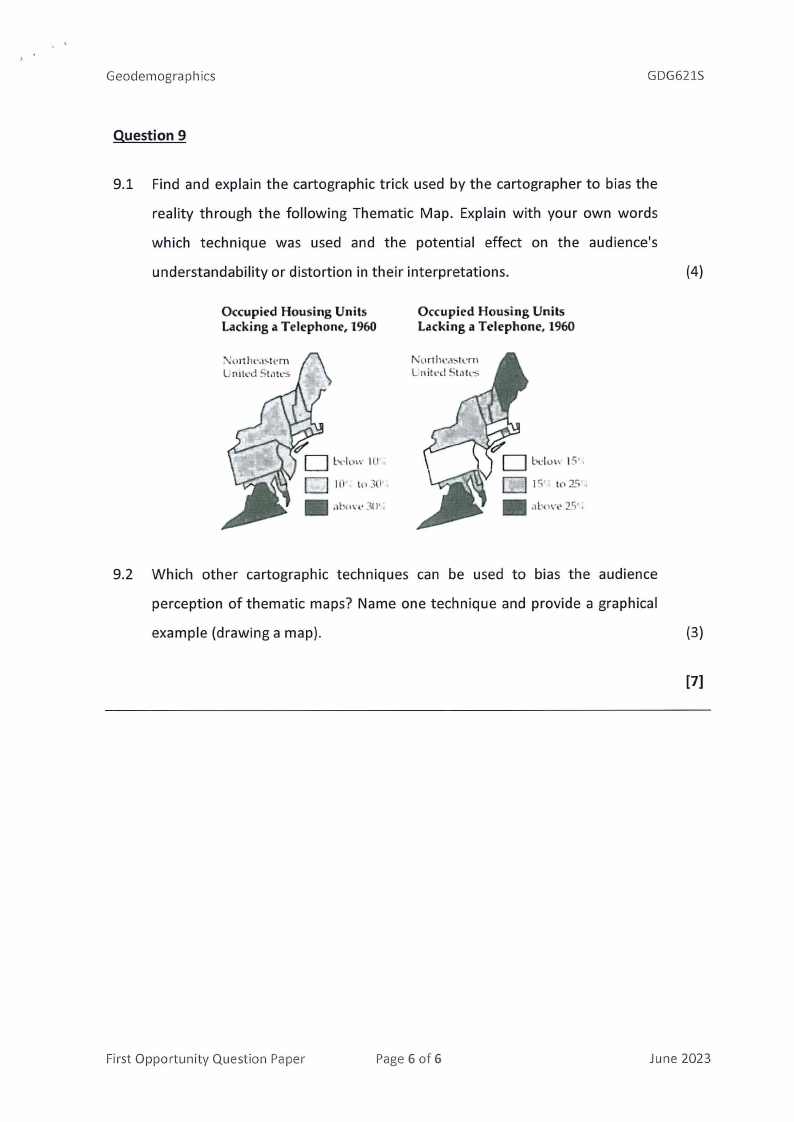
9.1 Find and explain the cartographic trick used by the cartographer to bias the
reality through the following Thematic Map. Explain with your own words
which technique was used and the potential effect on the audience's
understandability or distortion in their interpretations.
(4)
Occupied Housing Units
lacking a Telephone, 1960
\\iort l11•.-1!-Cl•rn
UmL,·d S1,1tes
Occupied Housing Units
lacking a Telephone, 1960
North~.~stern
Lnitl'd Sl~k-s
bdo\\\\· 15',
JS'; t,,25',,
•
.1b1,)\\'e ?r,•;
9.2 Which other cartographic techniques can be used to bias the audience
perception of thematic maps? Name one technique and provide a graphical
example (drawing a map).
(3)
[7]
First Opportunity Question Paper
Page 6 of 6
June 2023