


 |
GDG621S - GEODEMOGRAPHICS - 2ND OPP - JULY 2023 |
|
|
1 Page 1 |
▲back to top |
nAmlBIA unlVERSITY
OF SCIEnCE Ano TECHn OLOGY
FACULTYOF ENGINEERINGAND THE BUILTENVIRONMENT
DEPARTMENTOF LANDAND SPATIALSCIENCES
QUALIFICATION: BACHELOR OF GEOINFORMATION TECHNOLOGY
QUALIFICATION CODE: 07BGEI
COURSE CODE: GDG621S
LEVEL: 7
COURSE NAME: GEODEMOGRAPHICS
SESSION:
JULY 2023
PAPER:
2nd OPPORTUNITY
DURATION:
3 HOURS
MARKS:
100
SUPPLEMENTARY/SECOND OPPORTUNITY EXAMINATION QUESTION PAPER
EXAMINER(S)
Mr Miguel Vallejo Orti
MODERATOR:
Ms Celeste Espach
INSTRUCTIONS
1. Answer ALL the questions.
2. Write clearly and neatly.
3. Number the answers clearly.
PERMISSIBLEMATERIALS
Calculator, ruler, pencil and eraser.
THIS QUESTION PAPER CONSISTS OF 5 PAGES (Including this front page)
|
|
2 Page 2 |
▲back to top |
Geodemographics
GDG621S
Question 1
Please explain the meaning of the following terms/concepts in the field of
Geodemographics:
1.1
Humanitarian Open Street Map team
(3)
1.2
Deprivation
(2)
1.3
Human Development Index
(3)
1.4
Snowball sampling
(3)
1.5
Proportional symbol maps
(3)
[13]
Question 2
2.1 Explain the difference between the Human Development Index and the
Multiple Deprivation Index.
(3)
2.2 How many domains are included in the MDI for Namibia? Please list them.
(7)
2.3 What is the MDI result for domain housing if the number of people living in a
shack is 78 and the number of people living in formal houses is 97?
(2)
[12]
Question 3
3.1 What is the difference between thematic maps and reference maps?
(3)
3.2 List and briefly describe the different types of thematic maps.
(8)
Second Opportunity Question Paper
Page 2 of 5
July 2023
|
|
3 Page 3 |
▲back to top |
Geodemographics
3.3 What are the three primary purposes that thematic maps serve?
GDG621S
(6}
[17]
Question 4
Create your own schema for a geodemographic classification applied to the Risk of
COVID-19 in Windhoek. Please remember to clearly outline the 9 suggested steps
for this type of analysis.
(9}
[9]
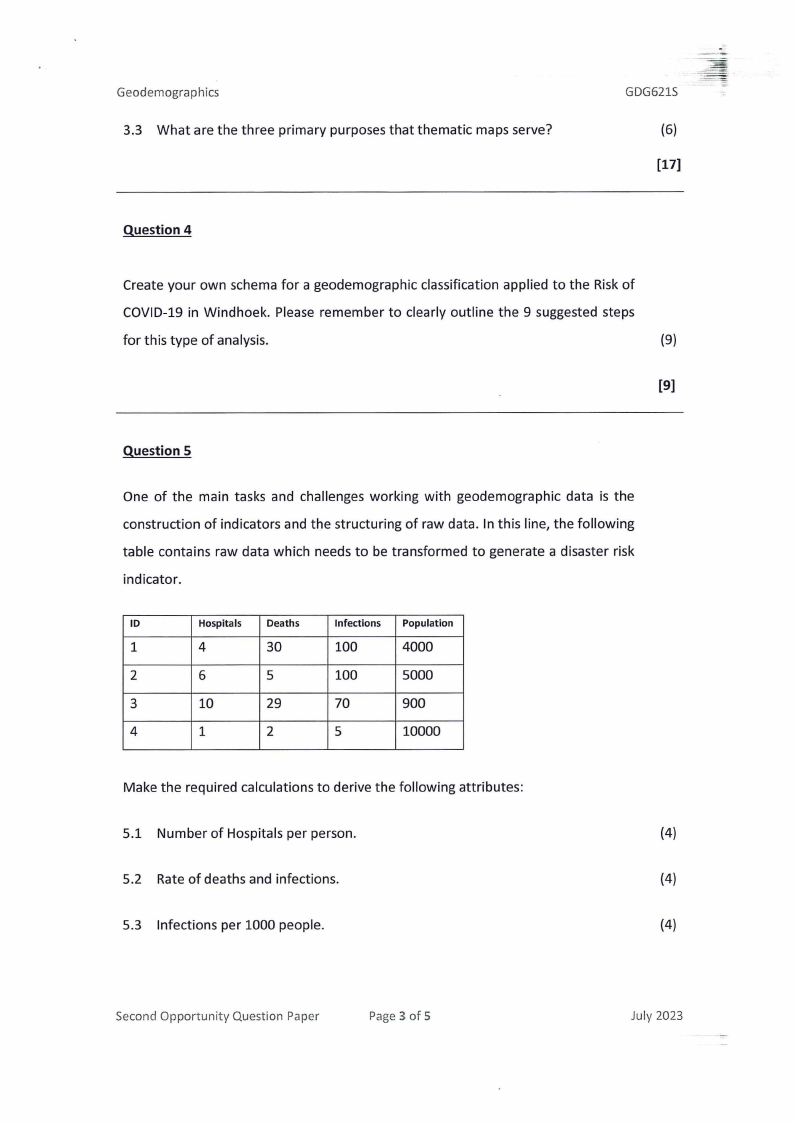
Question 5
One of the main tasks and challenges working with geodemographic data is the
construction of indicators and the structuring of raw data. In this line, the following
table contains raw data which needs to be transformed to generate a disaster risk
indicator.
ID
Hospitals
Deaths
Infections Population
1
4
30
100
4000
2
6
5
100
5000
3
10
29
70
900
4
1
2
5
10000
Make the required calculations to derive the following attributes:
5.1 Number of Hospitals per person.
(4}
5.2 Rate of deaths and infections.
(4}
5.3 Infections per 1000 people.
(4}
Second Opportunity Question Paper
Page 3 of 5
July 2023
|
|
4 Page 4 |
▲back to top |
Geodemographics
GDG621S
5.4 Standardised values for each variable between O and 1 when O has a negative
impact on the presence of risk and 1 has a positive impact. 1 means a risky
situation while O is non-risky.
(4)
5.5 Generate a combined indicator of disaster risk, concatenating the results of
point 4.
(4)
[20]
Question 6
6.1 What is a sample?
(2)
6.2 Mention and briefly describe two probabilistic and two non-probabilistic
sampling methods.
(4)
6.3 What is the probability of being selected in a random sampling of 5 samples
applied to a population of 24 elements?
(2)
[11]
Question 7
7.1 What is spatial autocorrelation? Please explain it in your own words providing
one example present in nature or relative to humans.
(3)
7.2 Which index is used to quantify spatial autocorrelation? How would you
interpret a resulting value of 0.9?
(2)
7.3. Why is spatial autocorrelation important in geodemographics?
(2)
7.4 Develop and calculate the result of the following summary (SUM) as part of
the calculations required to derive spatial autocorrelation. Use the dataset Yi (4)
Second Opportunity Question Paper
Page4of5
July 2023
|
|
5 Page 5 |
▲back to top |
Geodemographics
as hypothetical attributes for the input points.
Yi = {4,5,6,2,1}
n
SUM= _L(Yi -y) 2
k=O
GDG621S
[11)
Question 8
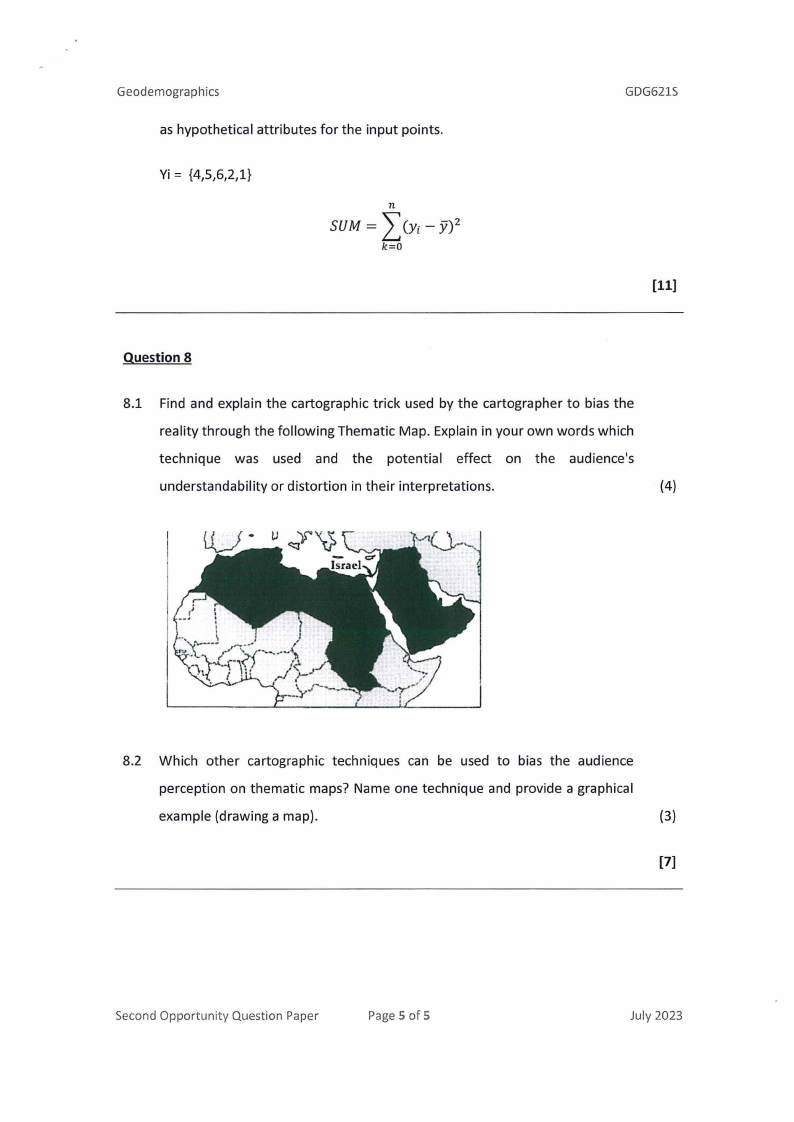
8.1 Find and explain the cartographic trick used by the cartographer to bias the
reality through the following Thematic Map. Explain in your own words which
technique was used and the potential effect on the audience's
understandability or distortion in their interpretations.
(4)
8.2 Which other cartographic techniques can be used to bias the audience
perception on thematic maps? Name one technique and provide a graphical
example (drawing a map).
(3)
[7)
Second Opportunity Question Paper
Page 5 of 5
July 2023