


 |
IAS501S - INTRODUCTION TO APPLIED STATISTICS - 2ND OPP - JULY 2022 |
|
|
1 Page 1 |
▲back to top |
NAMIBIA UNIVERSITY
OF SCIENCE AND TECHNOLOGY
FACULTY OF HEALTH, APPLIED SCIENCES AND NATURAL RESOURCES
DEPARTMENT OF MATHEMATICS AND STATISTICS
QUALIFICATION: BACHELOR OF SCIENCE
QUALIFICATION CODE: 07BAMS
LEVEL: 5
COURSE CODE: IAS501S
SCTOAUTRISSETICSNAME: INTRODUCTION TO APPLIED
SESSION: JULY 2022
DURATION: 3 HOURS
PAPER: THEORY
MARKS: 100
SUPPLEMENTARY / SECOND OPPORTUNITY EXAMINATION QUESTION PAPER
EXAMINER(S) | MR. AJ. ROUX
MODERATOR: | DR. D. NTERAMPEBA
THIS QUESTION PAPER CONSISTS OF 5 PAGES
(Excluding Statistical Table and Graph Paper)
INSTRUCTIONS
1. Answer ALL the questions in the booklet provided.
2. Show clearly all the steps used in the calculations.
3. All written work must be done in blue or black ink.
PERMISSIBLE MATERIALS
1. Non-programmable calculator without a cover.
ATTACHMENTS
1. Statistical Tables ( Z-Tables )
2. Graph Paper x 3
|
|
2 Page 2 |
▲back to top |
QUESTION
1
[30]
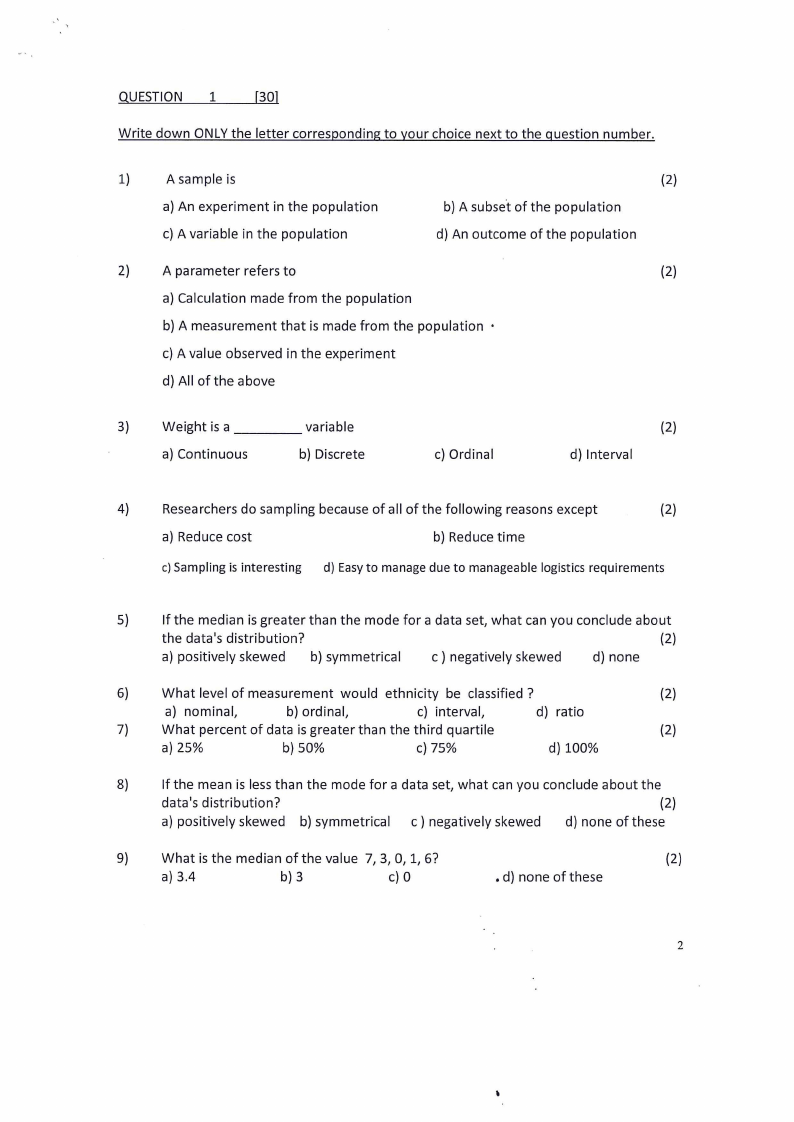
Write down ONLY the letter corresponding to your choice next to the question number.
1)
A sample is
a) An experiment in the population
c) A variable in the population
(2)
b) A subset of the population
d) An outcome of the population
2)
A parameter refers to
(2)
a) Calculation made from the population
b) A measurement that is made from the population -
c) A value observed in the experiment
d) All of the above
Weight is a
a) Continuous
variable
b) Discrete
c) Ordinal
(2)
d) Interval
4)
Researchers do sampling because of all of the following reasons except
(2)
a) Reduce cost
b) Reduce time
c) Sampling is interesting | d) Easy to manage due to manageable logistics requirements
5)
If the median is greater than the mode for a data set, what can you conclude about
the data's distribution?
(2)
a) positively skewed __ b) symmetrical
c ) negatively skewed
d) none
6)
What level of measurement would ethnicity be classified ?
(2)
a) nominal,
b) ordinal,
c) interval,
d) ratio
What percent of data is greater than the third quartile
(2)
a) 25%
b) 50%
c) 75%
d) 100%
8)
If the mean is less than the mode for a data set, what can you conclude about the
data's distribution?
(2)
a) positively skewed b)symmetrical c)negativelyskewed
dd) none of these
9)
What is the median of the value 7, 3, 0,1, 6?
(2)
a) 3.4
b) 3
c) 0
.d) none of these
|
|
3 Page 3 |
▲back to top |
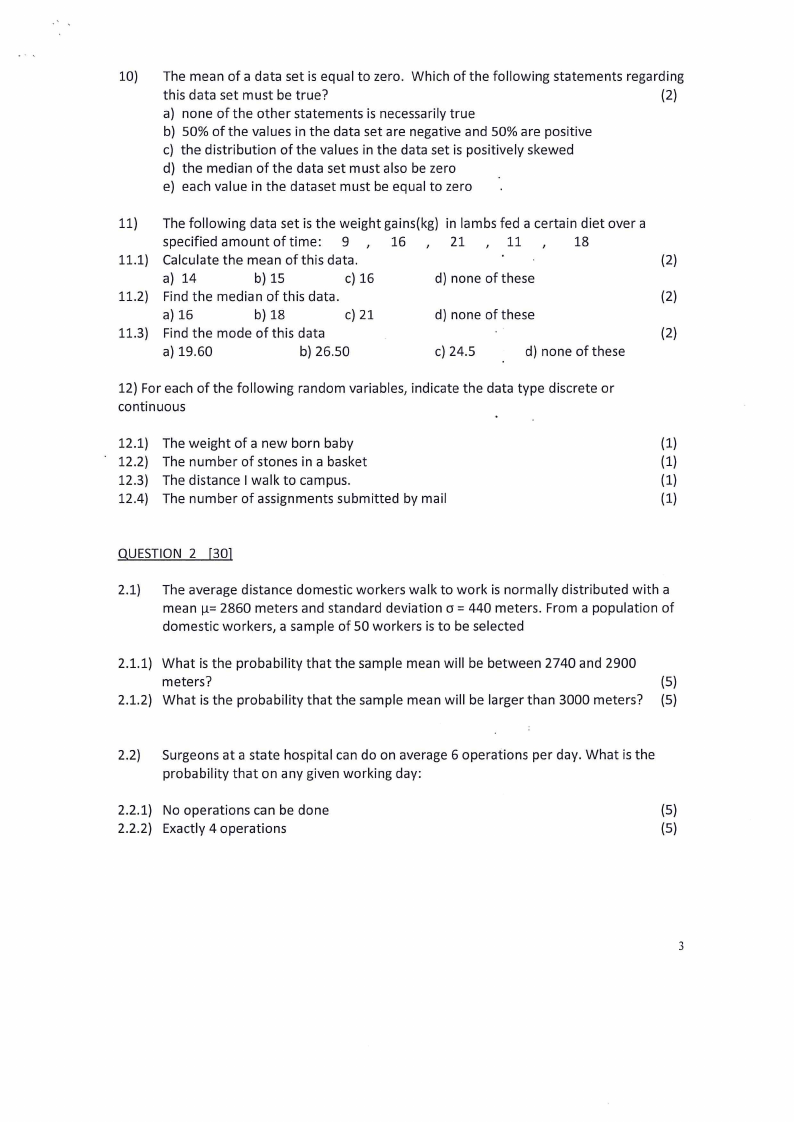
10)
The mean of a data set is equal to zero. Which of the following statements regarding
this data set must be true?
(2)
a) none of the other statements is necessarily true
b) 50% of the values in the data set are negative and 50% are positive
c) the distribution of the values in the data set is positively skewed
d) the median of the data set must also be zero
e) each value in the dataset must be equal to zero
11)
The following data set is the weight gains(kg) in lambs fed a certain diet over a
specified amountoftime: 9 , 16 , 21 , 11 , 18
11.1) Calculate the mean of this data.
..
(2)
a) 14
b) 15
c) 16
d) none of these
11.2) Find the median of this data.
(2)
a) 16
b) 18
c) 21
d) none of these
11.3) Find the mode of this data
(2)
a) 19.60
b) 26.50
c) 24.5
d) none of these
12) For each of the following random variables, indicate the data type discrete or
continuous
12.1) The weight of a new born baby
(1)
12.2) The number of stones in a basket
(1)
12.3) The distance | walk to campus.
(1)
12.4) The number of assignments submitted by mail
(1)
QUESTION 2 [30
2.1) The average distance domestic workers walk to work is normally distributed with a
mean = 2860 meters and standard deviation o = 440 meters. From a population of
domestic workers, a sample of 50 workers is to be selected
2.1.1) What is the probability that the sample mean will be between 2740 and 2900
meters?
(5)
2.1.2) What is the probability that the sample mean will be larger than 3000 meters? (5)
2.2) Surgeons at a state hospital can do on average 6 operations per day. What is the
probability that on any given working day:
2.2.1) No operations can be done
(5)
2.2.2) Exactly 4 operations
(5)
|
|
4 Page 4 |
▲back to top |
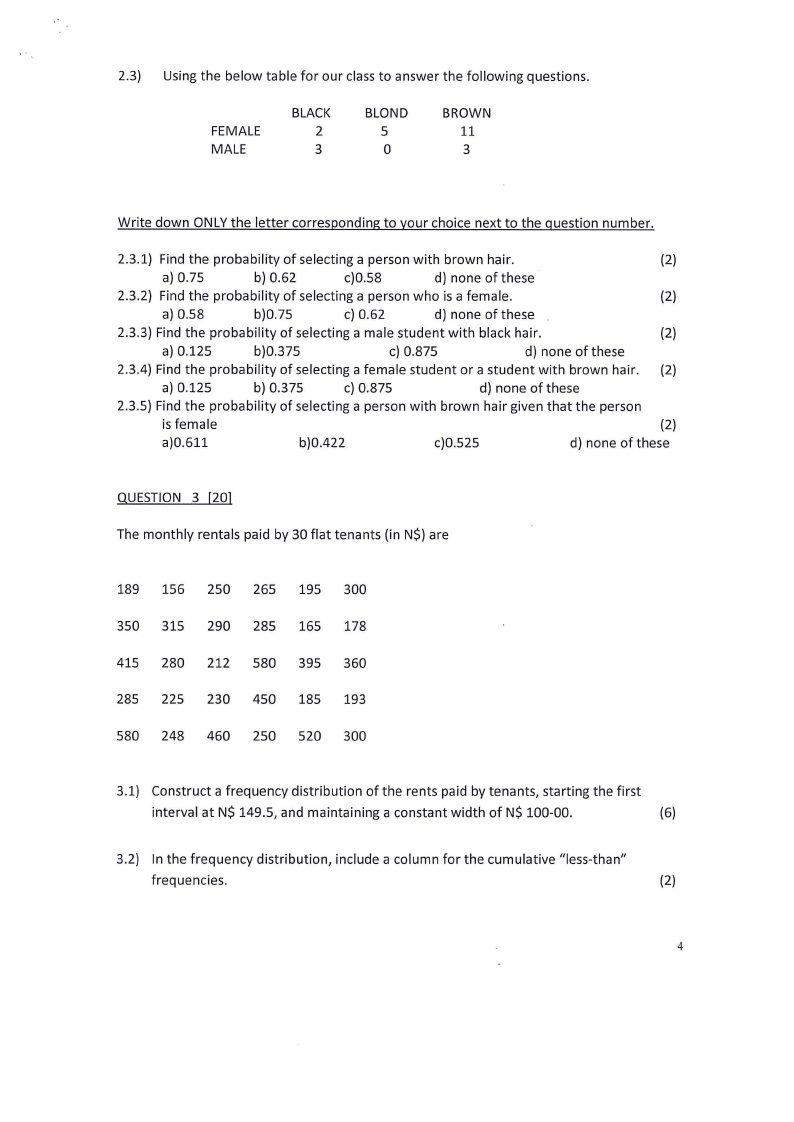
2.3) | Using the below table for our class to answer the following questions.
FEMALE
MALE
BLACK
2
3
BLOND
5
0
BROWN
11
3
Write down ONLY the letter corresponding to your choice next to the question number.
2.3.1) Find the probability of selecting a person with brown hair.
(2)
a) 0.75
b) 0.62
c)0.58
d) none of these
2.3.2) Find the probability of selecting a person who is a female.
(2)
a) 0.58
b)0.75
c) 0.62
d) none of these
2.3.3) Find the probability of selecting a male student with black hair.
(2)
a) 0.125
b)0.375
c) 0.875
d) none of these
2.3.4) Find the probability of selecting a female student or a student with brown hair. (2)
a) 0.125
b) 0.375
c) 0.875
d) none of these
2.3.5) Find the probability of selecting a person with brown hair given that the person
is female
(2)
a)0.611
b)0.422
c)0.525
d) none of these
QUESTION 3 [20]
The monthly rentals paid by 30 flat tenants (in NS) are
189 156 250 265 195 300
350 315 290 285 165 178
415 280 212 580 395 360
285 225 230 450 185 193
580 248 460 250 520 300
3.1) Construct a frequency distribution of the rents paid by tenants, starting the first
interval at NS 149.5, and maintaining a constant width of NS 100-00.
(6)
3.2) In the frequency distribution, include a column for the cumulative “less-than”
frequencies.
(2)
|
|
5 Page 5 |
▲back to top |
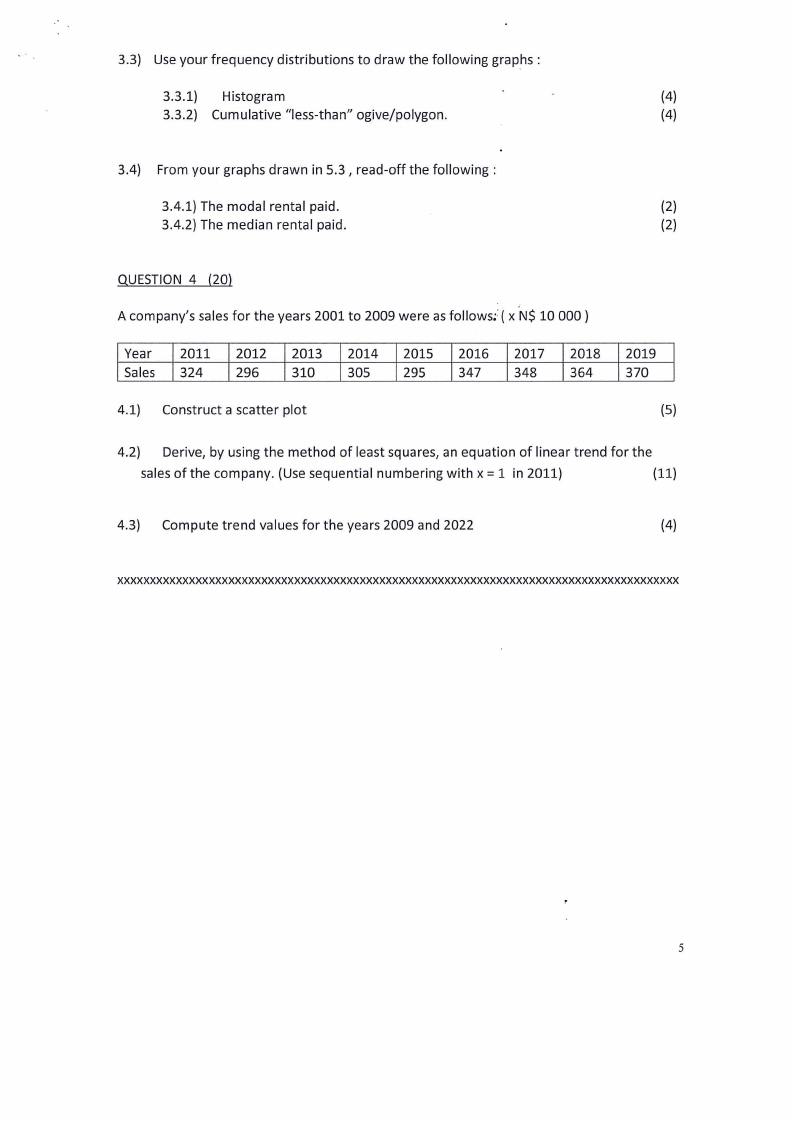
3.3) Use your frequency distributions to draw the following graphs :
3.3.1) Histogram
‘
:
(4)
3.3.2) Cumulative “less-than” ogive/polygon.
(4)
3.4) From your graphs drawn in 5.3 , read-off the following :
3.4.1) The modal rental paid.
(2)
3.4.2) The median rental paid.
(2)
QUESTION 4 (20)
A company’s sales for the years 2001 to 2009 were as follows:( x NS 10 000 )
Year
2011
2012
2013
2014 | 2015 | 2016 | 2017
2018 | 2019
Sales | 324
296
310
305
295
347
348
364
370
4.1) Construct a scatter plot
(5)
4.2) Derive, by using the method of least squares, an equation of linear trend for the
sales of the company. (Use sequential numbering with x = 1 in 2011)
(11)
4.3) Compute trend values for the years 2009 and 2022
(4)
XXXXXXXXXXXXXX XXX XXXXXAXXXAXX XXX KKK KX XXKX XXX XXX KKK KKK XK KK KKK KKK KKK XXX KKK KKXKXKX KKK KKK AX KKK KKK
|
|
6 Page 6 |
▲back to top |
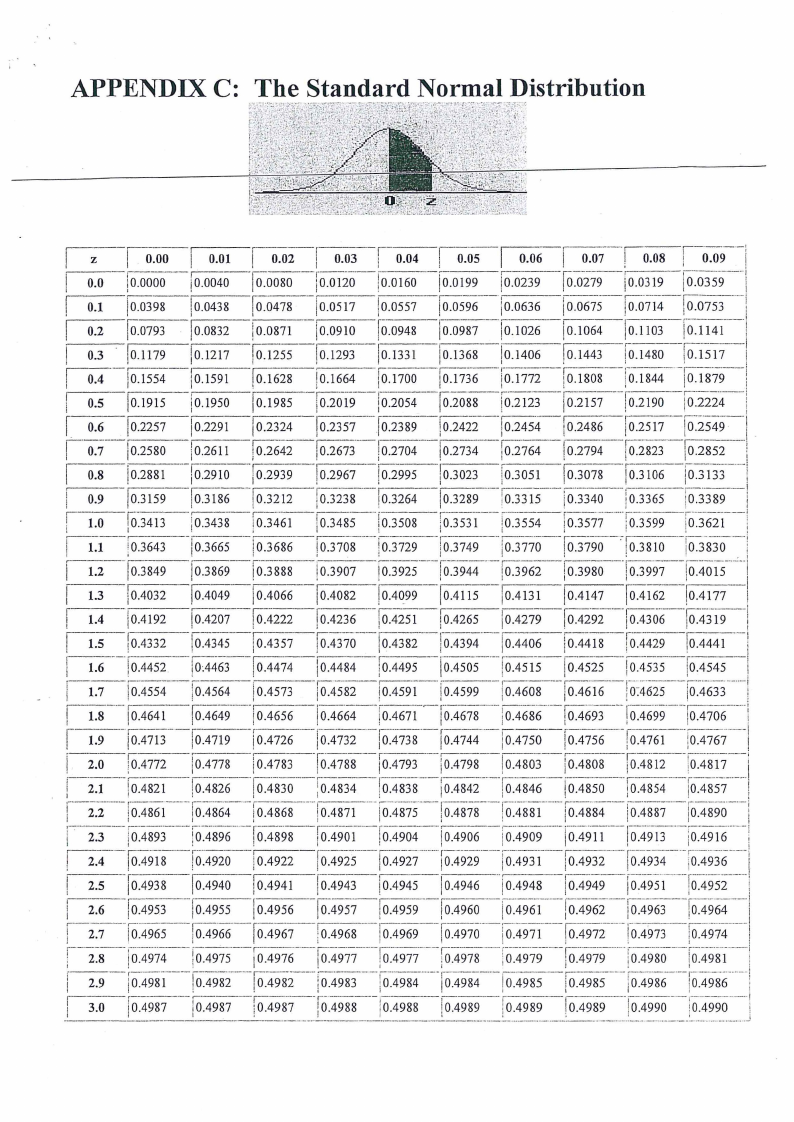
APPENDIX C: The Standard Normal Distribution
[ z | 000 | oor
| 0.0 {0.0000 [0.0040
[ 01 [0.0398 [0.0438
[ 0.2 [0.0793 {0.0832
| 03 © [0.1179 0.1217
[04 [o.issa [0.1591
| 05 [0.1915 [0.1950
| 0.6 [0.2257 [0.2291
| 0.7 {0.2580 0.2611
[os (02881 {02910
| 0.9 0.3159 (0.3186
1.0 [0.3413 (0.3438
| 11 0.3643 [0.3665
[12 [03849 [03869
| 13 0.4032 [0.4049
| 14 0.4192 [0.4207
| 15 10.4332 10.4345
| 16 10.4452 [04463
| LT 10.4554 (0.4564
| 18 (0.4641 [0.4649
| 19 [04713 (0.4719
| 2.0 10.4772 0.4778
| 24 10.4821 10.4826
| 2.2 (0.4861 [0.4864
| 2.3 0.4893 10.4896
| 24 [04918 [0.4920
[| 25 0.4938 [0.4940
/ 2.6 [0.4953 0.4955
' 27 [0.4965 = (0.4966
' 28 10.4974 10.4975
| 2.9 (0.4981 [0.4982
| 3.0 [0.4987 0.4987
| 002 | 003 | 004 | 0.05 | 0.06 | 007 |0.08 | 0.09
{0.0080 0.0120 [0.0160 0.0199 [0.0239 [0.0279 0.0319 0.0359
[0.0478 0.0517 10.0557 [0.0596 [0.0636 0.0675 0.0714 0.0753
{0.0871 0.0910 [0.0948 + 0.0987 [0.1026 [0.1064 0.1103 0.1141
[0.1255 [0.1293 [0.1331 [0.1368 [0.1406 [0.1443 10.1480 0.1517
[0.1628 [0.1664 [0.1700 [0.1736 0.1772 [0.1808 0.1844 (0.1879
0.1985 0.2019 [0.2054 [0.2088 (0.2123 |0.2157 [0.2190 0.2224
[0.2324 [0.2357 0.2389 (0.2422 [0.2454 10.2486 0.2517 10.2549
10.2642 [0.2673 10.2704 0.2734 0.2764 10.2794 0.2823 -|0.2852
[0.2939 [0.2967 (0.2995 (0.3023 (0.3051 [0.3078 (03106 (0.3133
0.3212 10.3238 = 0.3264 »—-|0.3289 0.3315 0.3340 0.3365 0.3389
(0.3461 (0.3485 10.3508 (0.3531 10.3554 0.3577 «0.3599 0.3621
[0.3686 10.3708 10.3729 «0.3749 [0.3770 -*([0.3790 10.3810 0.3830
[0388s (03907 (0.3925 [0.3944 (0.3962 10.3980 (03997 (0.4015
0.4066 += [0.4082 10.4099 [0.4115 0.4131 10.4147 [0.4162 (0.4177
0.4222 -|0.4236 10.4251 (10.4265 [0.4279 [0.4292 0.4306 0.4319
0.4357 «(0.4370 «(10.4382 ~—«(0.4394 «0.4406 0.4418 ~—'0.4429 ~—(|0.4441
«0.4474 = /0.4484 «10.4495 0.4505 10.4515 0.4525 10.4535 10.4545
10.4573 10.4582 (0.4591 (0.4599 0.4608 + |0.4616 0.4625 (0.4633
0.4656 += |0.4664~—«0.4671 «(0.4678 ~=—«0.4686 10.4693 10.4699 10.4706
(0.4726 10.4732 (0.4738 [0.4744 10.4750 [0.4756 10.4761 (0.4767
0.4783 «(10.4788 + j0.4793-—-|0.4798 «(10.4803 10.4808 += 0.4812 0.4817 4
(0.4830 0.4834 «(10.4838 40.4842 0.4846 ~—|0.4850 10.4854 ‘(0.4857
[0.4868 10.4871 (0.4875 (0.4878 [0.4881 [0.4884 0.4887 (0.4890
[0.4898
0.4922
(0.4901
0.4925
{0.4904
[0.4927
[0.4906
10.4929
0.4909
0.4931
0.4911
[0.4932
[0.4913
[0.4934
0.4916
0.4936
|i
[0.4941 (0.4943 [0.4945 | [0.4946 (0.4948 [0.4949 [0.4951 [0.4952
[0.4956 [0.4957 [0.4959 [0.4960 0.4961 0.4962 0.4963 (0.4964
[0.4967 0.4968» 10.4969 (0.4970 10.4971 (10.4972 (0.4973 (0.4974
10.4976 (0.4977 (0.4977 (0.4978 +~—.0.4979 [0.4979 0.4980 (0.4981
[0.4982 10.4983 0.4984 0.4984 (10.4985 0.4985 0.4986 10.4986
10.4987 10.4988 10.4988 10.4989 0.4989 «(10.4989 (0.4990 0.4990
|
|
7 Page 7 |
▲back to top |
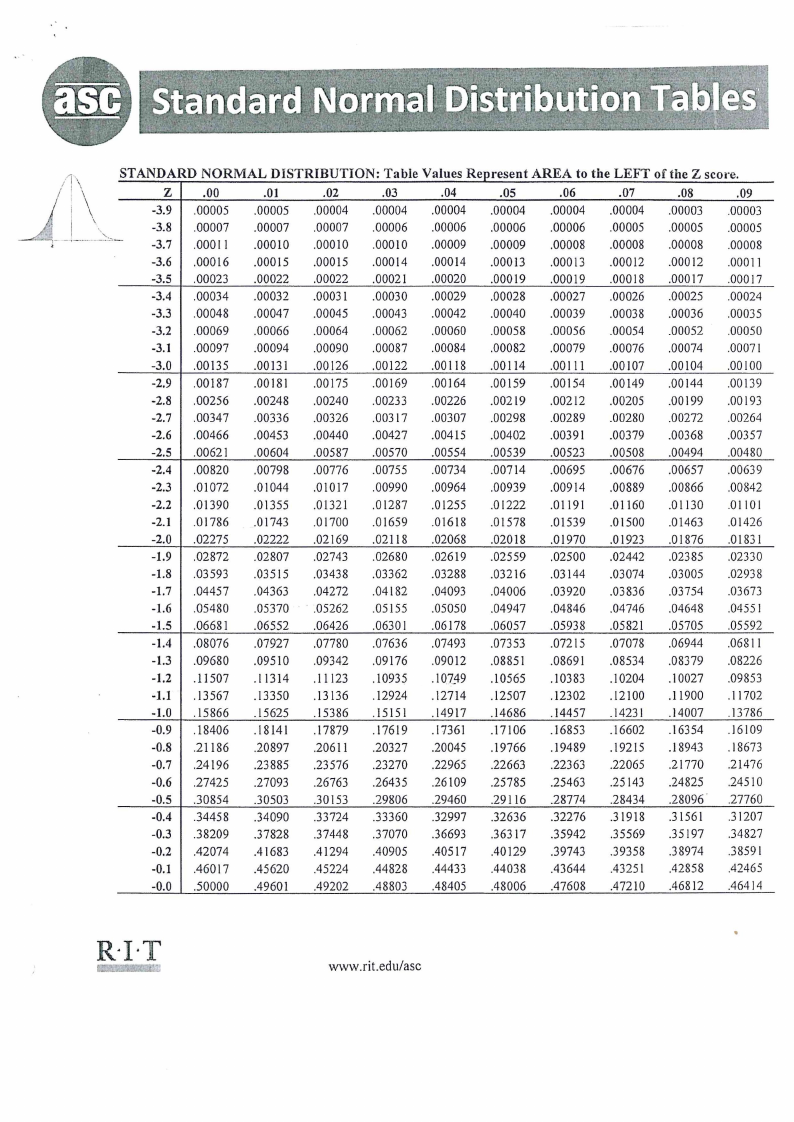
STANDARD NORMAL DISTRIBUTION: Table Values Represent AREA to the LEFT of the Z score.
Z
.00
-01
02
.03
.04
05
.06
-07
-08
.09
-3.9 | .00005
00005
.00004
.00004
.00004
00004
.00004
00004
.00003
.00003
.
-3.8 | .00007
-00007
.00007
.00006
.00006
.00006
.00006
.00005
00005
00005
a
-3.7 | .00011
-00010
.00010
.00010
.00009
00009
.00008
00008
.00008
00008
-3.6 | .00016
00015
00015
00014
00014
.00013
.00013
.00012
.00012
00011
-3.5 | .00023
00022
00022
00021
00020
00019
00019
.00018
00017
00017
-3.4 | .00034
00032
00031
.00030
00029
.00028
00027
.00026
.00025
.00024
-3.3 | .00048
00047
00045
.00043
00042
.00040
00039
.00038
.00036
.00035
-3.2 | .00069
00066
.00064
00062
.00060
.00058
.00056
.00054
00052
.00050
-3.1 | .00097
.00094
.00090
.00087
00084
00082
.00079
.00076
.00074
.00071
-3.0 | .00135
00131
.00126
00122
_—.00118
00114
00111
00107
_—«.00104
.00100
-2.9 | .00187
00181
00175
00169
.00164
00159
00154
00149
00144
00139
-2.8 | .00256
00248
.00240
.00233
00226
00219
00212
.00205
00199
00193
-2.7 | .00347
.00336
.00326
00317 = .00307
00298
.00289
.00280
00272
.00264
-2.6 | .00466
00453
.00440
00427 = .00415
00402
00391
00379 = .00368
.00357
-2.5 | .00621
00604
-00587
.00570
00554
00539
.00523
00508
00494
00480
-2.4 | .00820
00798
.00776
.00755
.00734
00714
00695
.00676
00657
00639
-2.3 | .01072
.01044
01017
00990
00964
00939
00914
00889
00866
00842
-2.2 | .01390
01355
01321
.01287
01255
01222
01191
.01160
01130
01101
-2.1 | .01786
01743
.01700
.01659
01618
01578
01539
.01500
.01463
01426
-2.0 | .02275
02222
02169
02118
02068
02018
01970
01923
.01876
01831
-1.9 | .02872
02807
02743
.02680
02619
02559
02500
02442
02385
02330
-1.8 | .03593
03515
03438
.03362
03288
03216
03144
03074
.03005
.02938
-1.7 | .04457
.04363
04272
=—.04182 = .04093
04006
03920
.03836
03754
.03673
-1.6 | .05480
.05370
05262
05155
05050
04947
04846
.04746
04648
0455]
-1.5 | .06681
06552
06426
06301
06178
06057
05938
05821
05705
05592
-1.4 | .08076
07927
.07780
.07636
07493
07353
07215
.07078
06944
06811
-1.3 | .09680
09510
09342
09176
09012
08851
08691
08534
08379
08226
-1.2 | .11507
11314
11123
10935
10749
.10565
10383
10204
10027
09853
-1.1 | .13567
.13350
13136
12924 = 12714
12507
.12302
12100
.11900
11702
-1.0 | .15866
15625
15386
S151
14917
14686
14457
1423]
14007
13786
-0.9 | .18406
18141
17879
17619
-.17361
17106
16853
16602
16354
16109
-0.8 | .21186
.20897
20611
.20327 = .20045
.19766
19489
19215
18943
18673
-0.7 | .24196
23885
.23576
.23270
22965
.22663
.22363
.22065
.21770
.21476
-0.6 | .27425
.27093
.26763
26435
.26109
25785
.25463
.25143
24825
24510
-0.5 | .30854
30503
30153
29806
29460
29116
28774
28434
28096
_.27760
-0.4 | .34458
34090
33724
33360
32997
32636
32276
31918
31561
31207
-0.3 | .38209
37828
37448
.37070
36693
36317
35942
35569 = .35197
34827
-0.2 | .42074
-0.1 | .46017
41683
45620
41294
45224
40905
44828
40517
44433
40129
44038
39743
43644
39358
43251
38974
42858
38591
42465
-0.0 | .50000
49601
49202
48803
48405
48006
47608
A7210_
__—.46812
46414
RAT cSeeO neR meiE emenn
www.rit.edu/asc
|
|
8 Page 8 |
▲back to top |
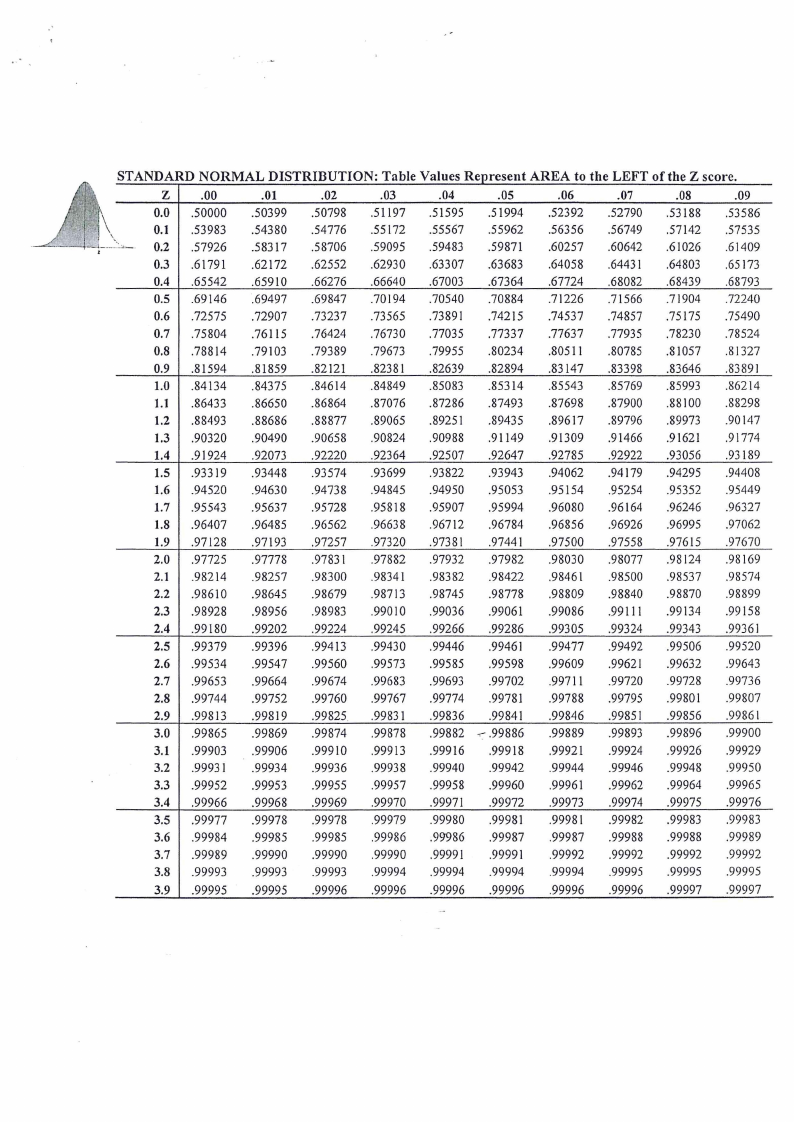
STANDARD NORMAL DISTRIBUTION: Table Values Represent AREA to the LEFT of the Z score.
Zz
-00
01
02
03
04
05
06
07
-08
.09
0.0 | .50000
0.1 | .53983
50399
54380
50798
54776
1197
55172
51595
55567
51994
55962
52392
56356
52790
56749
53188
57142
53586
91535
= 0.2 | .57926
58317
.58706
59095
59483
59871
.60257
60642
61026
61409
0.3 | .61791
0.4 | .65542
.62172
65910
62552
.66276
62930 ~=—- 63307 ~— 63683
66640
_—.67003
.67364
64058
67724
6443]
68082
.64803
68439
65173
68793
0.5 | .69146
69497
.69847
=.70194
~—.70540
.70884
.71226
.71566
.71904
.72240
0.6 | .72575
£72907
.73237
73565
.7389 1
74215
74537
74857 = £75175
.75490
0.7 | .75804
76115
.76424
.76730 ~~ .77035
.77337
.77637
.77935
.78230
.78524
0.8 | .78814
.79103
79389
79673
.79955
80234
80511
80785
81057
81327
0.9 | .81594
81859
82121
82381
82639
82894
83147
83398
83646
8389]
1.0 | .84134
84375
84614
84849 = .85083
85314
85543
85769
85993
86214
1.1 | .86433
.86650
86864
.87076 = .87286
87493
87698
.87900
88100
88298
1.2 | .88493
88686
88877
89065
89251
89435
89617
89796
89973
90147
1.3 | .90320
90490
.90658
90824
.90988
91149
91309
91466
91621
91774
1.4 | .91924
92073
92220
92364
92507
92647
92785
92922
93056
93189
1.5 | .93319
93448
93574
93699 = 93822
93943
94062
94179
94295
94408
1.6 | .94520
.94630
94738
94845
94950
95053
95154
95254
95352
95449
1.7 | .95543
95637
95728
95818 = 95907
95994
.96080
96164
.96246
.96327
1.8 | .96407
96485
96562
96638
.96712
96784
.96856
.96926
96995
97062
1.9 | .97128
97193
97257
97320
97381
97441
.97500
97558
97615
97670
2.0 | .97725
97778
.9783 | 97882
97932
97982
.98030
98077 —.98 124
98169
2.1 | .98214
98257
.98300
9834]
98382
98422
98461
98500 = .98537
98574
2.2 | .98610
98645
98679
.98713
98745
.98778
98809
98840
.98870
98899
2.3 | .98928
98956
98983
99010
99036
99061
.99086
99111
99134
99158
2.4 | .99180
99202
99224
99245
99266
99286
99305
99324
99343
9936]
2.5 | .99379
99396
99413
99430
99446
9946]
99477
99492 = .99506
99520
2.6 | .99534
99547
99560
99573
99585
99598
99609
99621
99632
99643
2.7 | .99653
99664
99674
99683
99693
99702
99711
99720
99728
99736
2.8 | .99744
99752
99760
99767
~—-.99774
9978]
.99788
99795
99801
99807
2.9 | .99813
99819
99825
99831
99836
99841
99846
99851
99856
9986 |
3.0 | .99865
99869
99874
99878
99882 - 99886
99889
99893
99896
99900
3.1 | .99903
3.2 | .99931
— .99906
99934
99910
99936
99913
99938
99916
99940
99918
99942
99921
99944
99924
99926
99946 = .99948
99929
99950
3.3 | .99952
99953
99955
99957
99958
99960
99961
99962
.99964
99965
3.4 | .99966
99968
99969
99970
99971
99972
99973
99974
99975
99976
3.5 | .99977
99978
99978
99979
99980
99981
9998 | 99982 = .99983
99983
3.6 | .99984
99985
99985
99986
99986
99987
99987
99988
99988
99989
3.7 | .99989
99990
99990
99990 = .9999|
99991
99992
99992
99992
99992
3.8 | .99993
99993
99993
99994 = .99994
99994
99994
99995
99995
99995
3.9 | .99995
99995
99996
99996
_.99996
99996
99996
99996
_.99997
99997