DAE702S - DESIGN AND ANALYSIS OF EXPERIMENT - 1ST OPP - NOV 2022


DAE702S - DESIGN AND ANALYSIS OF EXPERIMENT - 1ST OPP - NOV 2022


1 Pages 1-10

▲back to top


1.1 Page 1

▲back to top


n Am I BI A uni VER s ITY
OF SCIEnCE AnD TECHnOLOGY
FACULTY OF HEALTH AND APPLIED SCIENCES
DEPARTivIENT OF MATHEl\\iIATICS
I QUALIFICATION:
PROGRAMME
I CODE:
I COURSE CODE:
I DATE
I DURATION:
BACHELOR OF SCIENCE IN APPLIED MATHEMATICS AND
STATISTICS
07BAMS
I LEVEL: 7
DAE702S
Nov-2022
3 HOURS
COURSE
I NAME:
I PAPER:
I MARKS
DESIGN ANDANALYSIS OF EXPER-1
IMENT
THEORY
I
100
I
FIRST OPPORTUNITY EXAMINATION QUESTION PAPER
I EXAMINER
I MODERATOR
J Dr. Jacob Ong'ala
J Prof Peter Njuho
INSTRUCTION
1. Answer ALL the questions in the booklet provided
2. Scan your answer sheet and upload it in the e-learning
2. · Show clearly all the steps used in the calculation
3. All written work must be shown in the answer sheet.
THIS QUESTION
PERMISSIBLE MATERIALS
Non-programmable calculator without cover
PAPER CONSISTS OF 15 PAGERS (including the front page and
attachments)
1

1.2 Page 2

▲back to top


QUESTION ONE - 26 MARKS
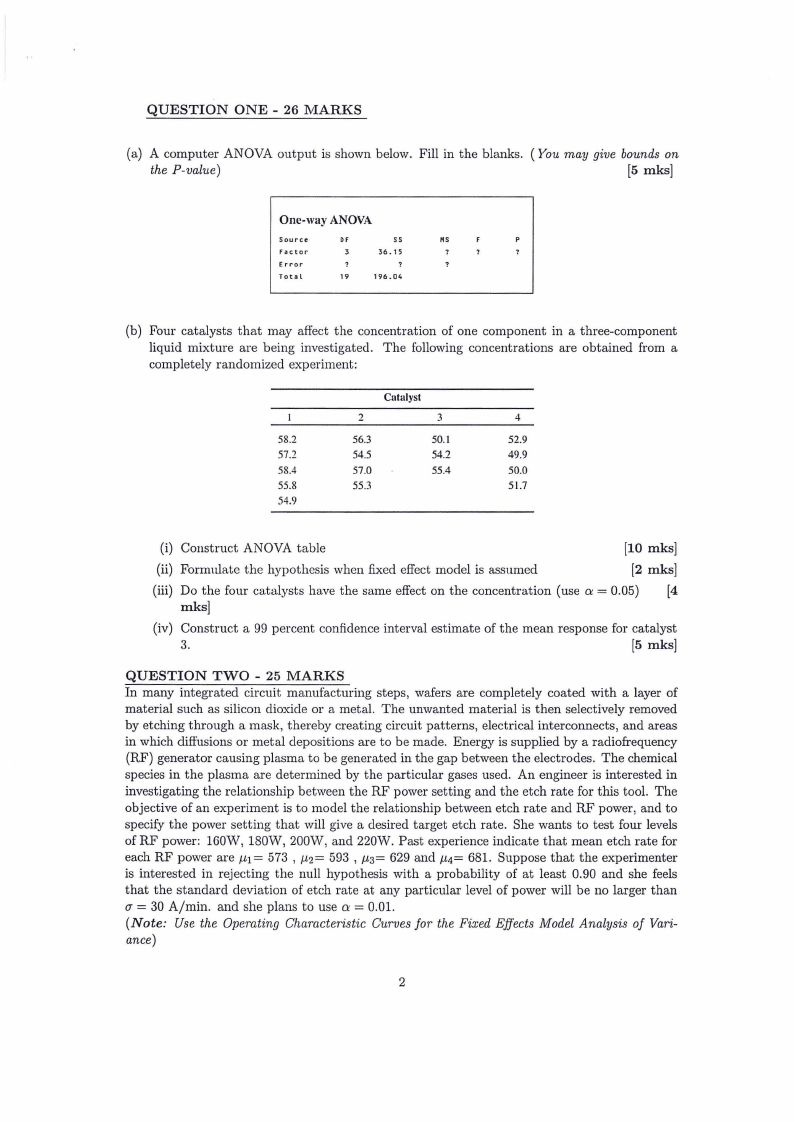
(a) A computer ANOVA output is shown below. Fill in the blanks. ( You may give bounds on
the P-value)
[5 mks)
One-way ANOVA
Source
DF
ss
MS
Factor
36.15
Error
Total
19
196.04
(b) Four catalysts that may affect the concentration of one component in a three-component
liquid mixture are being investigated. The following concentrations are obtained from a
completely randomized experiment:
Catalyst
2
3
4
58.2
56.3
57.2
54.5
58.4
57.0
55.8
55.3
54.9
50.1
52.9
54.2
49.9
55.4
50.0
51.7
(i) Construct ANOVA table
[10 mks]
(ii) Formulate the hypothesis when fixed effect model is assumed
[2 mks]
(iii) Do the four catalysts have the same effect on the concentration (use a= 0.05) [4
mks]
(iv) Construct a 99 percent confidence interval estimate of the mean response for catalyst
3.
[5 mks]
QUESTION TWO - 25 MARKS
In many integrated circuit manufacturing steps, wafers are completely coated with a layer of
material such as silicon dioxide or a metal. The unwanted material is then selectively removed
by etching through a mask, thereby creating circuit patterns, electrical interconnects, and areas
in which diffusions or metal depositions are to be made. Energy is supplied by a radiofrequency
(RF) generator causing plasma to be generated in the gap between the electrodes. The chemical
species in the plasma are determined by the particular gases used. An engineer is interested in
investigating the relationship bet·ween the RF power setting and the etch rate for this tool. The
objective of an experiment is to model the relationship between etch rate and RF power, and to
specify the power setting that will give a desired target etch rate. She wants to test four levels
of RF power: 160W, 180W, 200W, and 220W. Past experience indicate that mean etch rate for
each RF power are µ1= 573 , µ2= 593 , µ3= 629 and µ4= 681. Suppose that the experimenter
is interested in rejecting the null hypothesis with a probability of at least 0.90 and she feels
that the standard deviation of etch rate at any particular level of power will be no larger than
er= 30 A/min. and she plans to use a = 0.01.
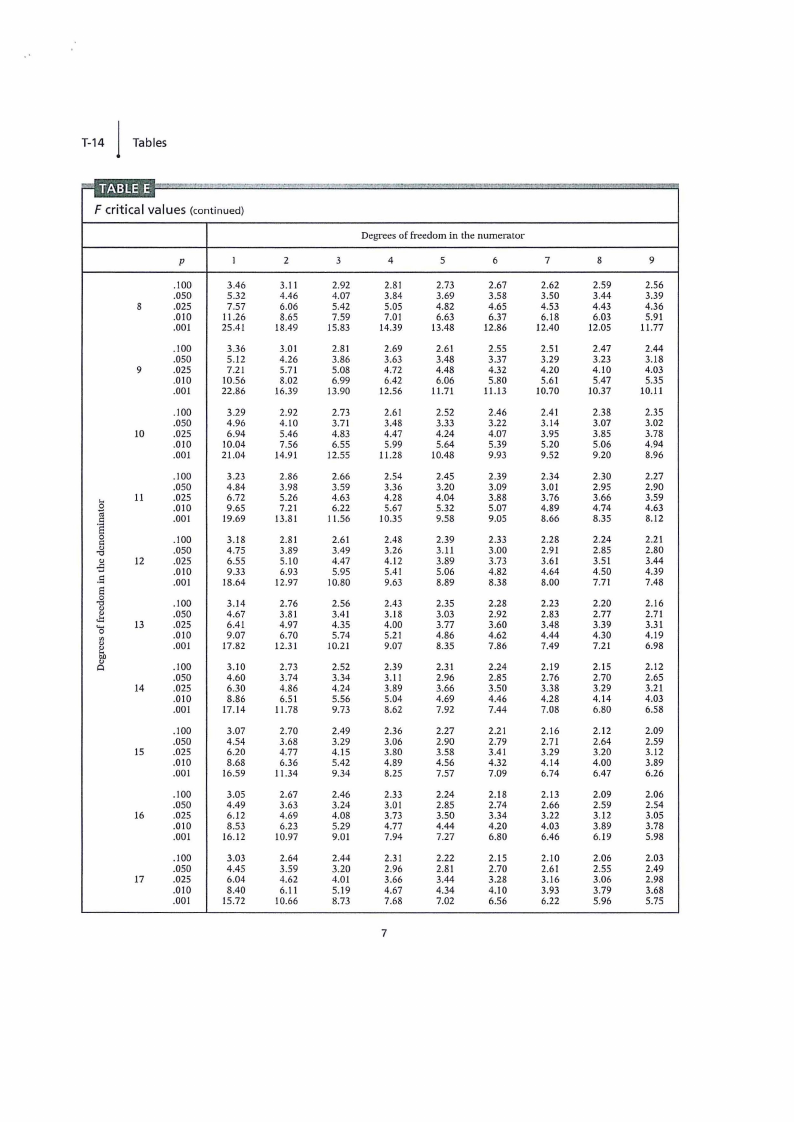
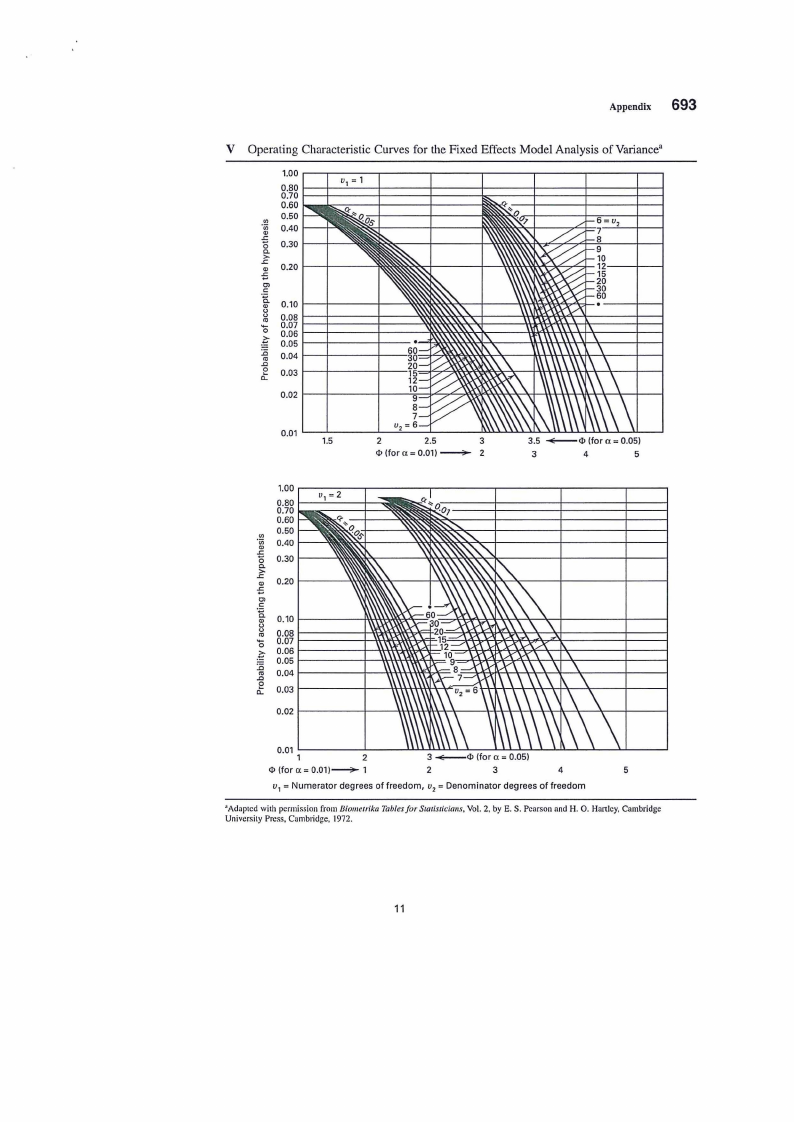
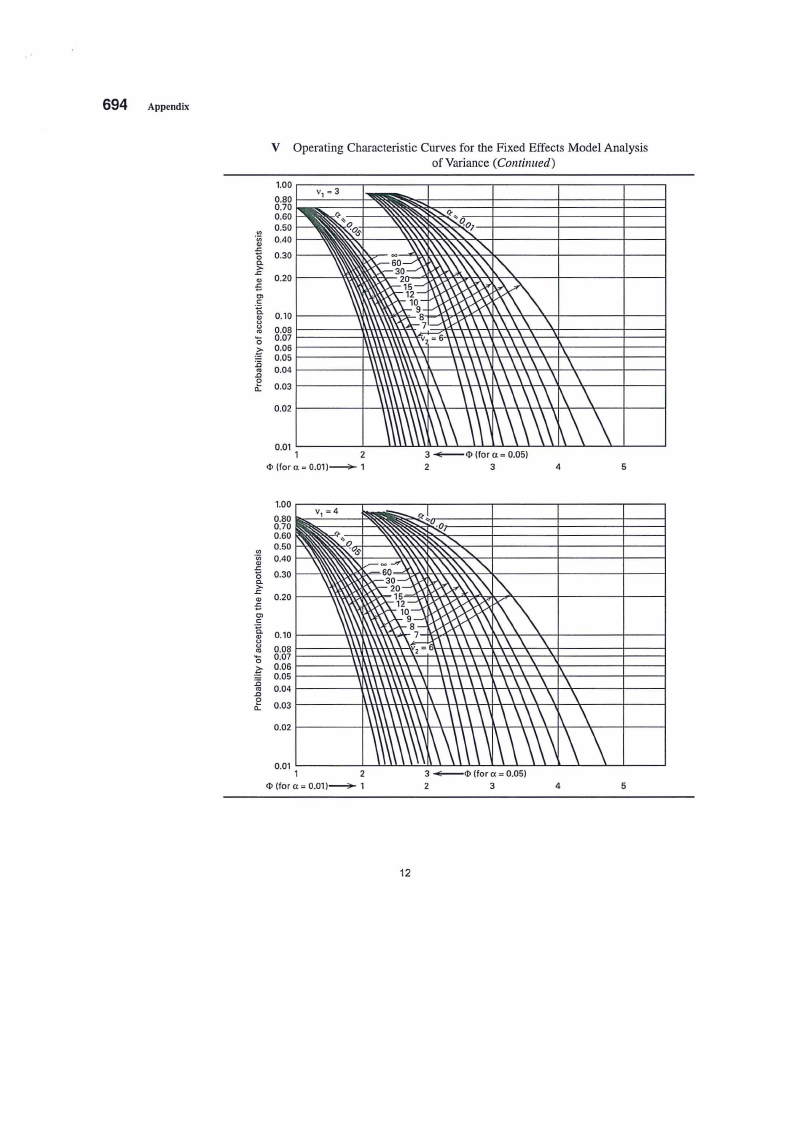
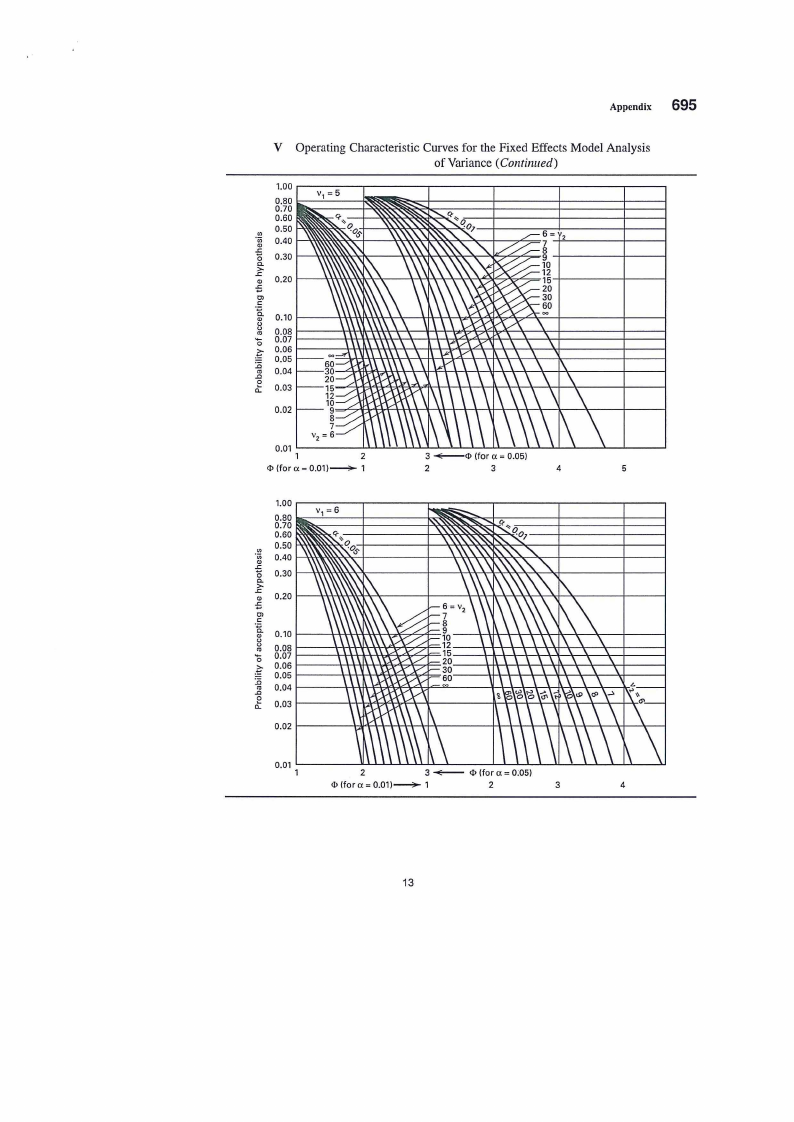
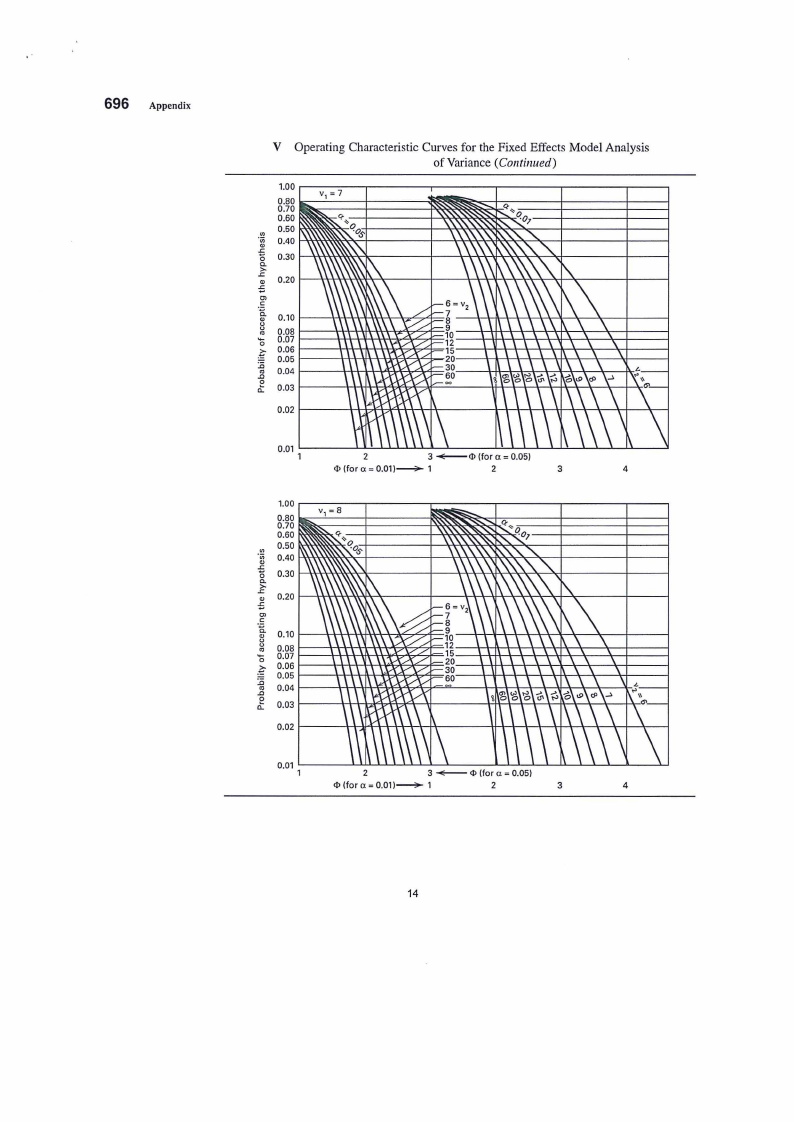
(Note: Use the Operating Characteristic Curves for the Fixed Effects Model Analysis of Vari-
ance)
2

1.3 Page 3

▲back to top


(a) Compute the treatment effect for each RF power using the above information
[2 mks]
(b) Starting with an initial sample 3, determine the recommended minimum sample size (n*)for
each treatments that is required to obtain power of 0.90
[18 mks]
(c) Calculate the power of the test if the sample size is n* + 1
[3 mks]
(d) Is there any need for taking larger samples i.e.n* + a where a 2::2. Explain your answer?
[2 mks]
QUESTION THREE - 29 MARKS
(a) The ANOVA from a randomized complete block experiment output is shown below.
Source
Treatment
Block
Error
Total
ss
MS
Fp
4 1010.56
? 29.84 ?
? 64.765
??
20 169.33
?
29 1503.71
(i) Fill in the blanks
(ii) How many blocks were used in this experiment?
(iii) What conclusions can you draw?
[4 mks]
[1 mks]
[2 mks]
(b) Three different washing solutions are being compared to study their effectiveness in retard-
ing bacteria growth in 5-gallon milk containers. The analysis is done in a laboratory, and
only three trials can be run on any day. Because days could represent a potential source
of variability, the experimenter decides to use a randomized block design. Observations are
taken for four days, and the data are shown below
Solution
I
2
3
Days
1
2
3
4
13
22
18
39
16
24
17
44
5
4
22
(i) Analyze the data from this experiment. (use a:= 0.05)
[13 mks]
(ii) Use the Fisher LSD method to make comparisons among the three Solutions at a: =
0.05
[9 mks]
3

1.4 Page 4

▲back to top


QUESTION FOUR - 20 MARKS
An industrial engineer is investigating the effect of four assembly methods (A, B, C, D) on
the assembly time for a color television component. Four operators are selected for the study.
Furthermore, the engineer knows that each assembly method produces such fatigue that the
time required for the last assembly may be greater than the time required for the first, regardless
of the method. That is, a trend develops in the required assembly time. To account for this
source of variability, the engineer uses the Latin square design shown below. Analyze the data
from this experiment ( a= 0.05) and draw appropriate conclusions. (In this question, use coded
data)
Order of
Assembly
I
2
3
4
1
C= IO
B =?
A= 5
D= 10
Operator
2
3
D = 14
C = 18
B = 10
A= 10
A= 7
D= II
C= II
B = 12
4
B=S
A= 8
D=9
C= 14
- END OF QUESTIONS -
4

1.5 Page 5

▲back to top


l T-12
Tables
Table entry for p is the
critical value f• with
probability p lying to
its right.
=mmJ
F critical values
p
.100
.050
I .025
.010
.001
.100
.050
2 .025
.010
.001
.100
'0-
.050
"'·sc:: 3 .025
.010
0c::
.001
OJ
-0
.sOJ
.s 4
.100
.050
.025
8
0
-0
OJ
.010
.001
"0""'
II)
OJ
OJ
t'-:D
5
OJ
A
.100
.050
.025
.010
.001
.100
.050
6 .025
.010
.001
.100
.050
7 .025
.010
.001
1
39.86
161.45
647.79
4052.2
405284
8.53
18.51
38.51
98.50
998.50
5.54
10.13
17.44
34.12
167.03
4.54
7.71
12.22
21.20
74.14
4.06
6.61
10.01
16.26
47.18
3.78
5.99
8.81
13.75
35.51
3.59
5.59
8.07
12.25
29.25
2
49.50
199.50
799.50
4999.5
500000
9.00
19.00
39.00
99.00
999.00
5.46
9.55
16.04
30.82
148.50
4.32
6.94
10.65
18.00
61.25
3.78
5.79
8.43
13.27
37.12
3.46
5.14
7.26
10.92
27.00
3.26
4.74
6.54
9.55
21.69
Probability p
=
Degrees of freedom in the numerator
3
4
5
6
7
53.59
215.71
864.16
5403.4
540379
55.83
224.58
899.58
5624.6
562500
57.24
230.16
921.85
5763.6
576405
58.20
233.99
937.11
5859.0
585937
58.91
236.77
948.22
5928.4
592873
9.16
19.16
39.17
99.17
999.17
9.24
19.25
39.25
99.25
999.25
9.29
19.30
39.30
99.30
999.30
9.33
19.33
39.33
99.33
999.33
9.35
19.35
39.36
99.36
999.36
5.39
9.28
15.44
29.46
141.11
5.34
9.12
IS.IO
28.71
137.10
5.31
9.01
14.88
28.24
134.58
5.28
8.94
14.73
27.91
132.85
5.27
8.89
14.62
27.67
131.58
4.19
6.59
9.98
16.69
56.18
4.11
6.39
9.60
15.98
53.44
4.05
6.26
9.36
15.52
51.71
4.01
6.16
9.20
15.21
50.53
3.98
6.09
9.07
14.98
49.66
3.62
5.41
7.76
12.06
33.20
3.52
5.19
7.39
11.39
31.09
3.45
5.05
7.15
10.97
29.75
3.40
4.95
6.98
10.67
28.83
3.37
4.88
6.85
10.46
28.16
3.29
4.76
6.60
9.78
23.70
3.18
4.53
6.23
9.15
21.92
3.11
4.39
5.99
8.75
20.80
3.05
4.28
5.82
8.47
20.03
3.01
4.21
5.70
8.26
19.46
3.07
4.35
5.89
8.45
18.77
2.96
4.12
5.52
7.85
17.20
2.88
3.97
5.29
7.46
16.21
2.83
3.87
5.12
7.19
15.52
2.78
3.79
4.99
6.99
15.02
8
59.44
238.88
956.66
5981.1
598144
9.37
19.37
39.37
99.37
999.37
5.25
8.85
14.54
27.49
130.62
3.95
6.04
8.98
14.80
49.00
3.34
4.82
6.76
10.29
27.65
2.98
4.15
5.60
8.10
19.03
2.75
3.73
4.90
6.84
14.63
-
9
59.86
240.54
963.28
6022.5
602284
9.38
19.38
39.39
99.39
999.39
5.24
8.81
14.47
27.35
129.86
3.94
6.00
8.90
14.66
48.47
3.32
4.77
6.68
10.16
27.24
2.96
4.10
5.52
7.98
18.69
2.72
3.68
4.82
6.72
14.33
5

1.6 Page 6

▲back to top


l Tables T-13
Table entry for p is the
critical value F• with
probability p lying to
its right.
1•1:iQ:!/1_,
F critical values (continued)
Probability p
F•
Degrees of freedom in the numerator
10
12
15
20
25
30
40
so
60
60.19
241.88
968.63
6055.8
605621
60.71
243.91
976.71
6106.3
610668
61.22
245.95
984.87
6157.3
615764
61.74
248.01
993.10
6208.7
620908
62.05
249.26
998.08
6239.8
624017
62.26
250.10
1001.4
6260.6
626099
62.53
251.14
1005.6
6286.8
628712
62.69
251.77
1008.1
6302.5
630285
62.79
252.20
1009.8
6313.0
631337
9.39
19.40
39.40
99.40
999.40
9.41
19.41
39.41
99.42
999.42
9.42
19.43
39.43
99.43
999.43
9.44
19.45
39.45
99.45
999.45
9.45
19.46
39.46
99.46
999.46
9.46
19.46
39.46
99.47
999.47
9.47
19.47
39.47
99.47
999.47
9.47
19.48
39.48
99.48
999.48
9.47
19.48
39.48
99.48
999.48
5.23
8.79
14.42
27.23
129.25
5.22
8.74
14.34
27.05
128.32
5.20
8.70
14.25
26.87
127.37
5.18
8.66
14.17
26.69
126.42
5.17
8.63
14.12
26.58
125.84
5.17
8.62
14.08
26.50
125.45
5.16
8.59
14.04
26.41
124.96
5.15
8.58
14.01
26.35
124.66
5.15
8.57
13.99
26.32
124.47
3.92
5.96
8.84
14.55
48.05
3.90
5.91
8.75
14.37
47.41
3.87
5.86
8.66
14.20
46.76
3.84
5.80
8.56
14.02
46.10
3.83
5.77
8.50
13.91
45.70
3.82
5.75
8.46
13.84
45.43
3.80
5.72
8.41
13.75
45.09
3.80
5.70
8.38
13.69
44.88
3.79
5.69
8.36
13.65
44.75
3.30
4.74
6.62
10.05
26.92
3.27
4.68
6.52
9.89
26.42
3.24
4.62
6.43
9.72
25.91
3.21
4.56
6.33
9.55
25.39
3.19
4.52
6.27
9.45
25.08
3.17
4.50
6.23
9.38
24.87
3.16
4.46
6.18
9.29
24.60
3.15
4.44
6.14
9.24
24.44
3.14
4.43
6.12
9.20
24.33
2.94
4.06
5.46
7.87
18.41
2.90
4.00
5.37
7.72
17.99
2.87
3.94
5.27
7.56
17.56
2.84
3.87
5.17
7.40
17.12
2.81
3.83
5.11
7.30
16.85
2.80
3.81
5.07
7.23
16.67
2.78
3.77
5.01
7.14
16.44
2.77
3.75
4.98
7.09
16.31
2.76
3.74
4.96
7.06
16.21
2.70
3.64
4.76
6.62
14.08
2.67
3.57
4.67
6.47
13.71
2.63
3.51
4.57
6.31
13.32
2.59
3.44
4.47
6.16
12.93
2.57
3.40
4.40
6.06
12.69
2.56
3.38
4.36
5.99
12.53
2.54
3.34
4.31
5.91
12.33
2.52
3.32
4.28
5.86
12.20
2.51
3.30
4.25
5.82
12.12
6
120
1000
63.06
253.25
1014.0
6339.4
633972
63.30
254.19
1017.7
6362.7
636301
9.48
19.49
39.49
99.49
999.49
9.49
19.49
39.50
99.50
999.50
5.14
8.55
13.95
26.22
123.97
5.13
8.53
13.91
26.14
123.53
3.78
5.66
8.31
13.56
44.40
3.76
5.63
8.26
13.47
44.09
3.12
4.40
6.07
9.11
24.06
3.11
4.37
6.02
9.03
23.82
2.74
3.70
4.90
6.97
15.98
2.72
3.67
4.86
6.89
15.77
2.49
3.27
4.20
5.74
11.91
2.47
3.23
4.15
5.66
11.72
(Continued)

1.7 Page 7

▲back to top


l T-14
Tables
F critical values (continued}
p
.100
.050
8
.025
.010
.001
.100
.050
9
.025
.010
.001
.100
.050
10
.025
.010
.001
.100
.050
......
11
B
C
.025
.010
.001
0
C
.100
-"c
.050
-."5s
e
12
.025
.010
.001
-0c
J""::
0
""f:'!
13
.100
.050
.025
.010
.001
bO
0"
.100
.050
14
.025
.010
.001
.100
.050
15
,025
.010
.001
.100
.050
16
.025
.010
.001
.100
.050
17
,025
.010
.001
1
3.46
5.32
7.57
11.26
25.41
3.36
5.12
7.21
10.56
22.86
3.29
4.96
6.94
10.04
21.04
3.23
4.84
6.72
9.65
19.69
3.18
4.75
6.55
9.33
18.64
3.14
4.67
6.41
9.07
17.82
3.10
4.60
6.30
8.86
17.14
3.07
4.54
6.20
8.68
16.59
3.05
4.49
6.12
8.53
16.12
3.03
4.45
6.04
8.40
15.72
,.
-,..-,-,,-r,
2
3.11
4.46
6.06
8.65
18.49
3.01
4.26
5.71
8.02
16.39
2.92
4.10
5.46
7.56
14.91
2.86
3.98
5.26
7.21
13.81
2.81
3.89
5.10
6.93
12.97
2.76
3.81
4.97
6.70
12.31
2.73
3.74
4.86
6.51
11.78
2.70
3.68
4.77
6.36
11.34
2.67
3.63
4.69
6.23
10.97
2.64
3.59
4.62
6.11
10.66
Degrees of freedom in the numerator
3
4
5
6
2.92
4.07
5.42
7.59
15.83
2.81
3.86
5.08
6.99
13.90
2.73
3.71
4.83
6.55
12.55
2.66
3.59
4.63
6.22
11.56
2.61
3.49
4.47
5.95
10.80
2.56
3.41
4.35
5.74
10.21
2.52
3.34
4.24
5.56
9.73
2.49
3.29
4.15
5.42
9.34
2.46
3.24
4.08
5.29
9.01
2.44
3.20
4.01
5.19
8.73
2.81
3.84
5.05
7.01
14.39
2.69
3.63
4.72
6.42
12.56
2.61
3.48
4.47
5.99
11.28
2.54
3.36
4.28
5.67
10.35
2.48
3.26
4.12
5.41
9.63
2.43
3.18
4.00
5.21
9.07
2.39
3.11
3.89
5.04
8.62
2.36
3.06
3.80
4.89
8.25
2.33
3.01
3.73
4.77
7.94
2.31
2.96
3.66
4.67
7.68
2.73
3.69
4.82
6.63
13.48
2.61
3.48
4.48
6.06
11.71
2.52
3.33
4.24
5.64
10.48
2.45
3.20
4.04
5.32
9.58
2.39
3.11
3.89
5.06
8.89
2.35
3.03
3.77
4.86
8.35
2.31
2.96
3.66
4.69
7.92
2.27
2.90
3.58
4.56
7.57
2.24
2.85
3.50
4.44
7.27
2.22
2.81
3.44
4.34
7.02
2.67
3.58
4.65
6.37
12.86
2.55
3.37
4.32
5.80
11.13
2.46
3.22
4.07
5.39
9.93
2.39
3.09
3.88
5.07
9.05
2.33
3.00
3.73
4.82
8.38
2.28
2.92
3.60
4.62
7.86
2.24
2.85
3.50
4.46
7.44
2.21
2.79
3.41
4.32
7.09
2.18
2.74
3.34
4.20
6.80
2.15
2.70
3.28
4.10
6.56
7
2.62
3.50
4.53
6.18
12.40
2.51
3.29
4.20
5.61
10.70
2.41
3.14
3.95
5.20
9.52
2.34
3.01
3.76
4.89
8.66
2.28
2.91
3.61
4.64
8.00
2.23
2.83
3.48
4.44
7.49
2.19
2.76
3.38
4.28
7.08
2.16
2.71
3.29
4.14
6.74
2.13
2.66
3.22
4.03
6.46
2.10
2.61
3.16
3.93
6.22
7
8
2.59
3.44
4.43
6.03
12.05
2.47
3.23
4.10
5.47
10.37
2.38
3.07
3.85
5.06
9.20
2.30
2.95
3.66
4.74
8.35
2.24
2.85
3.51
4.50
7.71
2.20
2.77
3.39
4.30
7.21
2.15
2.70
3.29
4.14
6.80
2.12
2.64
3.20
4.00
6.47
2.09
2.59
3.12
3.89
6.19
2.06
2.55
3.06
3.79
5.96
9
2.56
3.39
4.36
5.91
11.77
2.44
3.18
4.03
5.35
10.11
2.35
3.02
3.78
4.94
8.96
2.27
2.90
3.59
4.63
8.12
2.21
2.80
3.44
4.39
7.48
2.16
2.71
3.31
4.19
6.98
2.12
2.65
3.21
4.03
6.58
2.09
2.59
3.12
3.89
6.26
2.06
2.54
3.05
3.78
5.98
2.03
2.49
2.98
3.68
5.75

1.8 Page 8

▲back to top


l Tables T-15
••, :t •
..,,-
F critical values (continued)
Degrees of freedom in the numerator
10
12
15
20
25
30
40
so
60
120
1000
2.54
2.50
2.46
2.42
2.40
2.38
2.36
2.35
2.34
2.32
2.30
3.35
3.28
3.22
3.15
3.11
3.08
3.04
3.02
3.01
2.97
2.93
4.30
4.20
4.10
4.00
3.94
3.89
3.84
3.81
3.78
3.73
3.68
5.81
5.67
5.52
5.36
5.26
5.20
5.12
5.07
5.03
4.95
4.87
11.54
11.19
10.84
10.48
10.26
10.11
9.92
9.80
9.73
9.53
9.36
2.42
2.38
2.34
2.30
2.27
2.25
2.23
2.22
2.21
2.18
2.16
3.14
3.07
3.01
2.94
2.89
2.86
2.83
2.80
2.79
2.75
2.71
3.96
3.87
3.77
3.67
3.60
3.56
3.51
3.47
3.45
3.39
3.34
5.26
5.11
4.96
4.81
4.71
4.65
4.57
4.52
4.48
4.40
4.32
9.89
9.57
9.24
8.90
8.69
8.55
8.37
8.26
8.19
8.00
7.84
2.32
2.28
2.24
2.20
2.17
2.16
2.13
2.12
2.11
2.08
2.06
2.98
2.91
2.85
2.77
2.73
2.70
2.66
2.64
2.62
2.58
2.54
3.72
3.62
3.52
3.42
3.35
3.31
3.26
3.22
3.20
3.14
3.09
4.85
4.71
4.56
4.41
4.31
4.25
4.17
4.12
4.08
4.00
3.92
8.75
8.45
8.13
7.80
7.60
7.47
7.30
7.19
7.12
6.94
6.78
2.25
2.21
2.17
2.12
2.10
2.08
2.05
2.04
2.03
2.00
1.98
2.85
2.79
2.72
2.65
2.60
2.57
2.53
2.51
2.49
2.45
2.41
3.53
3.43
3.33
3.23
3.16
3.12
3.06
3.03
3.00
2.94
2.89
4.54
4.40
4.25
4.10
4.01
3.94
3.86
3.81
3.78
3.69
3.61
7.92
7.63
7.32
7.01
6.81
6.68
6.52
6.42
6.35
6.18
6.02
2.19
2.15
2.10
2.06
2.03
2.01
1.99
1.97
1.96
1.93
1.91
2.75
2.69
2.62
2.54
2.50
2.47
2.43
2.40
2.38
2.34
2.30
3.37
3.28
3.18
3.07
3.01
2.96
2.91
2.87
2.85
2.79
2.73
4.30
4.16
4.01
3.86
3.76
3.70
3.62
3.57
3.54
3.45
3.37
7.29
7.00
6.71
6.40
6.22
6.09
5.93
5.83
5.76
5.59
5.44
2.14
2.10
2.05
2.01
1.98
1.96
1.93
1.92
1.90
1.88
1.85
2.67
2.60
2.53
2.46
2.41
2.38
2.34
2.31
2.30
2.25
2.21
3.25
3.15
3.05
2.95
2.88
2.84
2.78
2.74
2.72
2.66
2.60
4.10
3.96
3.82
3.66
3.57
3.51
3.43
3.38
3.34
3.25
3.18
6.80
6.52
6.23
5.93
5.75
5.63
5.47
5.37
5.30
5.14
4.99
2.10
2.05
2.01
1.96
1.93
1.91
1.89
1.87
1.86
1.83
1.80
2.60
2.53
2.46
2.39
2.34
2.31
2.27
2.24
2.22
2.18
2.14
3.15
3.05
2.95
2.84
2.78
2.73
2.67
2.64
2.61
2.55
2.50
3.94
3.80
3.66
3.51
3.41
3.35
3.27
3.22
3.18
3.09
3.02
6.40
6.13
5.85
5.56
5.38
5.25
5.10
5.00
4.94
4.77
4.62
2.06
2.02
1.97
1.92
1.89
1.87
1.85
1.83
1.82
1.79
1.76
2.54
2.48
2.40
2.33
2.28
2.25
2.20
2.18
2.16
2.11
2.07
3.06
2.96
2.86
2.76
2.69
2.64
2.59
2.55
2.52
2.46
2.40
3.80
3.67
3.52
3.37
3.28
3.21
3.13
3.08
3.05
2.96
2.88
6.08
5.81
5.54
5.25
5.07
4.95
4.80
4.70
4.64
4.47
4.33
2.03
1.99
1.94
1.89
1.86
1.84
1.81
1.79
1.78
1.75
1.72
2.49
2.42
2.35
2.28
2.23
2.19
2.15
2.12
2.11
2.06
2.02
2.99
2.89
2.79
2.68
2.61
2.57
2.51
2.47
2.45
2.38
2.32
3.69
3.55
3.41
3.26
3.16
3.10
3.02
2.97
2.93
2.84
2.76
5.81
5.55
5.27
4.99
4.82
4.70
4.54
4.45
4.39
4.23
4.08
2.00
1.96
1.91
1.86
1.83
1.81
1.78
1.76
1.75
1.72
1.69
2.45
2.38
2.31
2.23
2.18
2.15
2.10
2.08
2.06
2.01
1.97
2.92
2.82
2.72
2.62
2.55
2.50
2.44
2.41
2.38
2.32
2.26
3.59
3.46
3.31
3.16
3.07
3.00
2.92
2.87
2.83
2.75
2.66
5.58
5.32
5.05
4.78
4.60
4.48
4.33
4.24
4.18
4.02
3.87
8
(Continued)

1.9 Page 9

▲back to top


l T-16
Tables
~•,~:i
-
F critical values (continued)
Degrees of freedom in the numerator
p
I
2
3
4
5
6
7
8
9
.100
.050
18
.025
.010
.001
3.01
4.41
5.98
8.29
15.38
2.62
2.42
2.29
2.20
2.13
2.08
2.04
2.00
3.55
3.16
2.93
2.77
2.66
2.58
2.51
2.46
4.56
3.95
3.61
3.38
3.22
3.10
3.01
2.93
6.01
5.09
4.58
4.25
4.01
3.84
3.71
3.60
10.39
8.49
7.46
6.81
6.35
6.02
5.76
5.56
.100
2.99
2.61
2.40
2.27
2.18
2.11
2.06
2.02
1.98
.050
4.38
3.52
3.13
2.90
2.74
2.63
2.54
2.48
2.42
19
.025
5.92
4.51
3.90
3.56
3.33
3.17
3.05
2.96
2.88
.010
8.18
5.93
5.01
4.50
4.17
3.94
3.77
3.63
3.52
.001
15.08
10.16
8.28
7.27
6.62
6.18
5.85
5.59
5.39
.100
2.97
.050
4.35
20
.025
5.87
.010
8.10
.001
14.82
2.59
2.38
2.25
2.16
2.09
2.04
2.00
1.96
3.49
3.10
2.87
2.71
2.60
2.51
2.45
2.39
4.46
3.86
3.51
3.29
3.13
3.01
2.91
2.84
5.85
4.94
4.43
4.10
3.87
3.70
3.56
3.46
9.95
8.10
7.10
6.46
6.02
5.69
5.44
5.24
.100
.050
'-
21
.025
.010
i::
.001
0
.i":,: ,
.100
.050
-"5
22
.025
.010
.5
.001
.08,,
l"
0
23
V)
.100
.050
.025
.010
"".bD..
.001
Q"
.100
.050
24
.025
.010
.001
2.96
4.32
5.83
8.02
14.59
2.95
4.30
5.79
7.95
14.38
2.94
4.28
5.75
7.88
14.20
2.93
4.26
5.72
7.82
14.03
2.57
2.36
2.23
2.14
2.08
2.02
1.98
1.95
3.47
3.07
2.84
2.68
2.57
2.49
2.42
2.37
4.42
3.82
3.48
3.25
3.09
2.97
2.87
2.80
5.78
4.87
4.37
4.04
3.81
3.64
3.51
3.40
9.77
7.94
6.95
6.32
5.88
5.56
5.31
5.11
2.56
2.35
2.22
2.13
2.06
2.01
1.97
1.93
3.44
3.05
2.82
2.66
2.55
2.46
2.40
2.34
4.38
3.78
3.44
3.22
3.05
2.93
2.84
2.76
5.72
4.82
4.31
3.99
3.76
3.59
3.45
3.35
9.61
7.80
6.81
6.19
5.76
5.44
5.19
4.99
2.55
2.34
2.21
2.11
2.05
1.99
1.95
1.92
3.42
3.03
2.80
2.64
2.53
2.44
2.37
2.32
4.35
3.75
3.41
3.18
3.02
2.90
2.81
2.73
5.66
4.76
4.26
3.94
3.71
3.54
3.41
3.30
9.47
7.67
6.70
6.08
5.65
5.33
5.09
4.89
2.54
2.33
2.19
2.10
2.04
1.98
1.94
1.91
3.40
3.01
2.78
2.62
2.51
2.42
2.36
2.30
4.32
3.72
3.38
3.15
2.99
2.87
2.78
2.70
5.61
4.72
4.22
3.90
3.67
3.50
3.36
3.26
9.34
7.55
6.59
5.98
5.55
5.23
4.99
4.80
.100
.050
25
.025
.010
.001
2.92
4.24
5.69
7.77
13.88
2.53
2.32
2.18
2.09
2.02
1.97
1.93
1.89
3.39
2.99
2.76
2.60
2.49
2.40
2.34
2.28
4.29
3.69
3.35
3.13
2.97
2.85
2.75
2.68
5.57
4.68
4.18
3.85
3.63
3.46
3.32
3.22
9.22
7.45
6.49
5.89
5.46
5.15
4.91
4.71
.100
2.91
.050
4.23
26
.025
5.66
.010
7.72
.001
13.74
2.52
2.31
2.17
2.08
2.01
1.96
1.92
1.88
3.37
2.98
2.74
2.59
2.47
2.39
2.32
2.27
4.27
3.67
3.33
3.10
2.94
2.82
2.73
2.65
5.53
4.64
4.14
3.82
3.59
3.42
3.29
3.18
9.12
7.36
6.41
5.80
5.38
5.07
4.83
4.64
.JOO
2.90
.050
4.21
27
.025
5.63
.010
7.68
.001
13.61
2.51
2.30
2.17
2.07
2.00
1.95
1.91
1.87
3.35
2.96
2.73
2.57
2.46
2.37
2.31
2.25
4.24
3.65
3.31
3.08
2.92
2.80
2.71
2.63
5.49
4.60
4.1 I
3.78
3.56
3.39
3.26
3.15
9.02
7.27
6.33
5.73
5.31
5.00
4.76
4.57
9

1.10 Page 10

▲back to top


l Tables
T-17
i--lllllllJ,fl:t I
F critical values (continued)
Degrees of freedom in the numerator
10
12
15
20
25
30
40
so
1.98
1.93
1.89
1.84
1.80
1.78
1.75
1.74
2.41
2.34
2.27
2.19
2.14
2.11
2.06
2.04
2.87
2.77
2.67
2.56
2.49
2.44
2.38
2.35
3.51
3.37
3.23
3.08
2.98
2.92
2.84
2.78
5.39
5.13
4.87
4.59
4.42
4.30
4.15
4.06
1.96
1.91
1.86
1.81
1.78
1.76
1.73
1.71
2.38
2.31
2.23
2.16
2.11
2.07
2.03
2.00
2.82
2.72
2.62
2.51
2.44
2.39
2.33
2.30
3.43
3.30
3.15
3.00
2.91
2.84
2.76
2.71
5.22
4.97
4.70
4.43
4.26
4.14
3.99
3.90
1.94
1.89
1.84
1.79
1.76
1.74
1.71
1.69
2.35
2.28
2.20
2.12
2.07
2.04
1.99
J.97
2.77
2.68
2.57
2.46
2.40
2.35
2.29
2.25
3.37
3.23
3.09
2.94
2.84
2.78
2.69
2.64
5.08
4.82
4.56
4.29
4.12
4.00
3.86
3.77
1.92
1.87
1.83
1.78
1.74
1.72
1.69
1.67
2.32
2.25
2.18
2.10
2.05
2.01
J.96
J.94
2.73
2.64
2.53
2.42
2.36
2.31
2.25
2.21
3.31
3.17
3.03
2.88
2.79
2.72
2.64
2.58
4.95
4.70
4.44
4.17
4.00
3.88
3.74
3.64
1.90
1.86
1.81
1.76
1.73
1.70
1.67
1.65
2.30
2.23
2.15
2.07
2.02
J.98
J.94
1.91
2.70
2.60
2.50
2.39
2.32
2.27
2.21
2.17
3.26
3.12
2.98
2.83
2.73
2.67
2.58
2.53
4.83
4.58
4.33
4.06
3.89
3.78
3.63
3.54
1.89
1.84
1.80
1.74
1.71
1.69
1.66
1.64
2.27
2.20
2.13
2.05
2.00
J.96
1.91
1.88
2.67
2.57
2.47
2.36
2.29
2.24
2.18
2.14
3.21
3.07
2.93
2.78
2.69
2.62
2.54
2.48
4.73
4.48
4.23
3.96
3.79
3.68
3.53
3.44
1.88
1.83
1.78
1.73
1.70
1.67
1.64
1.62
2.25
2.18
2.11
2.03
1.97
1.94
1.89
1.86
2.64
2.54
2.44
2.33
2.26
2.21
2.15
2.11
3.17
3.03
2.89
2.74
2.64
2.58
2.49
2.44
4.64
4.39
4.14
3.87
3.71
3.59
3.45
3.36
1.87
1.82
1.77
1.72
1.68
1.66
1.63
1.61
2.24
2.16
2.09
2.01
J.96
1.92
J.87
J.84
2.61
2.51
2.41
2.30
2.23
2.18
2.12
2.08
3.13
2.99
2.85
2.70
2.60
2.54
2.45
2.40
4.56
4.31
4.06
3.79
3.63
3.52
3.37
3.28
1.86
1.81
1.76
1.71
1.67
1.65
1.61
1.59
2.22
2.15
2.07
1.99
1.94
J.90
J.85
J.82
2.59
2.49
2.39
2.28
2.21
2.16
2.09
2.05
3.09
2.96
2.81
2.66
2.57
2.50
2.42
2.36
4.48
4.24
3.99
3.72
3.56
3.44
3.30
3.21
1.85
1.80
1.75
1.70
1.66
1.64
1.60
1.58
2.20
2.13
2.06
1.97
1.92
1.88
1.84
1.81
2.57
2.47
2.36
2.25
2.18
2.13
2.07
2.03
3.06
2.93
2.78
2.63
2.54
2.47
2.38
2.33
4.41
4.17
3.92
3.66
3.49
3.38
3.23
3.14
10
60
1.72
2.02
2.32
2.75
4.00
1.70
1.98
2.27
2.67
3.84
1.68
J.95
2.22
2.61
3.70
1.66
1.92
2.18
2.55
3.58
1.64
J.89
2.14
2.50
3.48
1.62
1.86
2.11
2.45
3.38
1.61
1.84
2.08
2.40
3.29
1.59
1.82
2.05
2.36
3.22
1.58
I.BO
2.03
2.33
3.15
1.57
1.79
2.00
2.29
3.08
120
1000
1.69
1.66
1.97
1.92
2.26
2.20
2.66
2.58
3.84
3.69
1.67
1.64
1.93
1.88
2.20
2.14
2.58
2.50
3.68
3.53
1.64
1.61
J.90
J.85
2.16
2.09
2.52
2.43
3.54
3.40
1.62
1.59
J.87
1.82
2.11
2.05
2.46
2.37
3.42
3.28
1.60
1.57
J.84
J.79
2.08
2.01
2.40
2.32
3.32
3.17
1.59
1.55
1.81
1.76
2.04
1.98
2.35
2.27
3.22
3.08
1.57
1.54
1.79
1.74
2.01
1.94
2.31
2.22
3.14
2.99
1.56
1.52
J.77
1.72
1.98
1.91
2.27
2.18
3.06
2.91
1.54
I.SI
J.75
J.70
1.95
1.89
2.23
2.14
2.99
2.84
1.53
I.SO
1.73
1.68
1.93
1.86
2.20
2.11
2.92
2.78
(Continued)

2 Pages 11-20

▲back to top


2.1 Page 11

▲back to top


Appendix 693
V Operating Characteristic Curves for the Fixed Effects Model Analysis of Variance•
1.00
0.80
0.70
0.60
0.50
V>
'iii
.Qr:)
0.40
0 0.30
.C>r:.
Q) 0.20
-5
a.,Oe>:
Q) 0.10
tJ
tJ
0"'
0.08
O.o7
0.06
0.05
:0
.0"'
0.04
0
,t
0.03
0.02
0.01
1.5
2
2.5
3
3.5 -<I>
(for a= 0.05)
<l>(foru=0.01)-
2
3
4
5
1.00
0.80
0.70
0.60
0.50
V>
'iii
Q)
0.40
.r:
0 0.30
.Cr>:.
Q)
0.20
-5
a..Oe>:
Q) 0.10
tJ
tJ
0"'
0.08
0.07
? 0.06
0.05
e:0
.0"'
0.04
Cl. 0.03
0.02
2
3 -<I>
(for a= 0.05)
<I>(for IX= 0.01)-
1
2
3
4
5
v1 = Numerator degrees of freedom, u2 = Denominator degrees of freedom
'Adapted with permission from !Jio111etrikaTables for Statisticians, Vol. 2, by E. S. Pearson and H. 0. Hanley, Cambridge
University Press, Cambridge, I972.
11

2.2 Page 12

▲back to top


694 Appendix
V Operating Characteristic Curves for the Fixed Effects Model Analysis
of Variance (Continued)
1.00
0.80
0.70
0.60
0.50
·<.I;); 0.40
.Qc)
0 0.30
.Q>c.-
Q) 0.20
-5
Cl
.!::
15.
Q)
0.10
0
0ro 0.08
0 0.07
0.06
0.05
:r.o0 0.04
.0
0
ct 0.03
0.02
2
3 -<I>
(for a= 0.05)
<I>(for a= 0.01)-
1
2
3
4
5
8:~l8t:,..,--~=====t~~~
0.60
-+--~~~~oe""...----+-----+------+------1
0.50
0.40 f--W~~~+---WW~"'<"<~c--"--t------+------+-----1
0
0.08 t------tt-\\tH.+\\+T-\\--\\l
0.07 t-------H;+-\\-\\-'-n--\\-+-l-+-+-'l-'t-\\---ft--\\-'t--\\--'ri------+-----1
>- 0.06 1-------+.,....-+-0,-H-+-+-+--+--+-<,-+--+-~
0.05
ro 0.04 t------~f+-lc-Hr\\-\\-\\-+--++-'r-l-+--ft--+-+-+--+-+--+----+-----1
.0
0
ct
...............-------,....------+------t
2
3 _,1> (for a= 0.05)
<l>(fora=0.01)-1
2
3
4
5
12

2.3 Page 13

▲back to top


Appendix 695
V Operating Characteristic Curves for the Fixed Effects Model Analysis
of Variance (Continued)
1.00
0.80
0.70
0.60
0.50
·";;';
Q)
0.40
-0" 0.30
-C>" . -
Q)
0.20
£
Cl
.!::
0.
Quu)
0""
0.10
0.08
O.D7
0.06
0.05
:0
.0"'
0.04
0
ct 0.03
0.02
2
3 -ct>
(for a= 0.05)
ct>(for a= 0.01)_.
1
2
3
4
5
1.00 ,-------,--------,-------,------,-------,------,
gjgi...:- ..:..-..__-_-_-_-_-++-_-_--_-_-_-_-_-_--,-+""::.,~.;.~,~1-!~-'1,:~,~"~".:-1,.;.",."."1,t~----+-----+-----l
0.60
0.50f->.\\'\\~~""
0.401-'\\W~'<'<'l.'l<--t------t---\\-'\\T''n."ll'\\~'rS,.....,._-+-----+---l
2
3-
ct>(fora=0:05)
cI>(fora=0.01)_.1
2
3
4
13

2.4 Page 14

▲back to top


696 Appendix
V Operating Characteristic Curves for the Fixed Effects Model Analysis
of Variance (Continued)
-0
0.08 l------'l--\\-l.-l-'l-!-\\--\\-\\--1...-\\--,A-,,.L'.,.-,F-CC:..
0.07 1---++H--H--\\--\\--\\-;\\,...g,...,:;.,,,.-F=
-~ 0.06 1----H+-ln\\-'H-'Wb'&--9:==
:;; 0.05 1-----t-'H-\\l++-\\----¼"'--t,..-
.D"' 0.04 1-----+t+--H:-+'&'H--"¼t=
0
a':
0.03 l-----+++t\\1~Wl,,--\\'':;\\!=-=-----tt--\\-H--\\--\\--tl.---\\---\\-\\-+-\\-
2
3 -<I>
(for a= 0.05)
<I>(for a= 0.01)-
1
2
3
4
00..8700 1-c-..-_:_'.'.l_..:_~_-_-_-.+.1.-'!~l..:-~::_..!~-:i'_:.-_-__\\-~_-~_-~_c-_--L+'-~-',t:~-----l--------+----I
0.60
0.50
0.40 1-\\\\W~~~+-----+-\\-\\--\\-.l,A'~YIA---"-.-+-----+---l
2
3 -<I>
(fora= 0.05)
<l>(fora=0.01)-
1
2
3
4
14

2.5 Page 15

▲back to top


l Tables T-11
Table entry for p and C is
the critical value f' with
probability p lying to its
right and probability C lying
between -t• and t*.
1•'1:ill::lilll-
t distribution critical values
df
I
2
3
4
5
6
7
8
9
10
II
12
13
14
15
16
17
18
19
20
21
22
23
24
25
26
27
28
29
30
40
so
60
80
100
1000
.25
1.000
0.816
0.765
0.741
0.727
0.718
0.711
0.706
0.703
0.700
0.697
0.695
0.694
0.692
0.691
0.690
0.689
0.688
0.688
0.687
0.686
0.686
0.685
0.685
0.684
0.684
0.684
0.683
0.683
0.683
0.681
0.679
0.679
0.678
0.677
0.675
0.674
50%
.20
1.376
1.061
0.978
0.941
0.920
0.906
0.896
0.889
0.883
0.879
0.876
0.873
0.870
0.868
0.866
0.865
0.863
0.862
0.861
0.860
0.859
0.858
0.858
0.857
0.856
0.856
0.855
0.855
0.854
0.854
0.851
0.849
0.848
0.846
0.845
0.842
0.841
60%
.IS
1.963
1.386
1.250
1.190
1.156
1.134
I.I 19
1.108
1.100
1.093
1.088
1.083
1.079
1.076
1.074
1.071
1.069
1.067
1.066
1.064
1.063
1.061
1.060
1.059
1.058
1.058
1.057
1.056
1.055
1.055
1.050
1.047
1.045
1.043
1.042
1.037
1.036
70%
.10
3.078
1.886
1.638
1.533
1.476
1.440
1.415
1.397
1.383
1.372
1.363
1.356
1.350
1.345
1.341
1.337
1.333
1.330
1.328
1.325
1.323
1.321
1.319
1.318
1.316
1.315
1.314
1.313
1.311
1.310
1.303
1.299
1.296
1.292
1.290
1.282
1.282
80%
Upper-tail probability p
.OS
.025
.02
.01
6.314
2.920
2.353
2.132
2.015
1.943
1.895
1.860
1.833
1.812
1.796
1.782
1.771
1.761
1.753
1.746
1.740
1.734
1.729
1.725
1.721
1.717
1.714
1.711
1.708
1.706
1.703
1.701
1.699
1.697
1.684
1.676
1.671
1.664
1.660
1.646
1.645
12.71
4.303
3.182
2.776
2.571
2.447
2.365
2.306
2.262
2.228
2.201
2.179
2.160
2.145
2.131
2.120
2.110
2.101
2.093
2.086
2.080
2.074
2.069
2.064
2.060
2.056
2.052
2.048
2.045
2.042
2.021
2.009
2.000
1.990
1.984
1.962
1.960
15.89
4.849
3.482
2.999
2.757
2.612
2.517
2.449
2.398
2.359
2.328
2.303
2.282
2.264
2.249
2.235
2.224
2.214
2.205
2.197
2.189
2.183
2.177
2.172
2.167
2.162
2.158
2.154
2.150
2.147
2.123
2.109
2.099
2.088
2.081
2.056
2.054
31.82
6.965
4.541
3.747
3.365
3.143
2.998
2.896
2.821
2.764
2.718
2.681
2.650
2.624
2.602
2.583
2.567
2.552
2.539
2.528
2.518
2.508
2.500
2.492
2.485
2.479
2.473
2.467
2.462
2.457
2.423
2.403
2.390
2.374
2.364
2.330
2.326
90%
95%
96%
98%
Confidence level C
Probability p
t•
.005
63.66
9.925
5.841
4.604
4.032
3.707
3.499
3.355
3.250
3.169
3.106
3.055
3.012
2.977
2.947
2.921
2.898
2.878
2.861
2.845
2.831
2.819
2.807
2.797
2.787
2.779
2.771
2.763
2.756
2.750
2.704
2.678
2.660
2.639
2.626
2.581
2.576
99%
.0025
127.3
14.09
7.453
5.598
4.773
4.317
4.029
3.833
3.690
3.581
3.497
3.428
3.372
3.326
3.286
3.252
3.222
3.197
3.174
3.153
3.135
3.119
3.104
3.091
3.078
3.067
3.057
3.047
3.038
3.030
2.971
2.937
2.915
2.887
2.871
2.813
2.807
99.5%
.001
318.3
22.33
10.21
7.173
5.893
5.208
4.785
4.501
4.297
4.144
4.025
3.930
3.852
3.787
3.733
3.686
3.646
3.611
3.579
3.552
3.527
3.505
3.485
3.467
3.450
3.435
3.421
3.408
3.396
3.385
3.307
3.261
3.232
3.195
3.174
3.098
3.091
99.8%
.0005
636.6
31.60
12.92
8.610
6.869
5.959
5.408
5.041
4.781
4.587
4.437
4.318
4.221
4.140
4.073
4.015
3.965
3.922
3.883
3.850
3.819
3.792
3.768
3.745
3.725
3.707
3.690
3.674
3.659
3.646
3.551
3.496
3.460
3.416
3.390
3.300
3.291
99.9%
15