


 |
MAS501S - MATHEMATICAL STRUCTURES - 2ND OPP - JULY 2022 |
|
|
1 Page 1 |
▲back to top |
p
NAMIBIA UNIVERSITY
OF SCIENCE AND TECHNOLOGY
FACULTY OF HEALTH, APPLIED SCIENCES AND NATURAL RESOURCES
DEPARTMENT OF MATHEMATICS AND STATISTICS
QUALIFICATION: Bachelor of science ; Bachelor of science in Applied Mathematics and Statistics
QUALIFICATION CODE: 07BSAM; 07BOSC
LEVEL: 5
COURSE CODE: MAS501S
COURSE NAME: MATHEMATICAL STRUCTURES
SESSION: JULY 2022
DURATION: 3 HOURS
PAPER: THEORY
MARKS: 95
SUPPLEMENTARY/SECOND OPPORTUNITY EXAMINATION QUESTION PAPER
EXAMINER
Mr B.E OBABUEKI
MODERATOR:
Prof S.A REJU
INSTRUCTIONS
1. Answer ALL the questions in the booklet provided.
2. Show clearly all the steps used in the calculations where necessary.
3. All written work must be done in blue or black ink and sketches must
be done in pencil.
PERMISSIBLE MATERIALS
1. Non-programmable calculator without a cover.
THIS QUESTION PAPER CONSISTS OF 5 PAGES (excluding this front page)
|
|
2 Page 2 |
▲back to top |
Question 1 (15 marks)
1.1 Determine the sum 3233.32, +2013, +2233.02, +20232.23,
(4)
1.2
Perform the subtraction 52002.22, —35532.234,
(4)
1.3. Whatis FE.8,,—223.4, ?. Give your final answer in base 5.
(7)
Question 2 (23 marks)
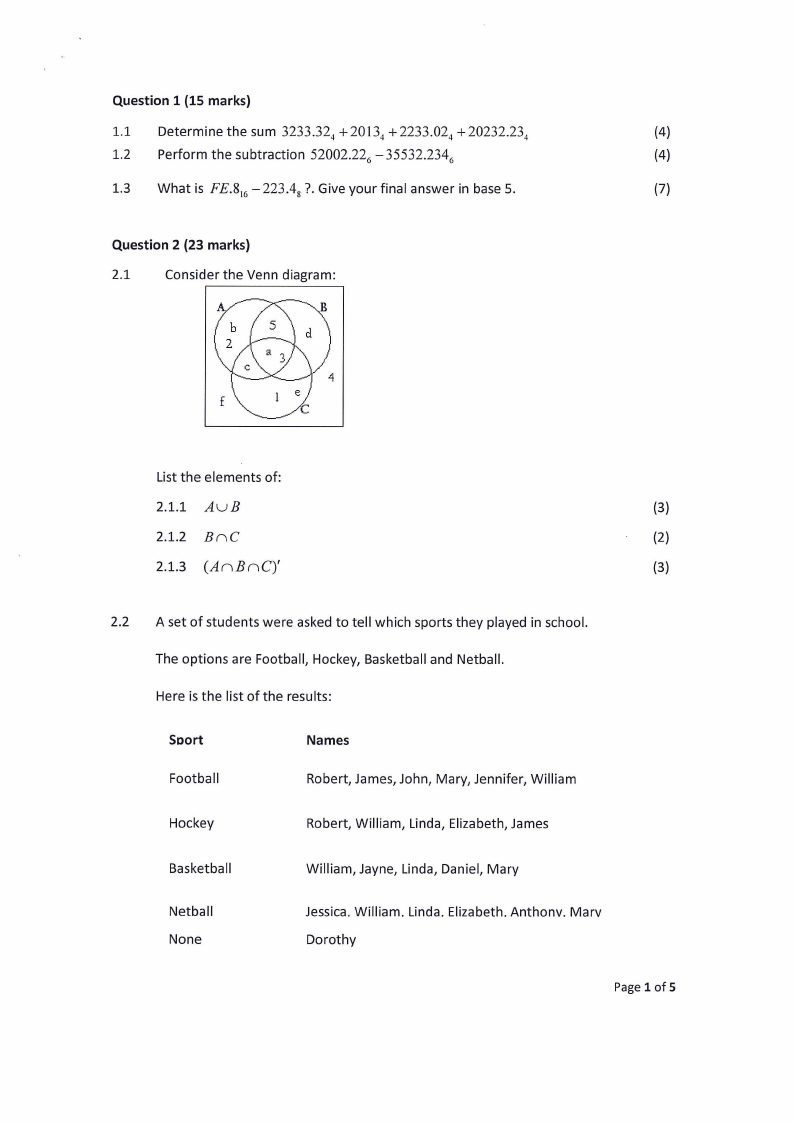
2.1
Consider the Venn diagram:
List the elements of:
2.1.1 AUB
(3)
2.1.2 BOC
(2)
2.1.3 (ANBOCY
(3)
2.2 A set of students were asked to tell which sports they played in school.
The options are Football, Hockey, Basketball and Netball.
Here is the list of the results:
Sport
Football
Names
Robert, James, John, Mary, Jennifer, William
Hockey
Robert, William, Linda, Elizabeth, James
Basketball
Netball
None
William, Jayne, Linda, Daniel, Mary
Jessica. William. Linda. Elizabeth. Anthonv. Marv
Dorothy
Page 1of5
|
|
3 Page 3 |
▲back to top |
Draw a Venn diagram to show the data sets we have. (Use the attached sheet named “Venn
diagram”. Insert this sheet in your answer booklet.)
(9)
https://www.intellspot.com/venn-diagram-examples/
2.3
Given that A and B are subsets of the same universal set, prove that
ANB’ c(A UB).
(6)
Question 3 (11 marks)
3.1
Consider the following statements:
p:
Peter went to school
q:
Queen ate an apple
r:
Russel missed his soccer practice
a:
Agnes cried.
Write the statement Peter went to school and Queen did not eat an apple, because
Russel missed his soccer practice and Agnes did not cry in symbolic logic.
(6)
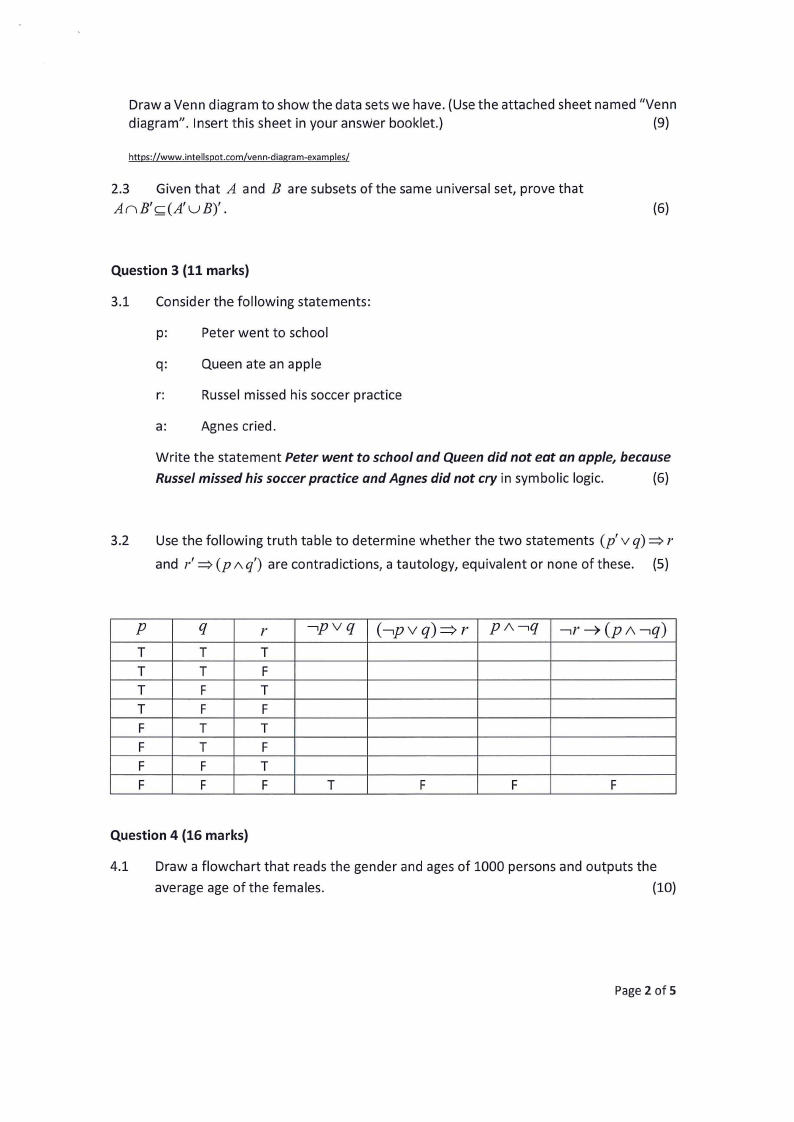
3.2 __ Use the following truth table to determine whether the two statements (p’v q)>r
and r’ >(paq’) are contradictions, a tautology, equivalent or none of these. (5)
q
apVvg
(=pvqg)>r
PA |
ar > (pAa-gq)
T
T
F
F
T
T
F
F
Question 4 (16 marks)
4.1
Draw a flowchart that reads the gender and ages of 1000 persons and outputs the
average age of the females.
(10)
Page 2 of 5
|
|
4 Page 4 |
▲back to top |
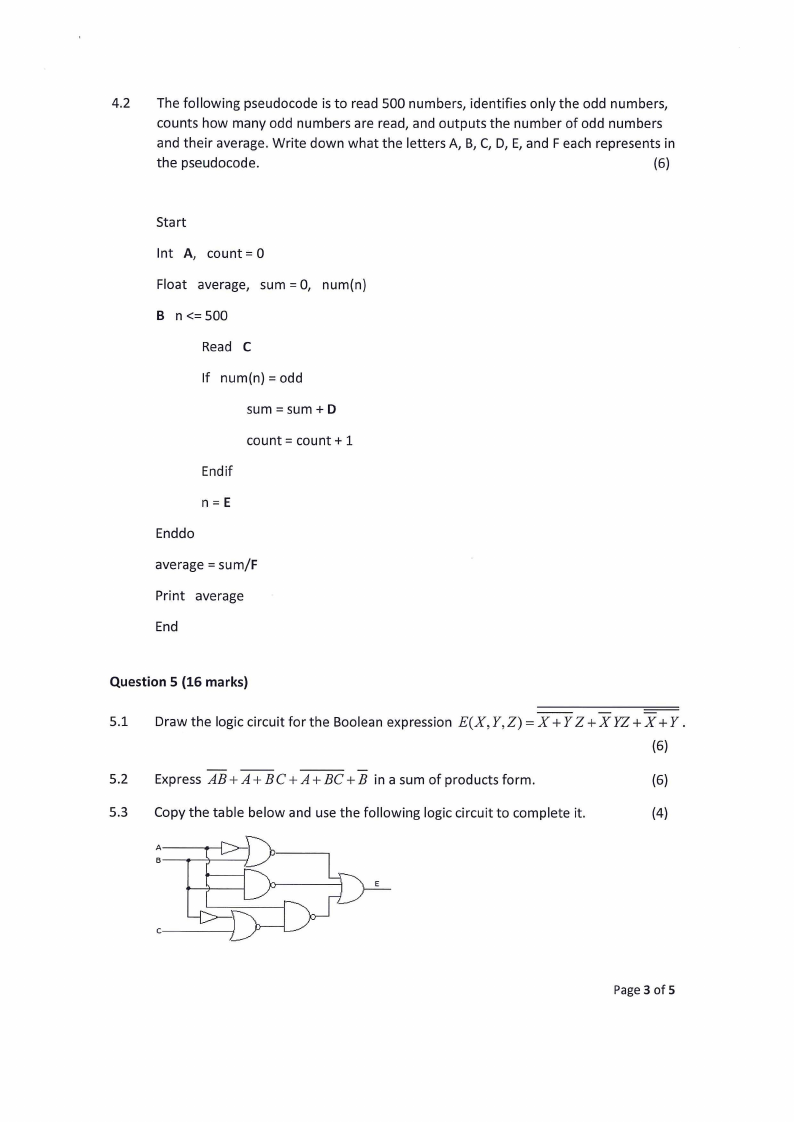
4.2
The following pseudocode is to read 500 numbers, identifies only the odd numbers,
counts how many odd numbers are read, and outputs the number of odd numbers
and their average. Write down what the letters A, B, C, D, E, and F each represents in
the pseudocode.
(6)
Start
Int A, count=0
Float average, sum=0,
num(n)
B n<=500
Read C
If num(n) = odd
sum =sum+D
count = count + 1
Enddo
average = sum/F
Print average
End
Question 5 (16 marks)
5.1
Draw the logic circuit for the Boolean expression E(X,Y,Z) = X+YZ+XYZ+XH+Y.
(6)
5.2
Express AB+A+BC+A+BC+B inasum of products form.
(6)
5.3
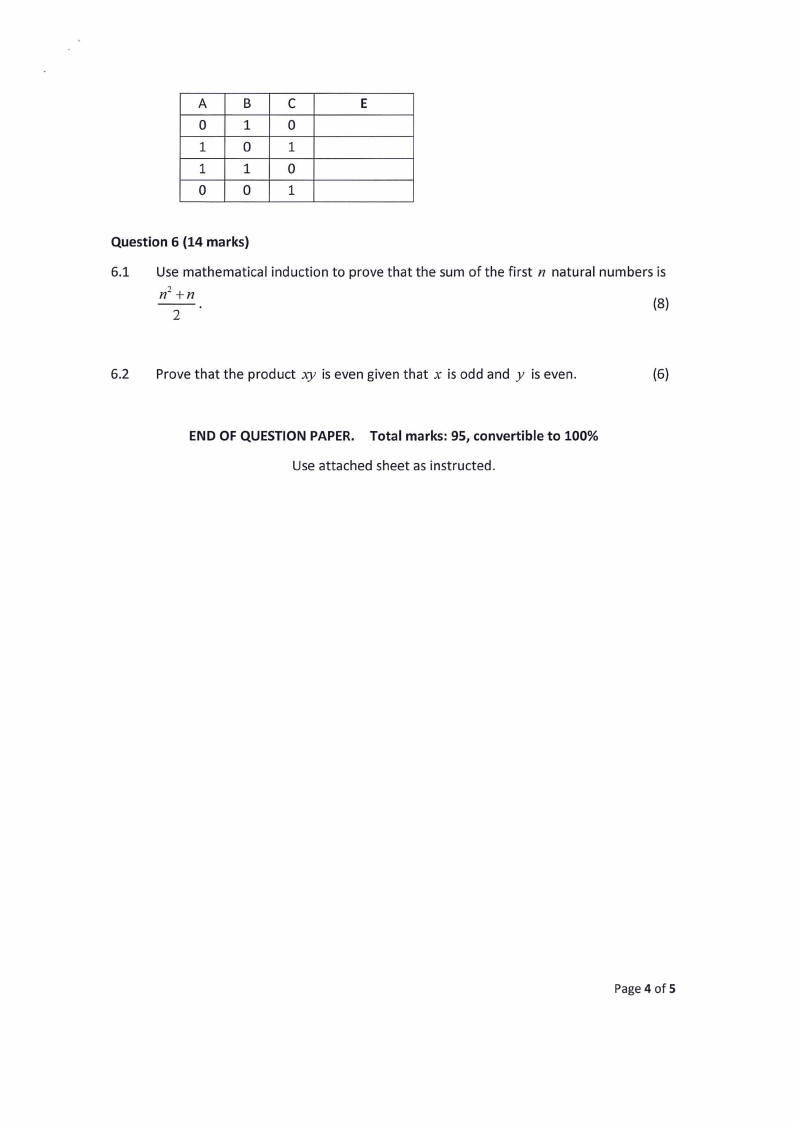
Copy the table below and use the following logic circuit to complete it.
(4)
B
Le
Page 3 of 5
|
|
5 Page 5 |
▲back to top |
Question 6 (14 marks)
6.1
Use mathematical induction to prove that the sum of the first 7 natural numbers is
n 2 +n
2
,
(8)
6.2 Prove that the product xy is even given that x is odd and y is even.
(6)
END OF QUESTION PAPER. Total marks: 95, convertible to 100%
Use attached sheet as instructed.
Page 4of 5
|
|
6 Page 6 |
▲back to top |
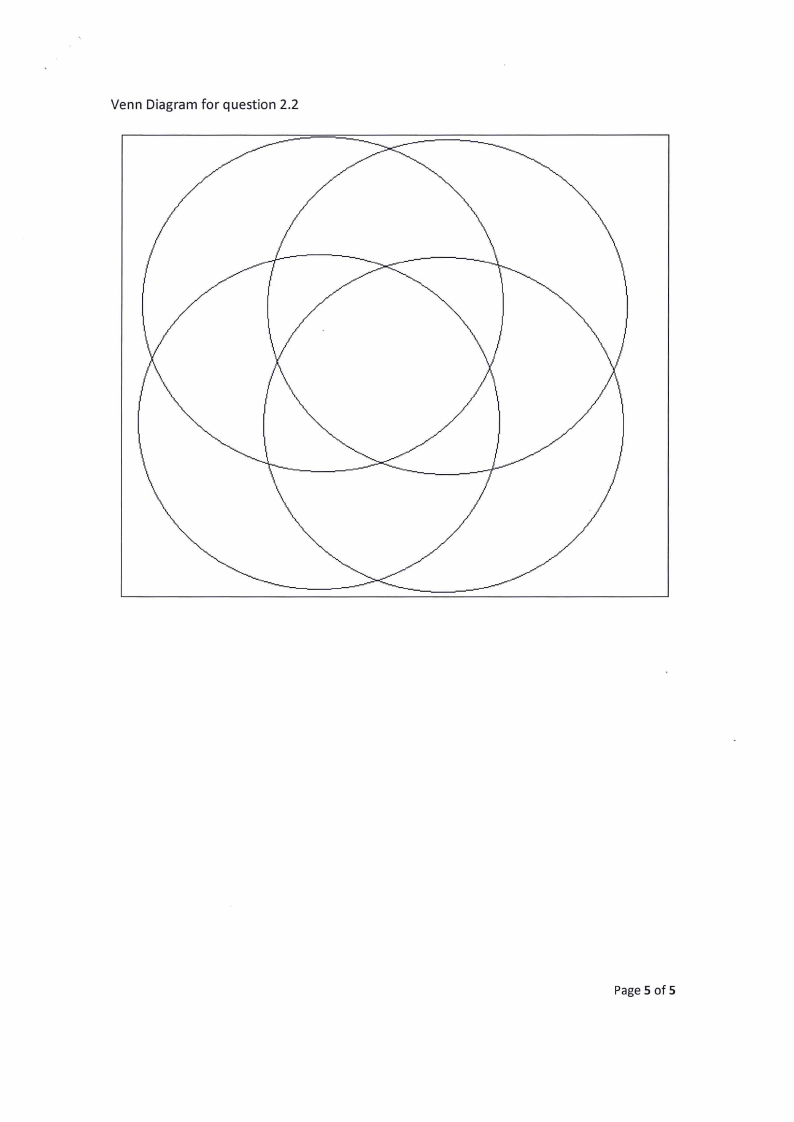
Venn Diagram for question 2.2
Page 5 of 5