DTA621S - DATA ANALYTICS - 1ST OPP - NOV 2022


DTA621S - DATA ANALYTICS - 1ST OPP - NOV 2022


1 Pages 1-10

▲back to top


1.1 Page 1

▲back to top


n Am I B I A u n IVE Rs I TY
OF SCIEnCE Ano TECHnOLOGY
FACULTY OF COMPUTING AND INFORMATICS
DEPARTMENT OF INFORMATICS
QUALIFICATION: BACHELOR OF INFORMATICS, BACHELOR OF COMPUTER SCIENCE
QUALIFICATION CODE: 07BAIT, 07BCMS LEVEL: 6
COURSE: DATA ANALYTICS
COURSE CODE: DTA621S
DATE: NOVEMBER 2022
SESSION: 1
DURATION: 3 HOURS
MARKS: 100
FIRST OPPORTUNITY EXAMINATION QUESTION PAPER
EXAMINER(S) MRS RUUSA IPINGE
MODERATOR: Dr. JACOB ONGALA
THIS QUESTION PAPER CONSISTS OF 8 PAGES
(Including this front page)
INSTRUCTIONS
• Answer ALL questions in Question1, Question2, Question3, Question 4 and Question 5
• NUST examinations rules apply
• DO NOT open this examination cover until you are instructed to do so.
• DO NOT FORGET to write down your student number at the designated places in the
examination page
1

1.2 Page 2

▲back to top


1.3 Page 3

▲back to top


Question1: MULTIPLE QUESTIONS (20 MARKS MAXIMUM 1 MARK FOR EACH
CORRECT ANSWER)
Answer all questions. Select ONLY ONE BEST ASWER to each questions.
1. Who has overall accountability for compliance with the GDPR?
a) Data subject,
b) The Data Controller,
c) Data processor,
d) ICO
2. The process of quantifying data is referred to a
a) Decoding
b) Structure
c) Enumeration
d) Coding
3. Are used when we want to visually examine the relationship between two
quantitative variables.
a. Bar graph
b. Scatterplot
c. Line graph
d. Pie chart
4. A graph that uses vertical bars to represent data is called a __ .
a) Bar graph
b) Line graph
c) Scatterplot
d) All of the mentioned above
s. What is the name given by the GDPR for the deletion of all personal data?
a) The right to be forgotten
b) The right to withdraw consent
c) The right to access
d) The right to objection
2

1.4 Page 4

▲back to top


1.5 Page 5

▲back to top


6. This is the process of removal of noise from the dataset and helping in
knowing the features that are important of to build a machine learning
a) Smoothing
b) Data aggregation
c) Discretization
d) Normalisation
7. This is the type of research that It answers key questions such as "how many,
"how much" and "how often".
a) Quantitative
b) Qualitative
c) Nominal
d) Category
8. This is not an examples of continuous data:
a) The amount of time required to complete a project.
b) The weight of children.
c) The square footage of a two-bedroom house.
d) The number of injections or vaccine you received in your lie
9. Which statements is true about ordinal data
a) You cannot do arithmetic with ordinal numbers because they only show
sequence.
b) Ordinal variables are considered as "in between" qualitative and quantitative
data
c) The ordinal data is qualitative data for which the values are ordered.
d) All of the above
10. To predict a quantity value. use_
a) Regression
b) Clustering
c) Classification
d) Dimensionality reduction
3

1.6 Page 6

▲back to top


1.7 Page 7

▲back to top


11. How do machine learning algorithms make more precise predictions?
a) The algorithms are typically run more powerful servers.
b) The algorithms are better at seeing patterns in the data.
c) Machine learning servers can host larger databases.
d) The algorithms can run on unstructured data
12. What does this image illustrate?
a) A decision tree
b) Reinforcement learning
c) K-nearest neighbour
d) A clear trend line
13. When must high risk data security breaches be reported to the ICO?
a) Within 24 hours
b) Within 72 hours
c) Within 36 hours
d) A week
14. Once the GDPR takes effect, serious breaches could result in fines of what
percentage of the company's global annual turnover?
a) 20 %,
b) 10%,
c) 2%
d) 4%
4

1.8 Page 8

▲back to top


1.9 Page 9

▲back to top


15. In this method, the representation of the data is made smaller by reducing the
volume
a) Numerosity Reduction
b) Dimensionality reduction
c) Data compression
d) Data reduction
16. This is created by placing the sequence inside the square brackets
a) List
b) String
c) Dictionary
d) Tuples
17. Which one is not true about Standard Deviation
a) Most commonly used measure of variation
b) Shows variation about the mean
c) Can be used to compare two or more sets of data measured in different units
d) Is the square root of the variance?
18. You want to identify global weather patterns that may have been affected by
climate change. To do so, you want to use machine learning algorithms to find
patterns that would otherwise be imperceptible to a human meteorologist.
What is the place to start?
a) Find labelled data of sunny days so that the machine will learn to identify bad
weather.
b) Use unsupervised learning have the machine look for anomalies in a massive
weather database.
c) Create a training set of unusual patterns and ask the machine learning
algorithms to classify them.
d) Create a training set of normal weather and have the machine look for similar
patterns.
5

1.10 Page 10

▲back to top


2 Pages 11-20

▲back to top


2.1 Page 11

▲back to top


19. Why is naive Bayes called naive?
a) It naively assumes that you will have no data.
b) It does not even try to create accurate predictions.
c) It naively assumes that the predictors are independent from one another.
d) It naively assumes that all the predictors depend on one another.
20. What is one reason not to use the same data for both your training set and
your testing set?
a. You will almost certainly underfit the model.
b. You will pick the wrong algorithm.
c. You might not have enough data for both.
d. You will almost certainly overfitt the model.
6

2.2 Page 12

▲back to top


2.3 Page 13

▲back to top


Question 2
[10 Marks]
Look at the following boxplots about Liina's performance in physics and chemistry and answer
the following questions.
--rn
--------<[I]--
0 10 20 30 40 50 60 70
Physics
Chen1istry
80 90 100 Scale
(a) State the median mark for each subject.
(2)
(b) Find the range of marks in each subject.
(2)
(c) Calculate the interquartile for Physics.
(3)
(d) What are the three benefits of using a box plot during data cleaning in a normal distribution
data?
(3)
Question 3
[32 Marks]
a) What does Skewed and Symmetric distribution on a data set means
(4)
b) List and explain the methods of data transformation.
(8)
c) Pre-processing of data is mainly to check the data quality. Explain 5 of the elements of
pre-processing
(10)
d) Using Examples, explain the process of Data Science
(10)
Question 4
[18 Marks]
a) What is Overfitting, and How can you avoid It?
(4)
b) What is the difference between Supervised and Unsupervised Machine Learning? (4)
c) What is Bias and Variance in a Machine Learning Model
(4)
d) Name 6 key pieces of information to be contained in privacy notices based on the
GDPR (6)
7

2.4 Page 14

▲back to top


2.5 Page 15

▲back to top


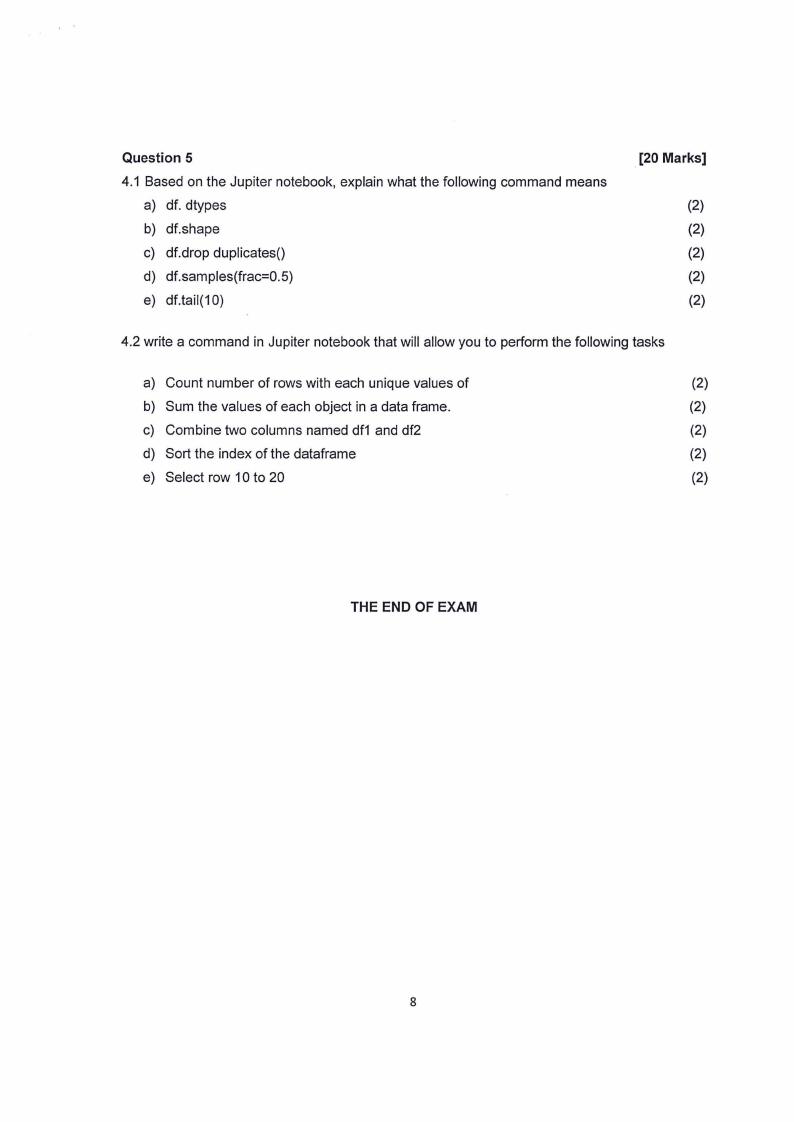
Question 5
4.1 Based on the Jupiter notebook, explain what the following command means
a) df. dtypes
b) df.shape
c) df.drop duplicates()
d) df.samples(frac=0.5)
e) df.tail(10)
[20 Marks)
(2)
(2)
(2)
(2)
(2)
4.2 write a command in Jupiter notebook that will allow you to perform the following tasks
a) Count number of rows with each unique values of
(2)
b) Sum the values of each object in a data frame.
(2)
c) Combine two columns named df1 and df2
(2)
d) Sort the index of the dataframe
(2)
e) Select row 10 to 20
(2)
THE END OF EXAM
8

2.6 Page 16

▲back to top