SFE611S - STATISTICS FOR ECONOMISTS - 1ST OPP - JUNE 2022


SFE611S - STATISTICS FOR ECONOMISTS - 1ST OPP - JUNE 2022


1 Pages 1-10

▲back to top


1.1 Page 1

▲back to top


FACULTY
NAMIBIA UNIVERSITY
OF SCIENCE AND TECHNOLOGY
OF HEALTH, APPLIED SCIENCES AND NATURAL
DEPARTMENT OF MATHEMATICS AND STATISTICS
RESOURCES
QUALIFICATION: BACHELOR OF ECONOMICS
QUALIFICATION CODE: 07BECO
COURSE CODE: SFE611S
LEVEL: 5
COURSE NAME: STATISTICS FOR ECONOMIST
SESSION: JUNE 2022
DURATION: 3 Hrs
PAPER: THEORY
MARKS: 100
EXAMINER
FIRST OPPORTUNITY EXAMINATION QUESTION PAPER
Mr J. Amunyela
MODERATOR:
Mr A.Roux
INSTRUCTIONS
1. Answer ALL the questions in the booklet provided.
2. Show clearly all the steps used in the calculations (SECTION B).
3. All written work must be done in blue or black ink and sketches must
be done in pencil.
ATTACHMENT: T-Table, Z-Tables, Chi-square
PERMISSIBLE MATERIALS
1. Non-programmable calculator without a cover.
THIS QUESTION PAPER CONSISTS OF 7 PAGES (Including this front page)

1.2 Page 2

▲back to top


SECTION A
QUESTION 1 [2 MARKS EACH = 12]
(Write down the question number and the letter corresponding to your best option)
La
The following are all possible applications of statistics except:
A. Statistics are useful in planning and making decision regarding production.
B. Helps the business in the formulation of policies and strategy regarding to
business
C. Used by insurance companies, bankers, stock exchange brokers.
D. Used to solve problems relating to poverty, unemployment and so on.
E. Helps collect data from the population to make inference about the sample.
1.2
is a process of using data obtained from a sample to make
estimates and test hypotheses about the characteristics of a population
A. Sampling statistics
B. Descriptive statistics
C. Sample survey
D. Inferential statistics
E. Simple random sampling
1.3
Sampling in research may be defined as:
A. Assurance that each person in the population has a chance of being included in
the study
B. Establishment of criteria for eligibility to participate in a study
C. Identification of the population in which the researcher is interested
D. Selection of subset of a population to represent the whole population
E. None of the above

1.3 Page 3

▲back to top


1.4
Employee’s monthly income (in NS) is a
A. Continuous
B. Discrete
C. Nominal
D. Ordinal
E. Secondary
variable
1.5
Which one of the following statements is not true about the mean?
A. It is the best measure of central tendency when data is not skewed.
B. Ina symmetric distribution, the mean, the median and the mode are all equal.
C. It is not affected by extreme values or outliers.
D. It utilizes all values in its calculation.
E. The value of the mean times the number of observations equals the sum of all
observations
1.6
Which of the following is not a methods of primary data collection
A. Direct observation
B. Experiments
C. Focus group discussion
D. Key informant interview
E. Government agencies
SECTION B
(Attempt all questions and show all your working)
QUESTION 2 [14 MARKS]
2.1
Define the following terminologies as they are applied in statistics
(1)
Collectively Exhaustive events
[1]
(ii)
Mutual exclusive events
[1]
(iii) Census
[1]
(iv)
Parameter
[1]
(v)
Descriptive Statistics
[1]

1.4 Page 4

▲back to top


2.2
Consider the following table which represents the distribution of annual income (NS
000) of 144 employees of a company.
Annual
Income(NSO000)
130-139
140-149
150-159
160-169
170-179
Total
Frequency
19
22
42
35
26
144
2.2.1 Estimate the average annual income for employees in the company
[3]
2.2.2 Estimate the median annual income for employees in the company
[3]
2.2.3. Estimate the modal annual income for employees in the company
[3]
QUESTION 3 [27 MARKS]
3.1 Suppose we are asking a group of 115 people what their favorite game and snack is
(from the given options). After the data were collected, the contingency table was
presented as follow:
ae
te and
Cookies
Totals
Poker
10
3
Trivial Pursuit
8
14
Monopoly
i4
17
Wii Bowling
12
7
Totals
44
41
If a person is chosen at random:
12
25
7
29
7
38
4
23
30
115

1.5 Page 5

▲back to top


Sedod. What is the probability that he/she is a Poker?
[3]
3.1.2 What is the probability that he/she is a Poker or prefer Pizza Rolls?
[3]
3.1.3 What is the probability that he/she is a Trvial Pusuit and prefer Cookies?
[3]
3.1.4 Are the event of liking Monopoly game and liking Cookies independent?
[3]
3.1.5 What is the probability that he/she prefer Wii Bowling given that he/she likes Pizza
Rolls?
[3]
3.2 Suppose that we are concerned with the completion of a highway construction job,
which may be delayed because of a strike. Suppose, furthermore, that the
probabilities are 0.55 that there will be a strike, 0.85 that the job will be completed
on time if there is no strike, and 0.35 that the job will be completed on time if there
is a strike.
3.2.1 What is the probability that the job will be completed on time
[4]
3.2.2 What is the probability that the job will be completed on time if there is no
Strike
[3]
3.3 A player tosses a fair die. If a prime number appears, he wins that number of dollars;
but if a nonprime number appears, he loses that number of dollars. If the player’s
gain is denoted by the random variable X, then the probability distribution of this
game is as follow:
XPm | 2 Yel 3 Ye | 5 Vel 4 “el [4 “el [46Ve
3.3.1 Determine the expected value for the player’s gain
[3]
3.3.2 Is this game fair?
[2]
QUESTION 4 [26 MARKS]
4.1
Patients arrive at hospital accident and emergency department at a rate of 6 per
hours.
4.1.1 Find the probability that, during anyone-hour period, the number of patients arriving
at the hospital accident and emergency department is exactly 5.
[3]

1.6 Page 6

▲back to top


4.1.2 Find the probability that, during any 90-minute period, the number of patients
arriving at the hospital accident and emergency department is at most 2.
[4]
4.2
An unbiased coin is tossed 8 times, what will be the probability of obtaining:
4.2.1 less than 2 heads?
[4]
4.2.2 exactly one head?
[2]
4.2.3 at least 7 heads?
[4]
4.3
Let X be a random variable with PDF given by
feo x)=
K(x°+1)
0
1lsx<4
otherwise
4.3.1 Find the constant k for which the function f (x) would be a valid probability density
function
[3]
4.3.2 Find the expected value ofX
[3]
4.4
Suppose X and Y have a discrete joint distribution below:
Y
0
1
2
3
0) 0
1 /30 2 /30 | 3 ~/30
1) 1 1/39 | 2 2/30 | 3/30 | 4 4/30
2} 2 “/39 | 3 °/30 | 4 “/30 | 5 ?/30
Find
4.4.1 The expected value of X
[3]

1.7 Page 7

▲back to top


QUESTION 5 [21 MARKS]
5.1 A machine which manufactures black polythene dustbin bags is known to produce
more than 3% defective bags. Following a major breakdown of the machine,
extensive repair work is carried out which may result in a change in the percentage
of defective bags produced. To investigate this possibility, a random sample of 200
bags is taken from the machine's production and a count reveals 12 defective bags.
5.1.1 Can it be concluded from this sample at 5% significance level that the percentage of
defective bags produced is more than 3%?
[8]
5.2 A random sample of 18 NUST students was sampled. Each student was asked how
many minutes of sports he/she watched on television daily. The responses are listed
below. It is known that
50, 48, 65, 74, 66, 37, 45, 68, 64, 65, 58, 55
52, 63, 59, 57, 74, 65,
5.2.1 Test to determine at 5% significance level whether there is enough statistical
evidence to infer that the mean amount of time taken watching television daily is
less than 60 minutes.
[8]
5.3 A dairy processing company claims that the variance of the amount of fat in the
whole milk processed by the company is more than 0.25. You suspect that this is
wrong and find that a random sample of 25 milk containers has a variance of 0.27. At
5% level of significance, is there enough evidence to reject the company’s claim?
Assume that the population is normally distributed.
a)
State the hypothesis that you would use to test the company’s claim.
[2]
b)
Identify the correct test statistic and calculate it for this test.
[3]
END OF EXAMINATION QUESTION PAPER

1.8 Page 8

▲back to top


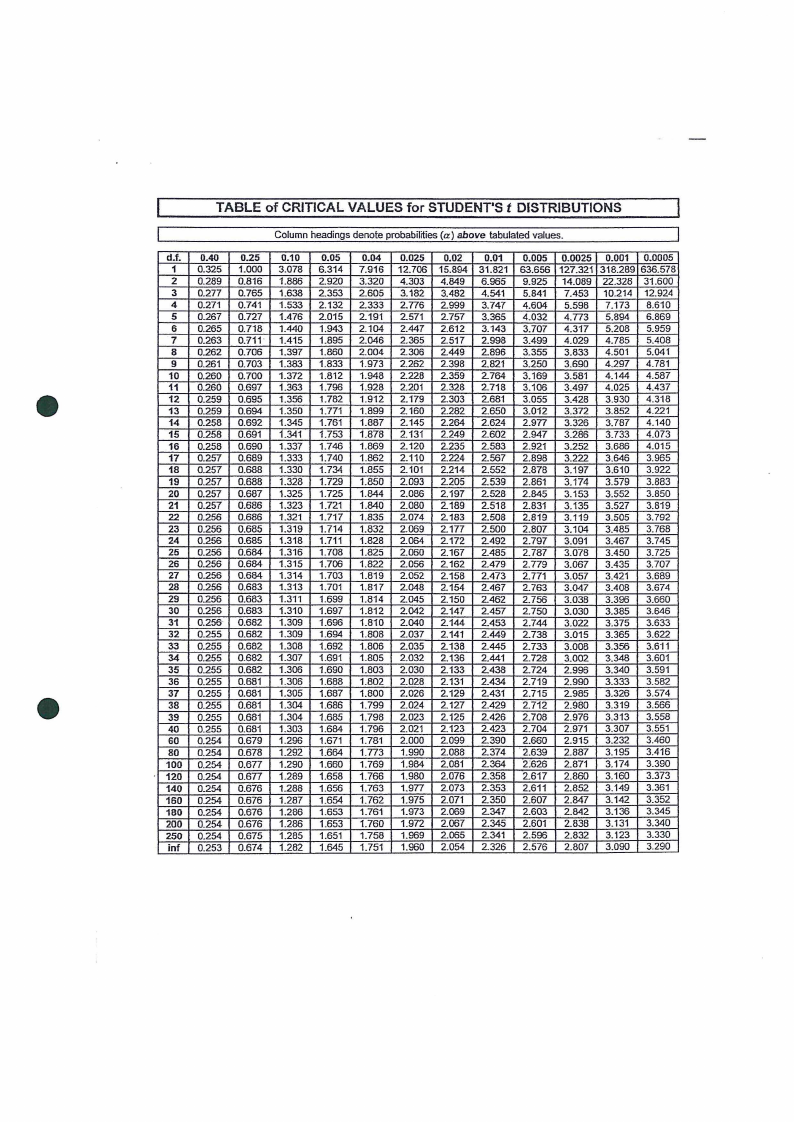
TABLE of CRITICAL VALUES for STUDENT'S f DISTRIBUTIONS
Column headings denote probabilities (2) above tabulated values.
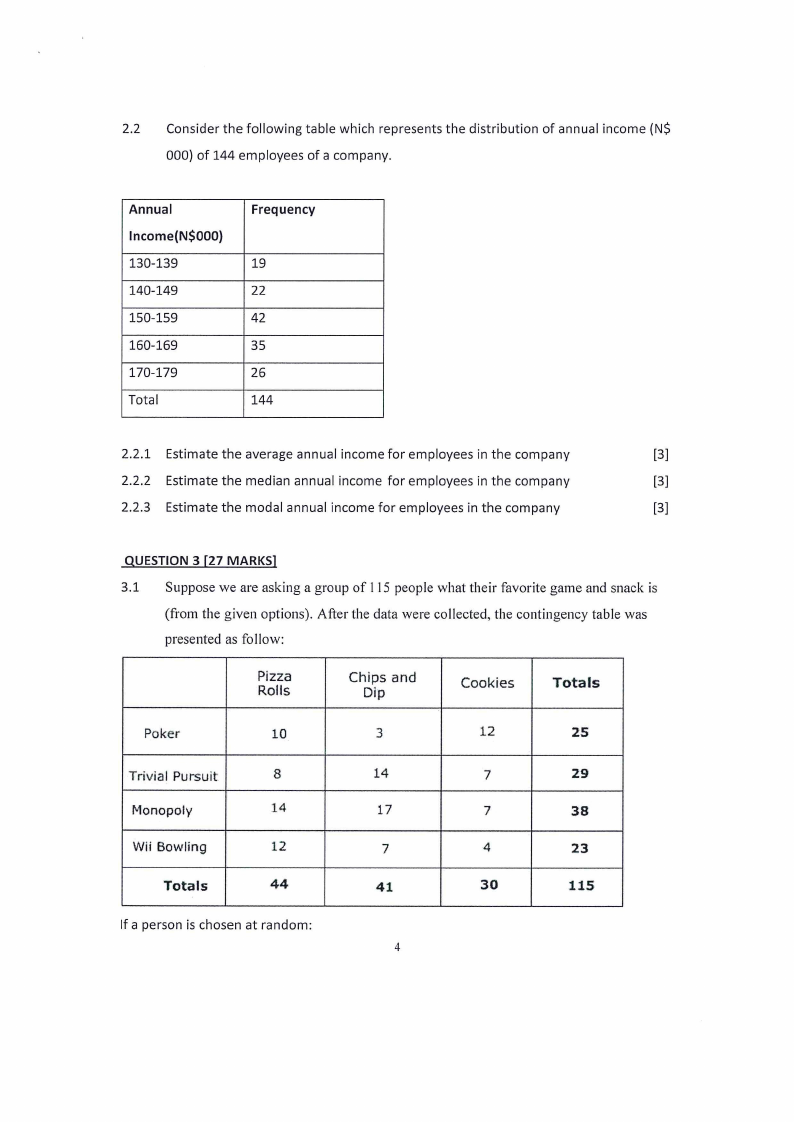
|
df.
1
2
3
4
5
6
t
8
9
10 |
41
12 |
413 |
14 }
15 {|
46 |
417 |
18 |
49 |
20 |
21
22 |
23 |
24 |
25 |
26 |
27 |
28 |
29 |
30 |
34 |
32 {|
33 |
34 |
35 {
36}
37 |
38 |
39 |
40 |
60 |
86 |
100 |
120 |
140 |
160 |
180 |
200 |
250 |
inf |
0.40
0.325 |
0.289 |
0.277 |
0.271 |
0.267 |
0.265 |
0.263 |
0.262 |
0.261 |
0.260 }
0.260 |
0.259 {|
0259 }
0.258 |
0.258 |
0.258 |
0.257 |
0.257 |
0.257 |
0.257 |
0.257 |
0.256 |
0.256 |
0.256 |
0.256 |
0.256 |
0.256 |
0.256 |
0.256 |
0.256 |
0.256 |
0.255 |
0.255 |
0.255 |
0.255 |
0.255 |
0.255 |
0.255 |
0.255 |
0.255 |
0.254 |
0.254 |
0.254 |
0.254 |
0.254 |
0.254 |
0.254 |
0.254 |
0.254 |
0.253 [
0.25
1.000 |
0.816 |
0.765 |
0.741 |
0.727 |
0.718 |
0.711}
0.706 |
0.703 |
0.700 |
0.697 |
0695 |
0.694 |
0.692 |
0.691 |
0.690 |
0.689 |
0.688 |
0.688 |
0.687 |
0.686 |
0.686 {|
0.685 |
0.685 |
0.684 {
0.684 |
0.684 |
0.683 |
0.683 |
0.683 |
0.682 |
0.682 |
0.682 |
0.682 |
0.682 |
0.681 |
0.681 |
0.681 |
0.681 |
0.684 |
0.679 |
0.678 |
0.677 |
0.677 |
0.676 |
0.676 }
0.676 |
0.676 |
0.675 |
0.674 |
0.10
3.078 |
1.886 |
1.638 |
1.533 |
1.476 |
1.440 |
1.415 |
1.397 |
1.383 |
1.372 |
1.363 |
1.356 {
1.350 |
1.345 |
1.341 |
1.337 |
1.333 |
1.330 |
1.328 |
1.325 |
1.323 |
1.321 {|
1.319 |
1.318 |
1.316 |
1.315 |
1.314 |
1.313 |
1.311 |
1.310 |
1.309 |
1.309 |
1.308 |
1.307 |
1.306 |
1.306 |
1.305 |
1.304 |
1.304 |
1.303 |
1.296 |
1.292 |
1.290 |
1.289 |}
1.288 |
1.287 |
1.286 |
1.286 |
1.285 |
1.282 |
0.05
6.314 |
2.920 |
2.353 |
2.132 |
2.015 |
1.943 |
1.895 |
1.860 |
1.833 |
1.812 |
1.796 |
1.782 |
1.771 }
1.761 |
1.753 |
1.746 |
1.740 |
1.734 |
1.729 |
1.725 |
1.721 |
1.717 |
1.714 |
1.711 |
1.708 |
1.706 |
1.703 |
1.701 |
1699 |
1.697 |
1.696 |
1.694 |
1.692 |
1.691 |
1.690 |
1.688 |
1.687 |
1.686 |
1.685 |
1.684 }
1.671 {|
1.664 |
1.660 |
1.658 |
1.656 |
1.654 |
1.653 |
1.653 |
1.651 |
1.645 |
0.04
7.916 |
3.320 |
2.605 |
2.333 |
2.191 |
2.104 |
2.046 |
2.004 |
1.973 |
1.948 |
1.928 |
1.912 |
1.899 |
1.887 |
1.878 |
1.869 |
1.862 |
1.855 |
1.850 |
1.844 |
1.840 |
1.835 |
1.8632 |
1.828 |
1.825 |
1.822 |
1.819 |
1.817 |
1.814 |
1.812 |
1.810 |
1.808 |
1.806 |
1.805 |
1.803 |
1.802 |
1.800 |
1.799 |
1.798 |
1.796 |
1.781 |
1.773 |
1.769 |
1.766 |
1.763 |
1.762 |
1.761 |
1.760 |
1.758 |
1.751 |
0.025
0.02
0.01
0.005 | 0.0025} 0.001 | 0.0005
12.706 | 15.894 | 31.821 | 63.656 | 127.321] 318.289} 636.578
4.303 | 4.849 | 6.965 | 9.925 | 14.089 | 22.328 | 31.600
3.182 | 3.482 | 4.541 | 5.841 | 7.453 | 10.214 | 12.924
2.776 | 2.999 | 3.747 | 4.604 | 5.598 | 7.173 | 8.610
2.571 | 2.757 | 3.365 | 4.032 | 4.773 | 5.894 | 6.869
2447 | 2612 | 3.143 | 3.707 | 4.317 | 5.208 | 5.959
2.365 | 2517 | 2.998 | 3.499 | 4.029 | 4.785 }| 5.408
2.306 | 2.449 | 2.896 | 3.355 | 3.833 | 4.501 | 5.041
2.262 | 2.398 | 2.821 | 3.250 | 3.690 | 4.297 | 4.781
2.228 | 2.359 | 2.764 } 3.169 | 3.581 | 4.144 }| 4.587
2.201 | 2328 | 2.718 {| 3.106 | 3.497 | 4.025 | 4.437
2.179 | 2303 | 2.681 | 3.055 | 3.428 | 3.930 | 4.318
2.160 | 2.282 | 2650 | 3.012 | 3.372 | 3.852 | 4.221
2.145 | 2.264 | 2624 | 2.977 | 3.326 | 3.787 | 4.140
2.131 | 2.249 | 2602 | 2.947 | 3.286 | 3.733 | 4.073
2.120 | 2.235 | 2.583 | 2.921 | 3.252 | 3.686 | 4.015
2.110 | 2.224 | 2567 | 2.898 | 3.222 | 3.646 | 3.965
2.101 | 2.214 | 2.552 | 2.878 | 3.197 | 3.610 | 3.922
2.093 | 2205 | 2.539 | 2.861 | 3.174 | 3.579 | 3.883
2.086 | 2.197 | 2.528 | 2.845 | 3.153 | 3.552 | 3.850
2.080 | 2189 | 2.518 | 2.831 | 3.135 | 3.527 | 3.819
2.074 {| 2183 | 2.508 | 2.819 | 3.119 | 3.505 | 3.792
2069 } 2.177 | 2.500 | 2.807 | 3.104 | 3.485 | 3.768
2.064 | 2172 | 2.492 | 2.797 | 3.091 | 3.467 | 3.745
2.060 | 2.167 | 2.485 | 2.787 | 3.078 | 3.450 | 3.725
2.056 | 2162 | 2.479 | 2.779 | 3.067 | 3.435 | 3.707
2.052 | 2158 | 2.473 | 2.771 | 3.057 | 3.421 | 3.689
2.048 | 2.154 | 2.467 | 2.763 | 3.047 | 3.408 | 3.674
2045 | 2.150 | 2.462 | 2.756 | 3.038 | 3.396 | 3.660
2.042 | 2147 | 2.457 | 2.750 | 3.030 | 3.385 | 3.646
2.040 | 2.144 | 2.453 | 2.744 | 3.022 | 3.375 | 3.633
2.037 | 2.141 | 2.449 | 2.738 | 3.015 | 3.365 | 3.622
2.035 | 2138 | 2.445 | 2.733 | 3.008 | 3.356 | 3.611
2.032 | 2.136 | 2.441 | 2.728 | 3.002 | 3.348 | 3.601
2.030 | 2133 | 2.438 | 2.724 | 2.996 | 3.340 | 3.591
2.028 | 2131 | 2.434 | 2.719 | 2.990 | 3.333 | 3.582
2.026 | 2.129 | 2.431 | 2.715 | 2.985 | 3.326 | 3.574
2.024 | 2.127 | 2429 {| 2.712 | 2.980 | 3.319 | 3.566
2.023 | 2.125 | 2.426 { 2.708 | 2.976 | 3.313 | 3.558
2.021 | 2123 | 2423 | 2.704 | 2.971 | 3.307 | 3.551
2.000 | 2099 | 2390 | 2.660 | 2915 | 3.232 | 3.460
1.990 | 2.088 | 2.374 | 2.639 | 2.887 | 3.195 | 3.416
1.984 | 2.081 | 2.364 | 2626 | 2.871 | 3.174 | 3.390
1.980 | 2.076 | 2.358 | 2617 | 2.860 | 3.160 | 3.373
1.977 | 2.073 | 2.353 | 2.611 | 2.852 | 3.149 | 3.361
1.975 | 2.071 | 2.350 | 2.607 } 2.847 | 3.142 | 3.352
1.973 | 2.069 | 2347 | 2603 | 2.842 | 3.136 | 3.345
1.972 | 2.067 | 2.345 | 2.601 | 2.838 | 3.131 | 3.340
1.969 | 2.065 | 2341 | 2.596 | 2.832 | 3.123 | 3.330
1.960 | 2.054 | 2326 | 2.576 | 2.807 | 3.090 | 3.290

1.9 Page 9

▲back to top


APPENDIX E: The Chi-Square Distribution
faStSp;, 995 : | 990 975 950 i| 900 | 750 | 500, T 250 :| 100 p| re05r0eset| 025 |7 010 a| .005
[1 fo.co00s {0.00016 {0.00098 (0.00393 0.01579 [0.10153 | 0.45494 1.32330 |2.70554 {3.84146 5.02389 (6.63490 [7.87944
| 2 [0.01003 [0.02010 ‘0.05064 -0.10259 10.21072 [0.57536 {1.38629 | 2.77259
3 [0.07172 [0.11483 [0.21580 |0.35185 [0.58437 {1.21253 {236597 | 4.10834
99146 1737776 {9.21034 |10.5963.
) 781473 {9.34840 [1134487 [1283816 |
F 4 [0.20699 [0.29711 {0.48442 ,0.71072 /1.06362 {1.92256 {3.35669 {5.38527 | 7.77944 9.48773 | 11., 113.2746703| 214.896026 |
| 5 10.4174 [0.55430 (0.83121 :1.14548 1.61031 2.67460 [4.35146 $6.62568 19.23636 | 11.07050| 12.83| 125.5080627 eee
(0.67573 [0.87209 1.23734 1.63538 2.20413 (345160 5.34812 7.84080|
,
,
“T2B3311 (4.25485 | 6.34581 [903713 | 1201704| 4.06714 | 16.01276 |18.47531 | 027774|
{2.73264 3.48954 [5.07064 {7.34412 | 10.2|1183.8365157 |15.50731 | 17.53455 | 20.09024 (ai sstes
(3.32511 [4.16816 15.89883 [8.34283 11.38/148.678356 |[reave9e 19.027 (2.88
P10 |2.15586 [255821 oye 94030 [4.86518 |6.73720 | 9.34182
11 {2.60322 |3.05348 {3.81575 [4.57481 {5.57778 [7.58414 | 103|143.710690;170.27501 | 19.67514 {21.9205 |24.72497 aad
F 12 [3.07382 [3.57057 :4.40379 15.2603 ‘6.30380 ;843842 Fri34032 (1144..884540| 18.54935 | 21.02607| 3366 2621607 (2829952,
T13 | 3.86503 [j 4.10692 | 5.00875 isis 7.04150 19. 29907 i 12.33976§ 15,98391 | 19.81 193 | 22.36203 / 24.73560 /27.68825 |29.81947
66043 "5.62873
[29.14124 [31.31935-
26214
fie fae mn 6.90766 (7.96165 9.31224 i
ee
0.57791 |32.80132|
731,99993 [34.26719 |
17 {5.69722 1640776 7.56419 8.67176, 10.08519 12.79193 : 16.33818 | 20.48868 | 24.76904 |27.58711 130-1910 | 33.40866 | 35.71847|
1 18 [6.26480 {701491 | 8.23075 £9, SODAS i 10: oe | 13. SISZ 1i t- 13190 :2L. 60489 | | 25.98942 :28. 865305) j3t. 52638 34. 80531 |37. 15645 }
i 19 pease jean | pasa
1 36.19087(3a. 58226|
161 | 37.56623 |39.99685|
an }(3.03365 ig8.89720 F70-28290 T9131 "73:23960 nasece Gredies !24.93478 |29.61509 | 32.67057aaa {38.93217 [41.40106:
22 | 8.64272 {9.54249 | 10.98| 1223338201 {14,04149 1 17.23962 : 21.33704 | 26.03927 . 30.81328 133.92444 36.7807! | 40.28936 }42.79565 |
23 2 26042 | 10.19572! 1.68855 | 13.09051 14 84796 | 18.13730 [2 33688 [2h 14134; 32.00690 [am 17246 Bn 07563 iM 63840 i 18128
laaiatos saan i 13,84390 |i15.3796 i 1739188 (ioe
(sane (3043457 |35.56317 £38.88514 [ai.oar7 Tas.cui68acs i
{1.80759 [1287850 ! 1457338 : 16.15140 / 18.1390 |21.74940 } 26.3634 | 31.52841 j 36.74122 1 40.11327 43.1945 | 46.96294 49.64492 }
1 12.46134 | 13.56471 ; 15.30786; 16.92788| 18.93924 {22.65716 127,33623 {32.62049 | 37.91592 fat 33714| 4.46079 | 48.27824 |50.99338
1} 13. 12115 | 14.25645: 16: 04707 :17.70837: H19. T6774 (23, 56659 128. 33613 i‘33. 71091 139. 08747 !142. 55697 1| 45 12229 149. 58788 fs 33562 3
;i 307 HN. 78672:| 14, 95346 ;:16.79077'18.49266: $20.59923} !124. 47761 | | 29. 33603 |34. TTA | 40. 25602 1; 43.77297 | 146. 97924 |1 50.89218 {53. ‘67196 ;j
Pag7 eof 7

1.10 Page 10

▲back to top


Z - Table
The table shows cumulative probabilities for the standard normal curve.
Cumulative probabilities for NEGATIVE z-values are shown first. SCROLL
DOWN to the 2™ page for POSITIVE z
z
00
01
02
03
04
05
06
-3.4
.0003
-9003
0093
0993
C003 | .G003
.0003
3.3
0005
0005
0905
0004
O04
0004
.0004
-3.2
0007
0007
0006
0006
£006
.COC6
0008
3.1
6010
0005
.0009 0009
0008
0008
0008
-3.0
0013
0013
0013
0012
0072
O11
0014
-2.9
0019
0018
O18
DO
0016
0016 | .0015
-2.8
0026
0026
0024
0023
£923
0022 | .0021
2.7
C035
0034
0033
0032
0031
.£030
.0023
-2.6
0047
0045
0044
0043
C041
C040
.0033
-2.5
-0062
-0060
0959
0057
0055
0054
0052
-2.4
0082
0080
0078
0075
£073
00711
0065
-2.3
0107
0104
0402
0099
0036
0094
0091
-2.2
0139
0136
0132
0124
0125 | .0122
0115
-2.1
0179
174
5170
0166
£162 | .0158
0154
-2.0
.0228
0222
O217
§252
0207
0202 | 0197
-1.9
0287
9281
0274
0266
0262
0256
.0250
-1.8
0359
0351
0344
.0336
0329
0322
0314
17
0446
0436
0427
0418
0409 {| 0401
.0392
-1.6
0548
537
0526
0815
0505 | 0495 | 0485
-1.5
.0668
0655
0643
0639
0618 | .0606
0594
-1.4
0868
0793
OTE
O54
0749
0735
0721
-1.3
0968
0951
.0934
0918
0901
0885
.0869
-1.2
TSI
H31
AVT2
1093
1075
1056
1038
-1.4
1357
1335
A314
4292
A274
1251
-1230
-1.0
1587
1562
.1539
1545
1492 | .1469
1446
-0.9
1841
1814
1788
1762
1736
A711
1685
-0.8
2119
2090
2061
2933
2005
AST?
1949
0.7
2420
2389
2358
2327
2296
.2286
.2236
-0.6
2743
2709
2676
2643
2611
2578
2546
0.5
3085
.3050
3016
2984
2946 | 2912
2877
0.4
3446
3409
3372
3336
3300 | 3264 | .3228
-G0.32 | 34822017 | 4.3176883 | 341t2495 || 34700970 | 43065629 || 34603132 || 33509744
-0.1
4602
A5G2
AG22
4483
A443
4404
A364
0.0
5000
4560
A920
4880
A840
A801
S761
07
0003
C004
0005
.0008
0011
0015
.0021
.0028
.0038
0051
C068
0089
0116
D150
0192
0244
0307
0384
0475
0582
0708
0853
1026
1210
1423
1660
1922
.2208
2514
2843
3192
J[3o05376 |
A325
AT24
08
.0003
0004
0005
.0007
0016
0014
.0020
0027
0037
.0049
-O066
0087
.0113
014
0183
0239
0301
.0375
0465
0574
0694
.0833
. 1003
1196
1401
1635
1884
2177
2483
2810
3156 |
33850270 ||
4236
AGS I
09
002
.0003
0005
0007 |
0010
0014
0018
0026
.0036
0048
0064
0084
O10
0143
9183
0233
0294
0367
0455
0559
0681
0823
0985
1170
1379
A611
A867
2148
2451
2176
3121
33488839
4247
4641

2 Pages 11-20

▲back to top


2.1 Page 11

▲back to top


Cumulative probabilities for POSITIVE z-values are shown below.
z
.00
01
02
03
-04
05
06
07
.08
.09
0.0
5000
5040
5980
5120
5160
5183
5239
5279
6319
6359
0.1
5398
5438
5478
5517
5557
5556
5536
5675
5T14
5F53
0.2
5793
5832
5871
5910
5948
5987
-6026
6064
6103
6141
0.3
6179
6217
6255
6293
6331
6368
6405
6443
.6480
6517
0.4
6554
659 1
6628
6864
6700
6736
6772
6808
6844
6879
0.5
6915
895C
8985
JONG
1054
088
F123
1157
1196
1224
0.6
2257
7291
1324
35F
1384
7422
F464
F485
SAT
F5AG
0.7
.7580
1614
7642
1873
7704
A134
164
1794
1823
7852
0.8
1831
1910
.f939
967
7995
8023
-8051
8078
8106
8133
0.9
8159
8186
8212
8238
8264
8289
8315
8340
8365
8359
1.0
8413
8438
8461
A485
8508
8531
5554
577
S599
8621
14
8643
8665
3886
8708
8729
B49
8770
2790
8816
&830
1.2
8849
8663
8888
8907
8925
8944
8962
8980
8997
OTS
1.3
3032
049
S086
9082
8099
S115
9131
S147 | 9162
ST?
1.4
9192
207
9222
9236
9251
-8265
9279
-9292
9306
S319
1.5
.9332
9346
357
9370
9382
S394
-2406
9418
“9429
S441
1.6
9452
9463
2474
3484
2495
9505
9515
9525
9535
9545
17
9554
9664
9573
9582
S591
9599
9608
9616
9625
9633
1.8
3641
SEAY
3856
1664
9671
9678
9685
3693
9699
3706
1.9
S713
FFAG
9726
3732
9138
9144
9750
TEE
9761
F767
2.0
9772
TE
783
9788
3793
9798
-9803
8808
812
S817
2.1
9821
3826
4830
9834
3838
9842
9846
9350
854
S857
2.2
9861
9864
4868
1871
$875
9878
9881
9834
9387
9890
2.3
9893
3896
9898
9901
9504
S906
S909
9911
5913
9916
2.4
9918
-3920
91922
9925
8927
9929
9931
9932
S934
9936
2.5
9938 j .9940
941
4943
9945
S946
9948
9946S
9951
9952
2.6
3953
9955
3956
9957
9959
9960 | .9961
9962
9963
9964
2.7
9965
9966
987
9958
3959
3970
9971
9972
9973
S974
2.8
9974
ITE
3976
977
S977
9978
8979
S979
4980
S981
2.3
9981
3982
9982
9983
3984
9984
9985
9985
9986
S986
3.0
9987
3987
987
9988
3988
9989
9989
9989
5990
9390
3.1
9990
9931
9991
S991
9992
9992
9992
9992
9993
9993
D2.
9993
3993,
1994
S994
9594
9994
S9S4
9995
3995
3995
3.3
9995
9995
9995
9996
9995
S996
S996
9995
9996
ASST
3.4
3997
997
IIIT
997
SSF
9997
9997
9997
997
9993