


 |
RME620S - BASIC REASEARCH METHODOLOGY - 1ST OPP - JUNE 2025 |
|
|
1 Page 1 |
▲back to top |
nAmlBIA unlVERSITY
OF SCIEnCE Ano TECHnOLOGY
FACULTYOF HEALTH,NATURALRESOURCESAND APPLIEDSCIENCES
DEPARTMENT OF AGRICULTURALSCIENCESAND AGRIBUSINESS
QUALIFICATION: BACHELOROF SCIENCEIN AGRICULTURE
BACHELOROF SCIENCEIN HORTICULTURE
QUALIFICATION CODE: 07BAGA
LEVEL: 6
COURSECODE: RME620S
DATE: JUNE 2025
DURATION: 3 HOURS
COURSENAME: BASICRESEARCHMETHODOLOGY
MARKS: 100
FIRSTOPPORTUNITY/ REGULAREXAMINATION QUESTION PAPER
EXAMINER($) Prof. Thinah Moyo
MODERATOR: Dr Tendai Nzuma
INSTRUCTIONS
1. Answer ALL five (5) questions.
2. Please write neatly and legibly.
3. Number the answers clearly.
4. Show all your working.
PERMISSIBLEMATERIALS
1. Examination question paper
2. Answer book
3. Calculators
THIS QUESTION PAPERCONSISTSOF 5 PAGES(Including this front page)
|
|
2 Page 2 |
▲back to top |
QUESTION 1
[20 Marks]
(a) List four reasons why research proposals are written.
(4 Marks)
(b) Define the acronym 'SMART' and briefly explain its meaning as it applies to research
objectives.
(5 Marks)
(c) Explain the purpose of a good literature review in three key points.
{3 Marks)
(d) What statistic reports the relative standing of a value in a set of data?
(2 Marks)
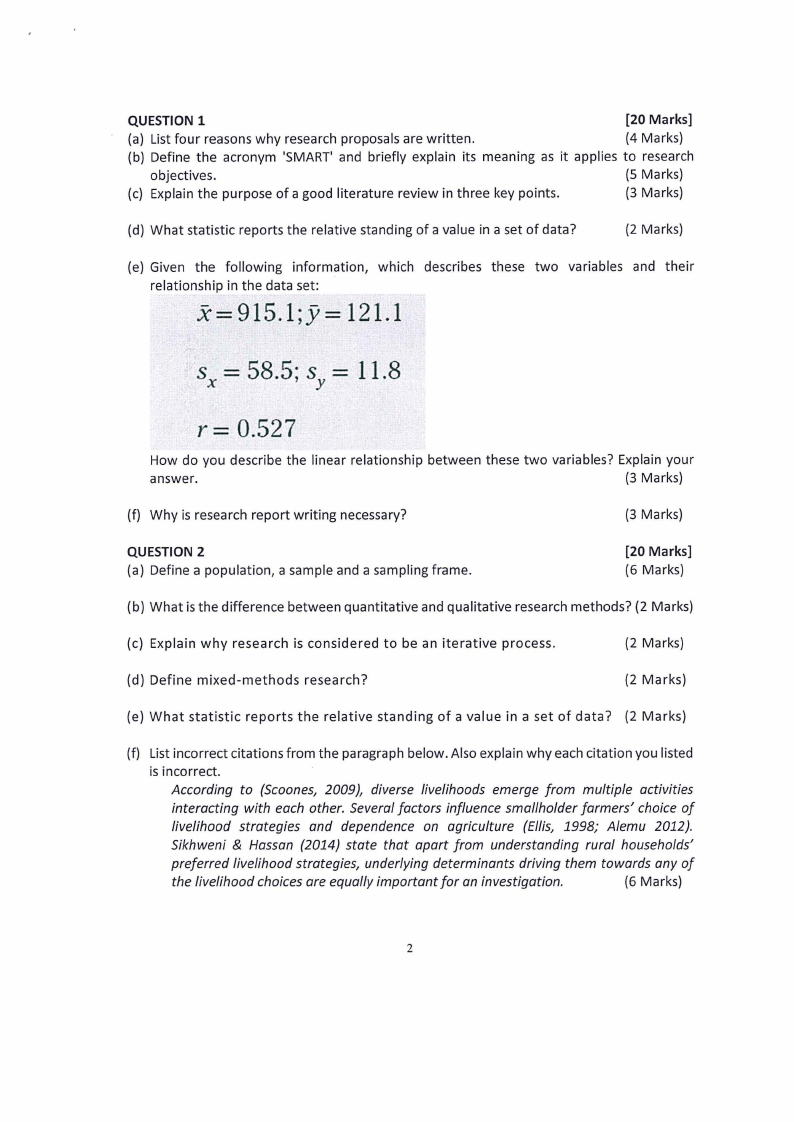
(e) Given the following information, which describes these two variables and their
relationship in the data set:
x==915.l;y= 121.1
s
X
=
58.5·
'
sy
=
11.8
r = 0.527
How do you describe the linear relationship between these two variables? Explain your
answer.
(3 Marks)
(f) Why is research report writing necessary?
(3 Marks)
QUESTION 2
(a) Define a population, a sample and a sampling frame.
[20 Marks]
(6 Marks)
(b) What is the difference between quantitative and qualitative research methods? (2 Marks)
(c) Explain why research is considered to be an iterative process.
(2 Marks)
(d) Define mixed-methods research?
{2 Marks)
(e) What statistic reports the relative standing of a value in a set of data? (2 Marks)
(f) List incorrect citations from the paragraph below. Also explain why each citation you listed
is incorrect.
According to {Scoones, 2009), diverse livelihoods emerge from multiple activities
interacting with each other. Several factors influence smallholder farmers' choice of
livelihood strategies and dependence on agriculture (Ellis, 1998; A/emu 2012).
Sikhweni & Hassan (2014} state that apart from understanding rural households'
preferred livelihood strategies, underlying determinants driving them towards any of
the livelihood choices are equally important for an investigation.
(6 Marks)
2
|
|
3 Page 3 |
▲back to top |
QUESTION 3
(20 Marks]
A large statistics class takes a midsemester examination worth a total of 100 points. The
following is a random sample of 20 students' scores from the class:
Score of 98 points: 2 students
Score of 95 points: 1 student
Score of 92 points: 3 students
Score of 88 points: 4 students
Score of 87 points: 2 students
Score of 85 points: 2 students
Score of 81 points: 1 student
Score of 78 points: 2 students
Score of 73 points: 1 student
Score of 72 points: 1 student
Score of 65 points: 1 student
(a) Calculate the standard deviation of the exam scores for the students in this sample to
the nearest tenth of a point. Show all your calculations.
(15 Marks)
Hint:
(b) What is the mode and median class marks?
(5 Marks)
QUESTION 4
(20 Marks]
(a) A Real Estate Agent tells you that the average cost of houses in a town is NAD2,176,000.
You want to know how much the prices of the houses may vary from this average. What
measurement do you need?
(2 Marks)
A. standard deviation
B. interquartile range
C. variance
D. percentile
(b) To the nearest thousandth, what is the mean of the following data set? 0.003, 0.045, 0.58,
0.687, 1.25, 10.38, 11.252, 12.001
(2 Marks)
(c) To the nearest tenth, what is the median of the following data set? 18, 21, 17, 18, 16, 15.5,
12, 17, 10, 21, 17.
(2 Marks)
(d) The starting salaries (in dollars) of a random sample of 125 university graduates were
analysed. The following descriptive statistics were calculated and typed into a report:
Mean: 24,329
Median: 20,461
Variance: 4,683,459
3
|
|
4 Page 4 |
▲back to top |
Minimum: 18,958
Ql: 22,663
Q3: 29,155
Maximum: 31,123
Which important descriptive statistic is missing in this result?
{1 Mark)
(e) If the mean weight of NUST students taking Basic Research Methodology (RME620S}
during the 2025 academic year is written as 65.08 ± 2.04kg. Use this information to answer
the following questions.
(i) What is the weight of the student with the least weight in the class? (2 Marks)
(ii) What is the range of the class weight?
(2 Marks)
(f) Define correlation coefficient.
(2 Marks)
(g) When intepreting a correlation cooefficient, it is important to look at:
A. The magnitude of the correlation coefficient (from -1 to +1)
B. The+/- sign of the correlation coefficient
C. The significance of the correlation coefficient
D. All of these options
(3 Marks)
(h} You took a survey of 100 people and found that 60% of them like chocolate and 40% do
not. Which of the following results presentations gives the distribution of the "chocolate
versus no chocolate" variable?
(4 Marks)
A. a table of the results
B. a pie chart of the results
C. a bar graph of the results
D. a sentence describing the results
E. all of the above
QUESTIONS
[20 Marks]
(a) A Horticulturalist wants to determine whether different types of fertilisers affect plant
growth.
Research design:
Independent variable (IV): Type of fertiliser (Organic, Chemical and No fertiliser)
Dependent variable (DV): Average plant height after 6 weeks (measured in cm)
(i) In general, when will using Analysis of Variance (ANOVA} in scientific research be most
appropriate.
(2 Marks)
(ii) Using the research example provided above, please state the null and alternative
hypotheses, using correct scientific notation for each hypothesis.
(4 Marks)
(iii) Based on the example above, please provide an interpretation of a one-way ANOVA
result based on a 0.05 level of statistical significance.
(2 Marks)
(iv) Explain how a post-hoc test (e.g., Tukey's HSD) can be applied in this instance. (2
Marks)
4
|
|
5 Page 5 |
▲back to top |
(b) If the formula for a regression line is y= 641 + 8.45x. Describe the components of this line
and the interpretation thereof.
(3 Marks)
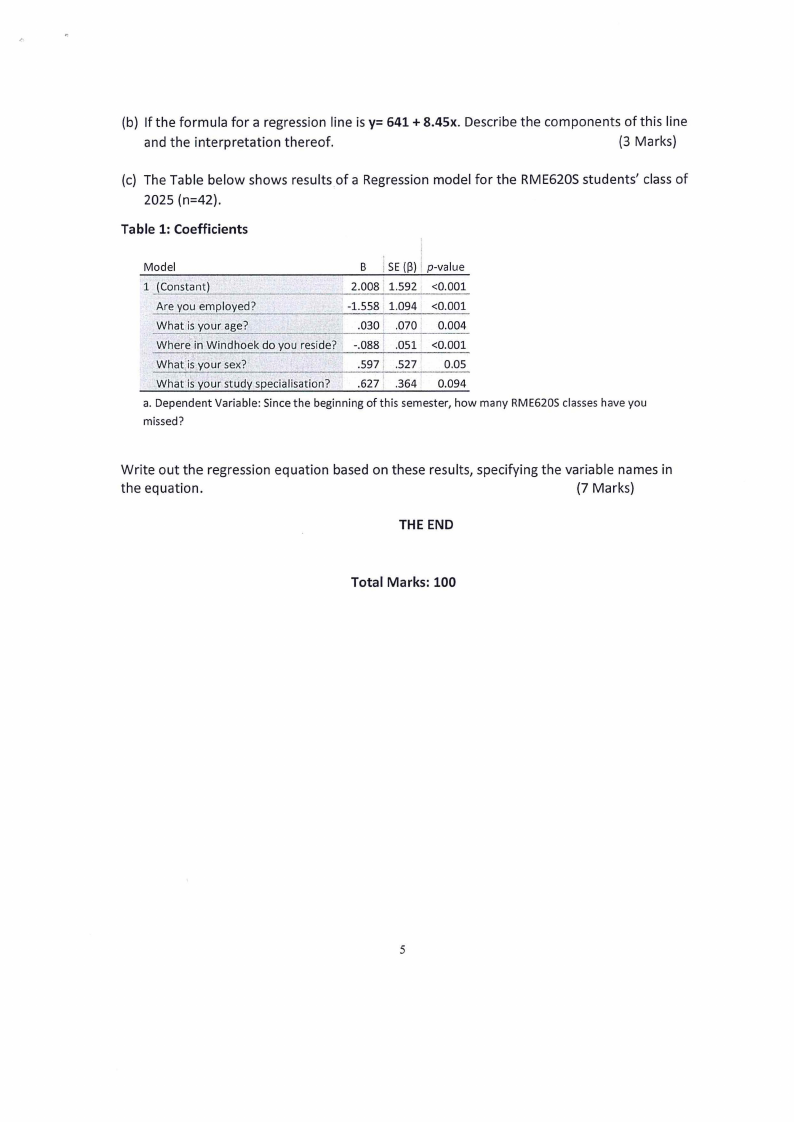
(c) The Table below shows results of a Regression model for the RME620Sstudents' classof
2025 (n=42).
Table 1: Coefficients
Model
B i SE(13)1 p-value
1 {Constant)
2.008 1.592 <0.001
Are you employed?
-1.558 1.094 <0.001
What is your age?
.030 · .070 0.004
Where in Windhoek do you reside? -.088 .051 <0.001
What.is your sex?
.597 .527 0.05
What is your study specialisation?
.627 .364 0.094
a. Dependent Variable: Since the beginning of this semester, how many RME620Sclasses have you
missed?
Write out the regression equation based on these results, specifying the variable names in
the equation.
(7 Marks)
THE END
Total Marks: 100
5