


 |
RME620S - BASIC REASEARCH METHODOLOGY - 2ND OPP - JUNE 2025 |
|
|
1 Page 1 |
▲back to top |
nAm I 8 I A Un IVE RS ITY
OF SCIEn CE Ano TECHn OLOGY
FACULTYOF HEALTH, NATURAL RESOURCESAND APPLIED SCIENCES
DEPARTMENT OF AGRICULTURALSCIENCESAND AGRIBUSINESS
QUALIFICATION:BACHELOROF SCIENCEIN AGRICULTURE
BACHELOROF SCIENCEIN HORTICULTURE
QUALIFICATIONCODE: 07BAGA
LEVEL: 6
COURSECODE: RME620S
COURSENAME: BASICRESEARCHMETHODOLOGY
DATE: JULY 2025
DURATION: 3 HOURS
MARKS: 100
SECOND OPPORTUNITY/ SUPPLEMENTARY EXAMINATION QUESTION PAPER
EXAMINER(S) Prof. Thinah Moyo
MODERATOR: Dr Tendai Nzuma
INSTRUCTIONS
1. Answer ALL five (5) questions.
2. Please write neatly and legibly.
3. Number the answers clearly.
4. Show all your working.
PERMISSIBLE MATERIALS
1. Examination question paper
2. Answer book
3. Calculators
THIS QUESTION PAPERCONSISTSOF 4 PAGES(Including this front page)
1
|
|
2 Page 2 |
▲back to top |
QUESTION 1
(a) How would you describe a research proposal?
[20 Marks]
(5 Marks)
(b) State four reasons why research proposals are written.
(4 Marks)
(c) Explain the purpose of a good literature review in three key points.
(6 Marks)
(d) Define the acronym 'SMART' and briefly explain its meaning as it applies to research
objectives.
(5 Marks)
QUESTION 2
[20 Marks]
(a) Explain the difference between quantitative and qualitative research methods?
(2 Marks)
(b) Explain why research is considered to be an iterative process.
(2 Marks)
(c) What is the relationship between sample size and the standard
A. The standard error decreases as the sample size increases
B. The standard error is unaffected by the sample size
C. The standard error decrease as the sample size decreases
D. The standard error decreases as the sample size increases
error
of the mean?
(2 Marks)
(d) Define a population, a sample and a sampling frame.
(6 Marks)
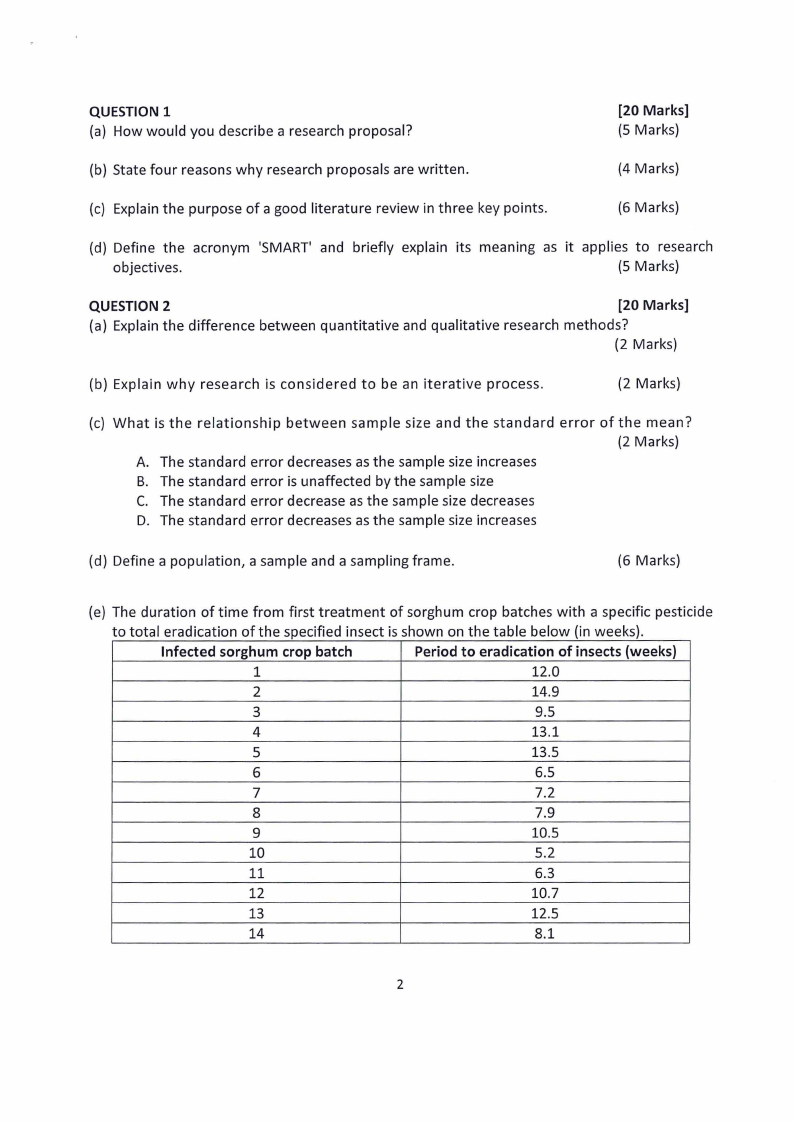
(e) The duration of time from first treatment of sorghum crop batches with a specific pesticide
to total eradication of the specified insect is shown on the table below (in weeks).
Infected sorghum crop batch
Period to eradication of insects (weeks)
1
12.0
2
14.9
3
9.5
4
13.1
5
13.5
6
6.5
7
7.2
8
7.9
9
10.5
10
5.2
11
6.3
12
10.7
13
12.5
14
8.1
2
|
|
3 Page 3 |
▲back to top |
Using this data, compute the following;
i. Sample size
(1 Mark)
ii. Range (provide your answer to the nearest hundredth)
(1 Mark)
iii. Ix (provide your answer to the nearest hundredth)
(1 Mark)
iv. 2x2 (provide your answer to the nearest hundredth)
(1 Mark)
v. Sample mean (provide your answer to the nearest hundredth)
(1 Mark)
vi. Sample median
(1 Mark)
vii. Sample standard deviation (provide your answer to the nearest hundredth) (2 Marks)
QUESTION 3
[20 Marks]
You take a random sample often car owners and ask them, "To the nearest year, how old is your
current car?" Their responses are as follows: 0 years, 1 year, 2 years, 4 years, 8 years, 3 years, 10
years, 17 years, 2 years, 7 years.
(a) Calculate the standard deviation of this sample to the nearest year. Show all steps in your
calculation.
(15 Marks)
Hint:
(b) What is the mode and median for the age of the cars?
(5 Marks)
QUESTION 4
[20 Marks]
(a) A Real Estate Agent tells you that the average cost of houses in a town is NAD2,176,000. You
want to know how much the prices of the houses may vary from this average. What
measurement do you need?
(2 Marks)
A. standard deviation
B. interquartile range
C. variance
D. percentile
(b) To the nearest thousandth, what is the mean of the following data set? 0.003, 0.045, 0.58,
0.687, 1.25, 10.38, 11.252, 12.001
(2 Marks)
(c) To the nearest tenth, what is the median of the following data set? 18, 21, 17, 18, 16, 15.5,
12, 17, 10, 21, 17.
(2 Marks)
(d) Define correlation coefficient.
(2 Marks)
(e) Identify which of the following options is a quantitative variable and explain why.(2 Marks)
A. the colour of an automobile
B. a person's region of residence
C. a person's postal code
3
|
|
4 Page 4 |
▲back to top |
D. a person's height, recorded in centimetres
E. choices (C) and (D)
(f) From the scenario in (e) above, which variables are qualitative and why?
{6 Marks)
(f) You took a survey of 100 people and found that 60% of them like chocolate and 40% do not.
Which of the following results presentations gives the distribution of the "chocolate versus no
chocolate" variable?
(4 Marks)
A. a table ofthe results
B. a pie chart of the results
C. a bar graph of the results
D. a sentence describing the results
E. all of the above
QUESTION 5
(a) State and describe 5 common data distribution patterns in statistics.
[20 Marks]
{10 Marks)
(b) If the formula for a regression line is y= l0x + 27. Describe the components of this line and
the interpretation thereof.
(5 Marks)
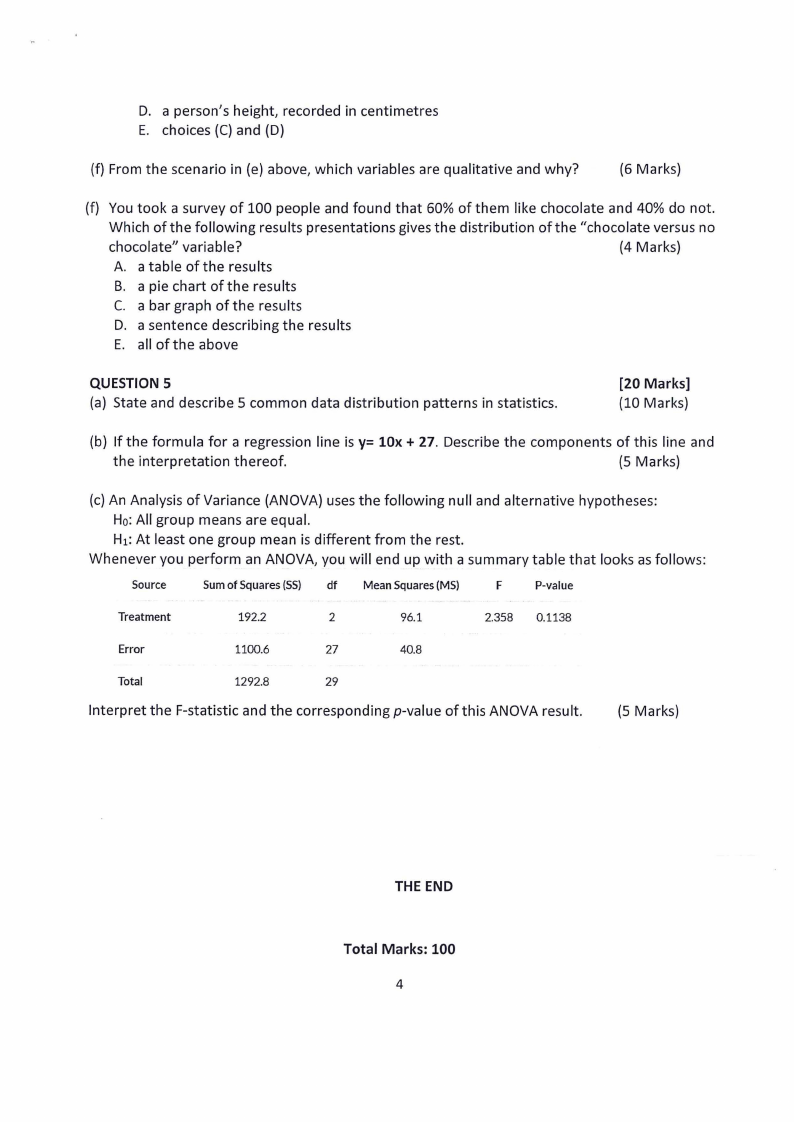
(c) An Analysis of Variance (ANOVA) uses the following null and alternative hypotheses:
Ho:All group means are equal.
H1:At least one group mean is different from the rest.
Whenever you perform an AN OVA, you will end up with a summary table that looks as follows:
Source
Sum of Squares (SS) df
Mean Squares (MS)
F
P-value
Treatment
192.2
2
96.1
2.358 0.1138
Error
1100.6
27
40.8
Total
1292.8
29
Interpret the F-statistic and the corresponding p-value of this ANOVA result.
(5 Marks)
THE END
Total Marks: 100
4