ETP720S - Experimental Techniques for Process Engineers 324 - 1st Opp. Nov 2022


ETP720S - Experimental Techniques for Process Engineers 324 - 1st Opp. Nov 2022


1 Pages 1-10

▲back to top


1.1 Page 1

▲back to top


nAm I BI A u n IVE RS ITV
OF SCIEnCE
TECHnOLOGY
FACULTY OF ENGINEERING AND THE BUILT ENVIRONMENT
SCHOOL OF ENGINEERING
DEPARTMENTOF CIVIL,MINING & PROCESSENGINEERING
QUALIFICATION(S): BACHELOR OF ENGINEERING IN METALLURGY & CHEMICAL ENGINEERING
QUALIFICATION CODE: 08BEMT & 08BECE LEVEL: 7
COURSE CODE: ETP720S
SESSION: NOVEMBER 2022
DURATION: 3 HOURS
COURSE NAME: EXPERIMENTAL TECHNIQUES
FOR PROCESSENGINEERS 324
PAPER: THEORY
MARKS: 100
EXAMINER:
MODERATOR:
FIRSTOPPORTUNITYQUESTION PAPER
MR. THOMAS MOONGO
PROF. JONAS ADDAI-MENSAH
INSTRUCTIONS
1. Answer all questions.
2. Read all the questions carefully before answering.
3. Marks for each questions are indicated at the end of each question.
4. Please ensure that your writing is legible, neat, and presentable.
PERMISSIBLEMATERIALS
1. Examination paper.
2. Calculator and stationary.
THIS QUESTION PAPER CONSISTS OF 8 PAGES (Including this front page)
llPage

1.2 Page 2

▲back to top


-

1.3 Page 3

▲back to top


SECTIONA
[30 marks]
Question 1
[5 marks]
To conduct experiments effectively, a process engineer should have several skills. Name and
explain five (5) skills required to conduct experiments effectively.
Question 2
[5 marks]
Differentiate between the Taguchi and the classical design of experiment (DOE).
Question 3
[5 marks]
Explain the concept FundamentalError {FE).Nameand explain the two characteristics of broken ore
materials that contributes to its origin.
Question 4
[5 marks]
During process design test work, the ore must go through mineralogical and chemical analysis.
Write the following abbreviations of the ore characterization techniques in full.
a) QUEMSCAN
b) FTIR
c) ICP- OES
d) ICP-AES
e) FT-NMR
Question 5
[S marks]
A process engineer well versed with experimental techniques should have a good understanding of
analytical equipment. Briefly explain how the atomic absorption spectroscopy (AAS) work. Give a
diagram illustrating the operating principles of the AAS.
Question 6
[5 marks]
With reference to the below graph, explain how the calibration curve is created and applied during
the experimentation process especially when it comes to the chemical analysis of samples.
21Page
80
70
60
8_50
"' 40
'E
C1J
30
E
20
y = 52.357x + 0.6286
r = 0.9997
E 10
0
0
0.2
0.4
0.6
0.8
1.2
1.4
Concentration /mg L-1

1.4 Page 4

▲back to top


1.5 Page 5

▲back to top


SECTION B
[70 marks]
Question 1
[10 marks]
Process engineers are conducting experiments in the oil and gas industry for the recently discovered
oil in Namibia. A 23 full factorial experiment was tarried out to understand the interaction between
factor A and B. Calculate the interaction between factor A and B. In addition to that use the graphical
method to illustrate if there is an interaction between factor A and B.
Run
Run
A
B
(standard order) (randomized order)
1
5
-1
-1
2
7
+l
-1
3
4
-1
+l
4
1
+l
+l
5
8
-1
-1
6
3
+1
-1
7
2
-1
+l
8
6
+1
+l
C
Response
(ppm)
-1
420,412
-1
370,375
-1
310,289
-1
410,415
+l
375,388
+l
450,442
+1
325,322
+1
350,340
Question 2
[10 marks]
Process engineers with an entrepreneurial mindset are setting up a battery manufacturing
company. The table below shows some of the experimental results obtained. Calculate the sample
standard deviation and sample variance for the data set.
152
327
612
274
496
385
256
401
231
307
585
754
825
293
775
974
137
259
Question 3
[10 marks]
A researcher investigated the quantitative determination of Cr in high-alloy steels by a
potentiometric titration of Cr6+. Before titrating, the steel was dissolved in acid and the chromium
oxidized to Cr6+ by peroxydisulfate. Following are their results (%w/w Cr) for the analysis of a single
reference steel.
16.968 16.922 16.840 16.883
16.887 16.977 16.857 16.728
Calculate the 95% confidence interval about the mean.
3IPage

1.6 Page 6

▲back to top


1.7 Page 7

▲back to top


Question 4
[10 marks]
Process engineers believe that it takes on average less than 45 days to finalize uranium heap
leaching experiments due to slow leaching kinetics. To test this claim, process engineers randomly
conducted 12 uranium heap leaching experiments and the duration ofthe experiments are shown
below in days.
42
35
39
35
56
47
29
51
29
37
45
53
Test at 5% level of significance whether the process engineers' claim is likely to be true. Clearly show
all the steps and illustration diagrams if necessary.
Question 5
[10 marks]
Namib Lead and Zinc Mine is considering undertaking experiments to improve process efficiencies.
First, they are considering determining the minimum quantity of a sample required for metallurgical
test work for a lead ore assaying 5% Pb which must be routinely sampled for assay to a confidence
level of ±0.1% Pb, 95 times out of 100. Galena is essentially liberated from the quartz gangue at a
particle size of 150µm. Assume that the sample will be collected during crushing to a top size of 25
mm. The mean density of Galena and Quartz is 7.50 g/cm 3 and 2.65 g/cm 3.
Question 6
[20 marks]
The table below shows experimental data collected during a process test work for the green
hydrogen project in Namibia.
X4
4
3 2 5 2 4 3 5 5 . 3 4.
y 26 28 24 18 35 24 36 25 31 37 30 32
Use the data to answer the following questions:
(a) Determine the value of variable y when x = 7 and calculate Pearson's correlation coefficient
by using the appropriate formula.
[10 marks]
(b) At the 5% level of significance, test whether the population correlation c;oefficient, p,
between variable x and y is actually zero. Clearly show all your steps and draw a sketch using
an appropriate statistical testing method for the correlation coefficient.
{lOmarks]
41Page

1.8 Page 8

▲back to top


1.9 Page 9

▲back to top


Listof Equations
t-crit = tca,n-1)
Range= X1argest - Xsmallest
C = fglm
½ IA,B = (EA,B(+l) - EA,B(-1))
y=b 0 +b 1x
z-stat
x-µ
=-a-
m
nixy-Ixiy
rJ2= 2:L. (X - µ)2
N
E=Zx-..(J/n
M=-
Cd 3
sz
(J = If:,1 (xi- µ) 2
N
t-stat =-xs-- µ
../n
b _ nixy -Ixiy
1 - nix 2 - (Ix) 2
5 = I~ 1 Cxi-x) 2
n-1
m =-1[-(aa1-
b0
_
-
Iy-b1Ix
n
a)r + at]
s2 =- 1-L(x - x)2
n-1
SI Page

1.10 Page 10

▲back to top


2 Pages 11-20

▲back to top


2.1 Page 11

▲back to top


STATISTICALTABLES
TABLEA.1
Cumulative Standardized Normal Distribution
A(:Z)is the integral of the standardized normal distribution
from - ooto z (in other words, the area under the curve to
the left of z). It gives theprobability of a normal random
variable not being more than z standard deviations above
its mean. Values of z of particular importance:
z
1.645
1.960
2.326
2.576
3.090
3.291
Az
0.9500
0.9750
0.9900
0.9950
0.9990
0.9995
Lower limit of right 5% tail
Lower limit of right 2.5% tail
Lower limit of right 1% tail
Lower limit of right 0.5% tail
Lower limit of right 0.1% tail
Lower limit of right 0.05% tail
-4 -3
z
0.00
0.0 0.5000
0.1 0.5398
0.2 0.5793
0.3 0.6179
0.4 0.6554
0.5 0.6915
0.6 0.7257
0.7 0.7580
0.8 0.7881
0.9 0.8159
1.0 0.8413
I.I 0.8643
1.2 0.8849
1.3 0.9032
1.4 0.9192
1.5 0.9332
1.6 0.9452
1.7 0.9554
1.8 0.9641
1.9 0.9713
2.0 0.9772
2.1 0.9821
2.2 0.9861
2.3 0.9893
2.4 0.9918
2.5 0.9938
2.6 0.9953
2.7 0.9965
2.8 0.9974
2.9 0.9981
3.0 0.9987
3.1 0.9990
3.2 0.9993
3.3 0.9995
3.4 0.9997
3.5 0.9998
3.6 0.9998
-2
-1
0
0.01
o.oz
0.5040
0.5438
0.5832
0.6217
0.6591
0.6950
0.7291
0.761 I
0.7910
0.8186
0.8438
0.8665
0.8869
0.9049
0.9207
0.9345
0.9463
0.9564
0.9649
0.9719
0.9778
0.9826
0.9864
0.9896
0.9920
0.9940
0.9955
0.9966
0.9975
0.9982
0.9987
0.9991
0.9993
0.9995
0.9997
0.9998
0.9998
0.5080
0.5478
0.5871
0.6255
0.6628
0.6985
0.7324
0.7642
0.7939
0.8212
0.8461
0.8686
0.8888
0.9066
0.9222
0.9357
0.9474
0.9573
0.9656
0.9726
0.9783
0.9830
0.9868
0.9898
0.9922
0.9941
0.9956
0.9967
0.9976
0.9982
0.9987
0.9991
0.9994
0.9995
0.9997
0.9998
0.9999
1z 2
0.03
0.5120
0.5517
0.5910
0.6293
0.6664
0.7019
0.7357
0.7673
0.7967
0.8238
0.8485
0.8708
0.8907
0.9082
0.9236
0.9370
0.9484
0.9582
0.9664
0.9732
0.9788
0.9834
0.9871
0.9901
0.9925
0.9943
0.9957
0.9968
0.9977
0.9983
0.9988
0.9991
0.9994
0.9996
0.9997
0.9998
3
4
0.04
0.05
0.5160
0.5557
0.5948
0.6331
0.6700
0.7054
0.7389
0.7704
0.7995
0.8264
0.8508
0.8729
0.8925
0.9099
0.9251
0.9382
0.9495
0.9591
0.9671
0.9738
0.9793
0.9838
0.9875
0.9904
0.9927
0.9945
0.9959
0.9969
0.9977
0.9984
0.9988
0.9992
0.9994
0.9996
0.9997
0.9998
0.5199
0.5596
0.5987
0.6368
0.6736
0.7088
0.7422
0.7734
0.8023
0.8289
0.8531
0.8749
0.8944
0.9115
0.9265
0.9394
0.9505
0.9599
0.9678
0.9744
0.9798
0.9842
0.9878
0.9906
0.9929
0.9946
0.9960
0.9970
0.9978
0.9984
0.9989
0.9992
0.9994
0.9996
0.9997
0.9998
0.06
0.5239
0.5636
0.6026
0.6406
0.6772
0.7123
0.7454
0.7764
0.8051
0.8315
0.8554
0.8770
0.8962
0.9131
0.9279
0.9406
0.9515
0.9608
0.9686
0.9750
0.9803
0.9846
0.9881
0.9909
0.9931
0.9948
0.9961
0.9971
0.9979
0.9985
0.9989
0.9992
0.9994
0.9996
0.9997
0.9998
O.o?
0.5279
0.5675
0.6064
0.6443
0.6808
0.7157
0.7486
0.7794
0.8078
0.8340
0.8577
0.8790
0.8980
0.9147
0.9292
0.9418
0.9525
0.9616
0.9693
0.9756
0.9808
0.9850
0.9884
0.9911
0.9932
0.9949
0.9962
0.9972
0.9979
0.9985
0.9989
0.9992
0.9995
0.9996
0.9997
0.9998
0.08
0.5319
0.5714
0.6103
0.6480
0.6844
0.7190
0.7517
0.7823
0.8106
0.8365
0.8599
0.8810
0.8997
0.9162
0.9306
0.9429
0.9535
0.9625
0.9699
0.9761
0.9812
0.9854
0.9887
0.9913
0.9934
0.9951
0.9963
0.9973
0.9980
0.9986
0.9990
0.9993
0.9995
0.9996
0.9997
0.9998
0.09
0.5359
0.5753
0.6141
0.6517
0.6879
0.7224
0.7549
0.7852
0.8133
0.8389
0.8621
0.8830
0.9015
0.9177
0.9319
0.9441
0.9545
0.9633
0.9706
0.9767
0.9817
0.9857
0.9890
0.9916
0.9936
0.9952
0.9964
0.9974
0.9981
0.9986
0.9990
0.9993
0.9995
0.9997
0.9998
0.9998
GI Page

2.2 Page 12

▲back to top


2.3 Page 13

▲back to top


Degrees of
freedom
1
2
3
4
5
6
7
8
9
10
11
12
13
14
15
16
17
18
19
20
21
22
23
24
25
26
27
28
29
30
32
34
36
38
40
42
44
46
48
50
60
70
80
90
100
120
150
200
300
400
500
600
00
TABLE A.2
t Distribution: Critical Values oft
Two-tailed test:
One-tailed test:
10%
5%
6.314
5%
2.5%
12.706
Significance level
2%
1%
1%
0.5%
31.821 63.657
2.920
2.353
2.132
2.015
4.303
3.182
2.776
2.571
6.965
4.541
3.747
3.365
9.925
5.841
4.604
4.032
1.943
2.447
3.143
3.707
1.894
1.860
1.833
1.812
2.365
2.306
2.262
2.228
2.998
2.896
2.821
2.764
3.499
3.355
3.250
3.169
1.796
2.201
2.718
3.106
1.782
1.771
1.761
1.753
2.179
2.160
2.145
2.131
2.681
2.650
2.624
2.602
3.055
3.012
2.977
2.947
1.746
2.120
2.583
2.921
1.740
1.734
1.729
1.725
1.721
2.110
2.101
2.093
2.086
2.080
2.567
2.552
2.539
2.528
2.518
2.898
2.878
2.861
2.845
2.831
1.717
1.714
1.711
1.708
2.074
2.069
2.064
2.060
2.508
2.500
2.492
2.485
2.819
2.807
2.797
2.787
1.706
2.056
2.479
2.779
1.703
1.701
1.699
1.697
2.052
2.048
2.045
2.042
2.473
2.467
2.462
2.457
2.771
2.763
2.756
2.750
1.694
2.037
2.449
2.738
1.691
1.688
1.686
1.684
2.032
2.028
2.024
2.021
2.441
2.434
2.429
2.423
2.728
2.719
2.712
2.704
1.682
2.018
2.418
2.698
1.680
1.679
1.677
1.676
2.015
2.013
2.01 I
2.009
2.414
2.410
2.407
2.403
2.692
2.687
2.682
2.678
1.671
2.000
2.390
2.660
1.667
1.664
1.662
1.660
1.658
1.994
1.990
1.987
1.984
1.980
2.381
2.374
2.368
2.364
2.358
2.648
2.639
2.632
2.626
2.617
1.655
1.653
1.650
1.649
1.976
1.972
1.968
1.966
2.351
2.345
2.339
2.336
2.609
2.601
2.592
2.588
1.648
1.965
2.334
2.586
1.647
1.645
1.964
1.960
2.333
2.326
2.584
2.576
0.2%
0.1%
318.309.
22.327
10.215
7.173
5.893
5.208
4.785
4.501
4.297
4.144
4.025
3.930
3.852
3.787
3.733
3.686
3.646
3.610
3.579
3.552
3.527
3.505
3.485
3.467
3.450
3.435
3.421
3.408
3.396
3.385
3.365
3.348
3.333
3.319
3.307
3.296
3.286
3.277
3.269
3.261
3.232
3.211
3.195
3.183
3.174
3.160
3.145
3.131
3.118
3.111
3.107
3.104
3.090
0.1%
0.05%
636.619
31.599
12.924
8.610
6.869
5.959
5.408
5.041
4.781
4.587
4.437
4.318
4.221
4.140
4.073
4.015
3.965
3.922
3.883
3.850
3.819
3.792
3.768
3.745
3.725
3.707
3.690
3.674
3.659
3.646
3.622
3.601
3.582
3.566
3.551
3.538
3.526
3.515
3.505
3.496
3.460
3.435
3.416
3.402
3.390
3.373
3.357
3.340
3.323
3.315
3.310
3.307
3.291
71Page

2.4 Page 14

▲back to top


.

2.5 Page 15

▲back to top


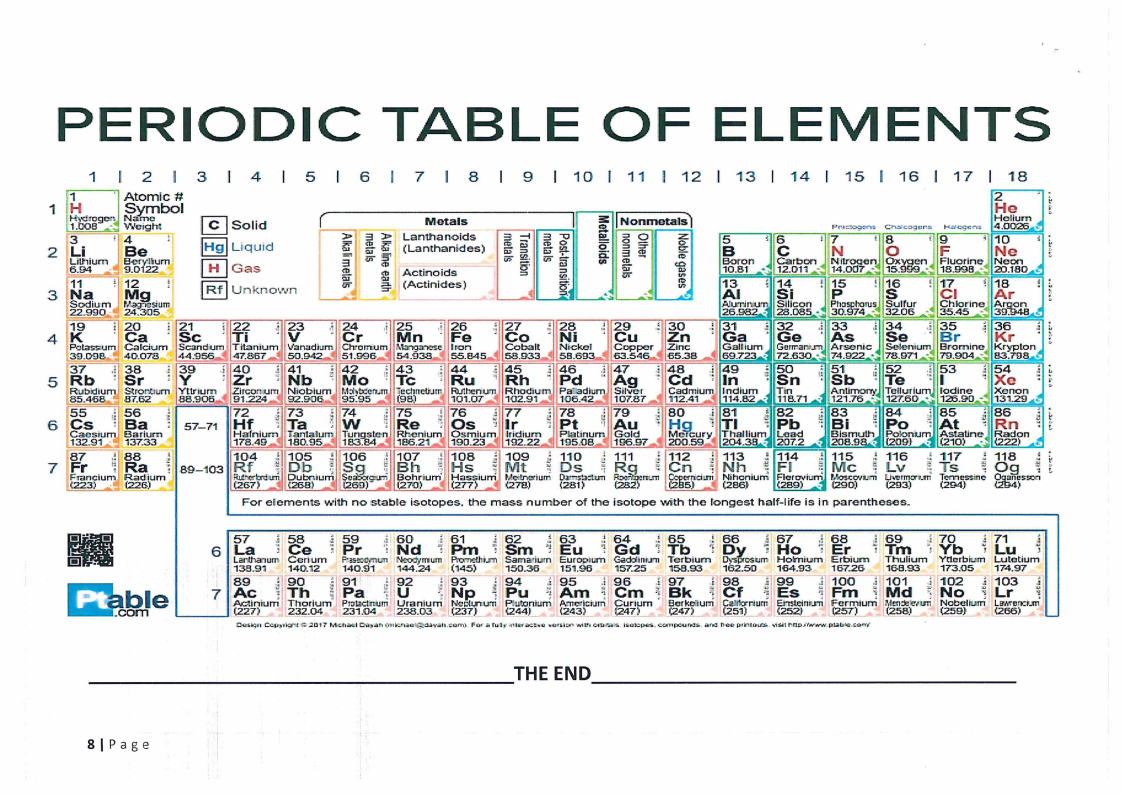
PERIODIC TABLE OF ELEMENTS
1
2
1
1H
Atomic #
Symbol
2
;14 ' 1H.\\t':C08!'roge•r, NVlaom'-eeigh1
3Li
Be
Lll.hlum B~Nlium
.6.94
9.0122 ;
3 N11a
1M2g ,
Sodium
r,'ic>;i"Esium
~-
.., 2.4.305
3
4
= . . 6r;::-J Sohd.
Lrqu1d
I}!]Gas
'I I Rf UnknO"'ll "
5
6
7
8
9
10
11
12
"'];,, (
'
Metals
LanO,aru,lds
<ii"~ (Lanthani·des)
i3 ur a;
g: Actii:,oids _
s= .___{j_;" ...,
1(Actinides)
I
jl c,' :l;f:
.,, g;::;: 00 a
,'!1! • 0 -
I 3s: Nonmetallsj
"- 35 Q[
* i:.a
is
=
-·.!~
.,,
13
14
15
16
17
18
2I
5B
C6
J PrlC".og<:-"Y. Ch:.c<>;~r~
K=>lc<;cn>
He
4H.0e0li2u'm6..,.,'I
iiI, ' 7N
J. 8O . J" 9F
' 1N0e
Boron
10.81
A13l
-·.::, 12.011-·J
1S~1
Nitt
14.~
. P15
-~"7' ·'£In Ox en
~5.~--':'
. 1S6
.
18.998-•;
1C7 l
Noon
20.1so~:
.. '1A8r
·Ir
w
Atumir.:urrn SIiicon
Pho~ru_s Sulfur _,
26.982-· 28.085._.. 30.974,.. 32.06
35.45
lA!g·on ,.
39-:948 • .,-
19
4 IK
i 12.o
' Ca
P¢1as:s.um calcium
39.Q§)S~ 40.076
s !3R7b J: S38r
J 21
i 22
.; 23
,, 24
., 25
· Sc ' Ti ' V ' Cr ' Mn
Scand.um
44.956.,J
Tilanium
47.867 -•
V50a.n9a4d::i.u: m..J
Chtornum
51.996-•
\\\\~~e
54.938-
1i 3Y'9
·:iIi4Z0r
.i 4N1b J·114M2o 1·i T43c
,; 2"6
27
28
· Fe . Co ' Ni
Iron . ..., Cobalt
Nick.el
1 55.E!45-'0 58.93~--i
.·1; 4R4u ,'1; 4R5h
4P6 d
J.
29
Cu
.: 30
Zn
Copper
Zinc
63.546-• 65.38
j" 4A7g .-l~4C8d
.'!
31
Ga
Gallium
-1 69.723
.·i: 4In9
32
, Ge
· 72.630
-; 5S0n
.: 33
' As
•_. 74.922
f·. 5S1b
.i 34 .i 35
' Se .' Br
Selonium,
t ,, 36
..
.
IKr
Krypton,~
.1
"I" ..... 78.971 · 79.904-·- 83.79~ "'
i·i T52e. ··=: 5I3
: 5X4e
Ru'b'dium Strontn:m Yttrium_·.' ,._Zlr,c;on::um Niobium t,1:iMx:'cr,;m -:roctrnctbrn Rllthcrium Rhodium Pa'.'.'.adii::n:i Sllvr:n
Cadmium Indium , Tin
Anlimon;: Tellurium Iodine .. Xenon ,.
85.4'6B..;"" 87.62
8B.906.-.'!
6 1cs
: 5B6a
J
; 57-71
Caesium Barium
.'!188!l 1-32.91,.;~ 137.33
Bi ..
7 Fr
Ra 1 8·9-103
F'·rar,clum Rad'ium
(223) ..,.:C,_f.22...fil.....__
7H2 f
Hafnium
178.49 _I
92.9C06-~ 95:.95 -• (9B) -• ;01.07..-:• 102.9;-~
w T73a 1•; 74
J 7R5e ,! 7O6s .i 7Ir7
TanlaJurn, Tungsten Rhenium Osmium Iridium
180.95-~ 183~-•
1B6.21 -• 190.23
192.22
106.42-• 107.87
5 7P8t
J
'I
7A9 u
• Platinuf'T! Gold
• 195.08-• 196.97
-• 112.4;
114.82 · 118.71
-,=; 8H0g
.,
l
T81l
J 8P2b
Mercury Thallium, Lead
_I 200.59.:• 204.3R · 207.2
~·• 121.76 • 127.60-·.· 126.00-·.:: 131.29~c:-
J JI J ·: aB3i ·: 8P4o. '.:; Aa5t
.. Blsmull':!, PoloniullJ As1aline-,
8R6 n
!;3,adon
Jt
~" 20a9R.,, (209} ~- (21o;. • '-"'22)
fil.t'ltrl:rd:~ 104
Rf
(267)
1105,d~
Dlb.
DutxMum
(261:1)
J 106 .. ! 107 .! 108 .0 109
110 ,: 111 ,; 112 ·£ 11.3 .:_114 A 115 ,! 116 -~ 117 J 118
;
q Sgi
Bh.
Scmiora:tr.J),,Bohrium.
C269)- _,. f.270) -•
Hs, Mt .
Hass,urri. Ml.!'ll=rum
(277) .• (278)
c(D2u8s,1,)-,,:a.::l/1R·Rf.x.r2nng8'm2m) .m
Cm.,; ~h
~ftt1Lr1!,
Nrhcnlum
1';285} • (286}
FE
Mc
Lv
Ts . ;; Og
F(lerovh.:n_:: Plmc0'1l!nl ILlwrma,.m i=cssme O<ia1fosso,,
2B9) ~- {290)
f.293)
(294}
(2W)
-
For elements willh no stabte isotopes. the mass number of the isotope \\'llith the rongest half-life is in parentheses.
caobm le
57 .l 58
6 I La i Ce
La-lha,,um Cerium
138.91
140.12
7 8A9c . J'll,9T0h-
LJ,Acilnium
Thorium
~27)__
232.04
J 59
,1 60
-; Pr 'i Nd
P.:.s!.'<:•:l;mu~n~mum
140.91
1144.24
J 192 J;]9P1'-a i U
I Pr:,ladnlumllUranlum
, •2<!1.04
238.03
.! 61
l 62
t 63
.! 64
,t 65
.! 66
.l 67
,1 68
.1 69
J 70
.i 71
.l
: Pm , Sm 'l Eu "1 Gd 1 Tb 1 Dy 'i Ho ! Er i Tm ·, Yb j Lu i
J JI ·11j~l Pn:tm/lj_rn Sama,ium Europ11.T.11 C-.ao:iinr.rn Terbium
(145)
150.36
15;_95
157.25
1158.93
'r 19N3p
!Jlll9P4u
'J!_1A95m
'l 9C6m
;\\
97
Bk
Dy:sprt,1;11mHolmium Erblum
162.50
164.93
167.26
.a 9C8f
Es 1 1F0m0
Thulium
168.93
1j11M10d1
Ytterbium
173.05
J 1N10o2 l
Lutetium
174.97
1L0r3 -,.~1
t-.½:~-un:umI PJutonlu_m A,,rc-:,IC~JmlCurium
, (237)
, -:.Z44)_ , <~3)_
f.247t
(257L ~BL Borkc:lurn Ca!ilo-rJum IEhslcinj-,.rn Fermium I Mm:lo!C'1un Ncbellum La'M'DOCP.m'
l'.247L
(25_!)
(252,t
(259}_
,;266)
CXrst.;o •~r,,1'j,Qh_( ::!017 M•C.h;,(tf
~r11.:.n;i.o~'"v~ll-~on)) For;. rus.,~.,u,·...:::;-..ll:..c,~iott'MlT, Ofb.".'."ak. iua>:p.c,:;., c,r..,.,-1pc-ur.c~Dr~ notr pti'llot.n- ,.,;s..1rno.fl".vN"eY.frU.b!,Q,-.,ton'I
_______________
THE END______________
_
Bl Page

2.6 Page 16

▲back to top