


 |
AMS602S - APPLIED MATHEMATICAL AND STATISTICAL COMPUTING - 1S OPP - NOVEMBER 2024 |
|
|
1 Page 1 |
▲back to top |
nAml BIA UnlVERS ITY
OF SCIEnCEAnDTECHnOLOGY
FacultyofHealthN, atural
ResourceasndApplied
Sciences
Schoool f NaturalandApplied
Sciences
Departmentof Mathematics,
Statisticsand ActuarialScience
13JacksonKaujeuaStreet
Private Bag13388
Windhoek
NAMIBIA
T: +264612072913
E: msas@nust.na
W: www.nust.na
QUALIFICATION : BACHELOR of SCIENCE IN APPLIED MATHEMATICS AND STATISTICS
QUALIFICATION CODE: 07BSAM
COURSE: APPLIED MATHEMATICAL AND STATISTICAL
COMPUTING
LEVEL: 6
COURSECODE: AMS602S
DATE: NOVEMBER 2024
SESSION: 1
DURATION: 3 HOURS
MARKS: 100
EXAMINER:
MODERATOR:
FIRST OPPORTUNITY: QUESTION PAPER
Mr. Jan Johannes Swartz
Mr. S. Kashiha/wa
INSTRUCTIONS:
1. Answer all the questions using MATLAB R2007b and IBM SPSSStatistics 29 software
on your computer into the z-drive
2. Create a MS Word document in your z-drive on your computer. Copy your results
from MATLAB R2007b and IBM SPSSStatistics 29 in the MS Word document and
save the MS Word file containing your student number, e.g. 2001349.
3. No books, notes and other additional aids are allowed.
4. Mark all answers clearly with their respective question numbers.
PERMISSIBLE MATERIALS:
1. Computer with MATLAB R2007b, IBM SPSSStatistics 28 and MS Office software
ATTACHEMENTS
1. None
This paper consists of 8 pages including this front page
|
|
2 Page 2 |
▲back to top |
Use MATLAB R2007b, installed in your computer, to answer the following questions.
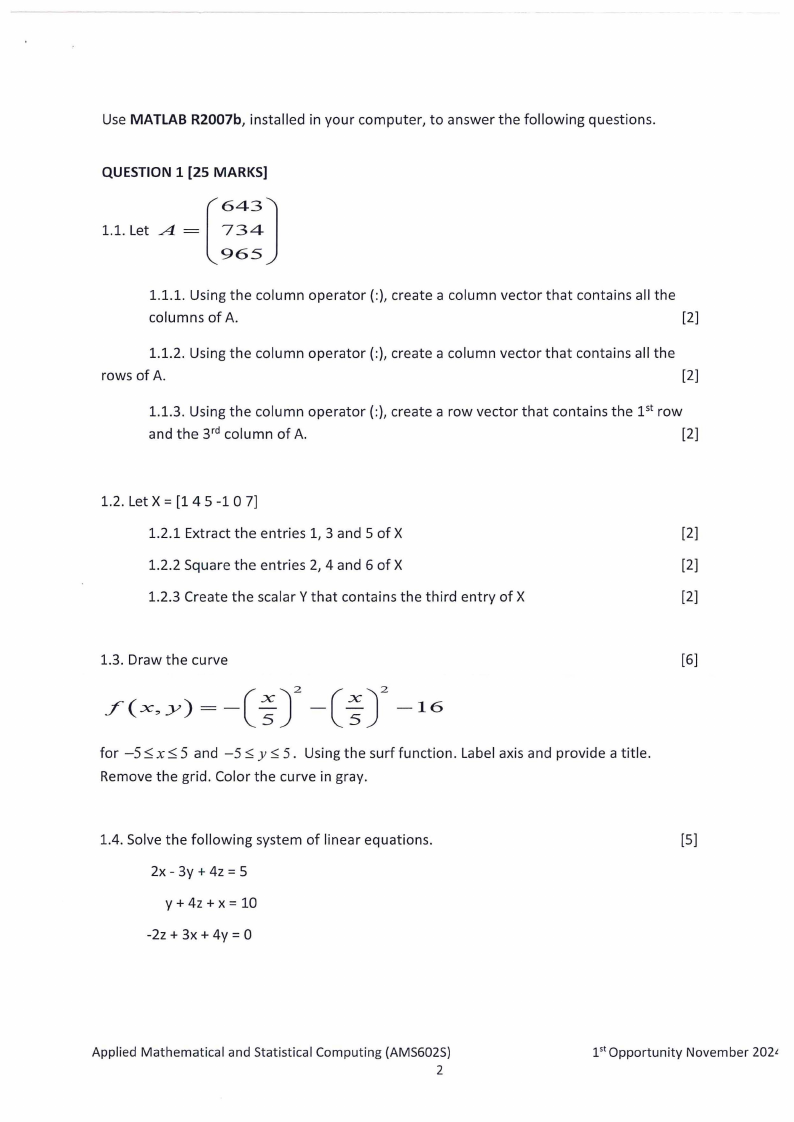
QUESTION 1 [25 MARKS]
643] 1.1.Let A=
734
[965
1.1.1. Using the column operator(:), create a column vector that contains all the
columns of A.
[2]
1.1.2. Using the column operator(:), create a column vector that contains all the
rows of A.
[2]
1.1.3. Using the column operator(:), create a row vector that contains the 1st row
and the 3rd column of A.
[2]
1.2. Let X = [14 5 -1 0 7]
1.2.1 Extract the entries 1, 3 and 5 of X
[2]
1.2.2 Square the entries 2, 4 and 6 of X
[2]
1.2.3 Create the scalar Ythat contains the third entry of X
[2]
1.3. Draw the curve
[6]
for -5 s;x s;5 and -5::;; y::;; 5. Using the surf function. Label axis and provide a title.
Remove the grid. Color the curve in gray.
1.4. Solve the following system of linear equations.
[S]
2x - 3y + 4z = 5
y + 4z + X = 10
-2z + 3x + 4y = 0
Applied Mathematical and Statistical Computing (AMS602S)
2
1st Opportunity November 202L
|
|
3 Page 3 |
▲back to top |
1.5. Write the MATLAB command for the following line and solve for Y.
Y =I .Xeax - cos(b.X)
I for a = 11, b = 7r' and
.X = {2,,4,,6,,8}
[2]
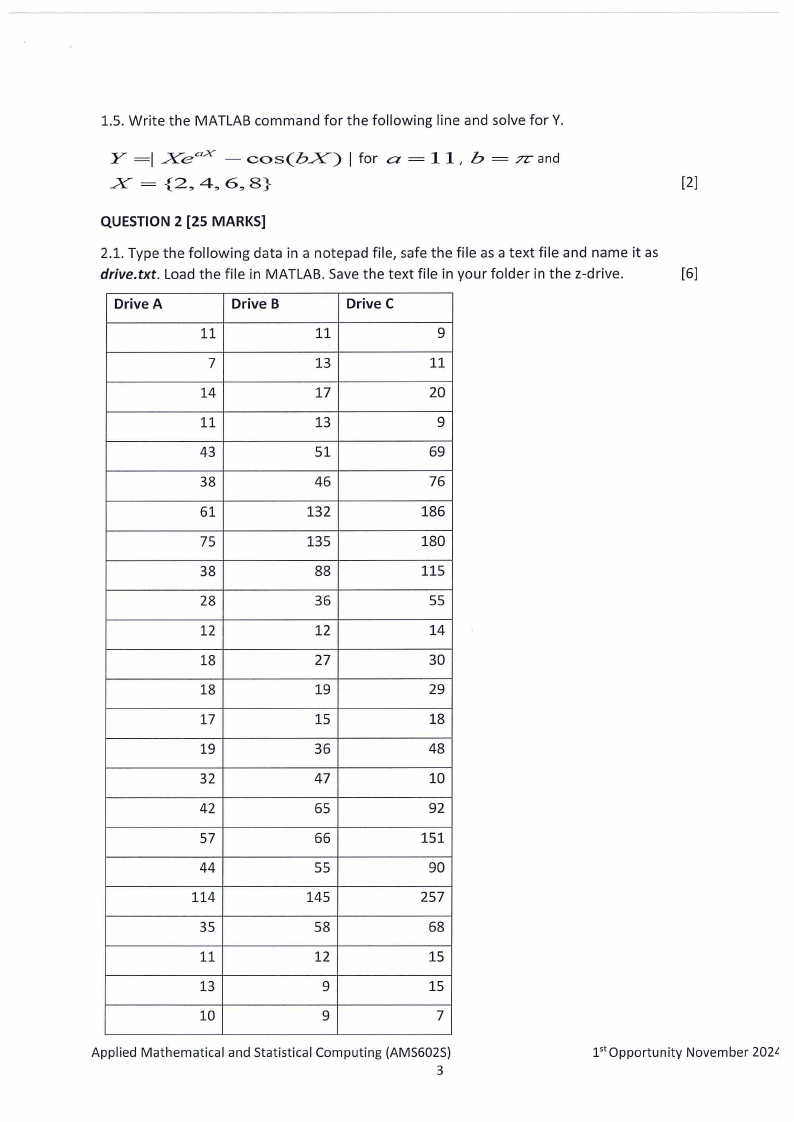
QUESTION 2 [25 MARKS]
2.1. Type the following data in a notepad file, safe the file as a text file and name it as
drive.txt. Load the file in MATLAB. Save the text file in your folder in the z-drive.
[6]
Drive A
Drive B
Drive C
11
11
9
7
13
11
14
17
20
11
13
9
43
51
69
38
46
76
61
132
186
75
135
180
38
88
115
28
36
55
12
12
14
18
27
30
18
19
29
17
15
18
19
36
48
32
47
10
42
65
92
57
66
151
44
55
90
114
145
257
35
58
68
11
12
15
13
9
15
10
9
7
Applied Mathematical and Statistical Computing (AMS6025)
3
151 Opportunity November 202L'.
|
|
4 Page 4 |
▲back to top |
2.1.1. Find the mean, median and mode of the data set.
[3]
2.1.2. Compute the range, variance and standard deviation of the data set
[3]
2.1.3. Create a 2 dimensional scatter plot of Drive A and Drive B with labels Drive A and
Drive B.
[3]
r) 2.1.4. Find the covariance of Drive A and Drive B, the correlation coefficient (
and
the correlation of determination ( r 2 ) .
[6]
2.1.5. Use the data from Drive A and display the shape of the data in the form of a
histogram and its exponential fit.
[4]
QUESTION 3 [30 MARKS]
3.1 Project Hope Namibia {PHN) hired 3 unemployed youth to do in-home care for elderly
people at the Senior Park in Pioneers Park, Windhoek so that the elderly can remain
independent and stay in their homes as long as possible. The students do cleaning, yard work,
shopping, etc. The PHN employed 5 students from NUST to interview the seniors in their
homes and assessing their need for services. The information is used to match the seniors
with the students who want employment:
The following variables were used to collect data about the elderly people:
• Age at last birthday {"age"):
• Sex of respondent {"sex"):
1 = Male
2 = Female
• Lives alone {"alone"):
l=Yes
2=No
• Low income {"lowincome"):
1 = Eligible for Supplemental Security Income,
2 = Not Eligible for Supplemental Security Income
• Need for assistance with the activities of daily living {"ADL"):
1 = Bathing
2 = Dressing
3 = Toileting
Applied Mathematical and Statistical Computing (AMS6025)
4
l51 Opportunity November 202•
|
|
5 Page 5 |
▲back to top |
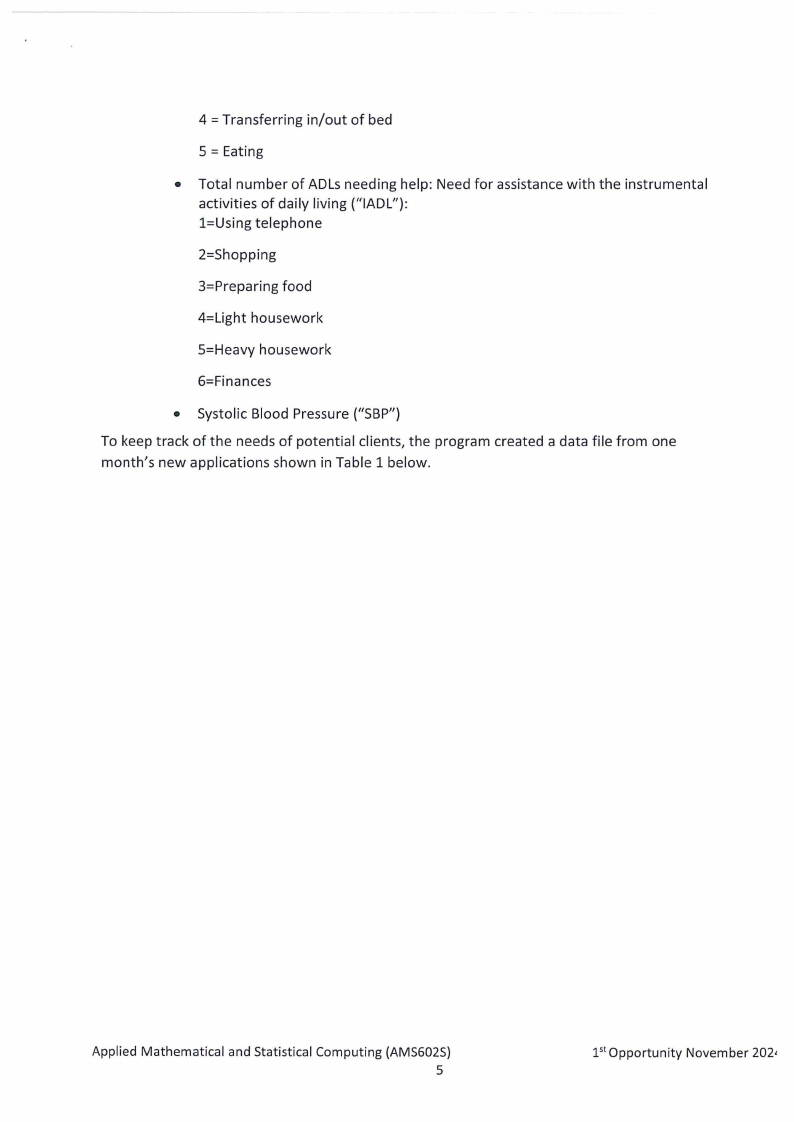
4 = Transferring in/out of bed
5 = Eating
• Total number of ADLs needing help: Need for assistance with the instrumental
activities of daily living ("IADL"):
l=Using telephone
2=Shopping
3=Preparing food
4=Light housework
S=Heavy housework
6=Finances
• Systolic Blood Pressure ("SBP")
To keep track of the needs of potential clients, the program created a data file from one
month's new applications shown in Table 1 below.
Applied Mathematical and Statistical Computing (AMS602S)
5
l51 Opportunity November 2021
|
|
6 Page 6 |
▲back to top |
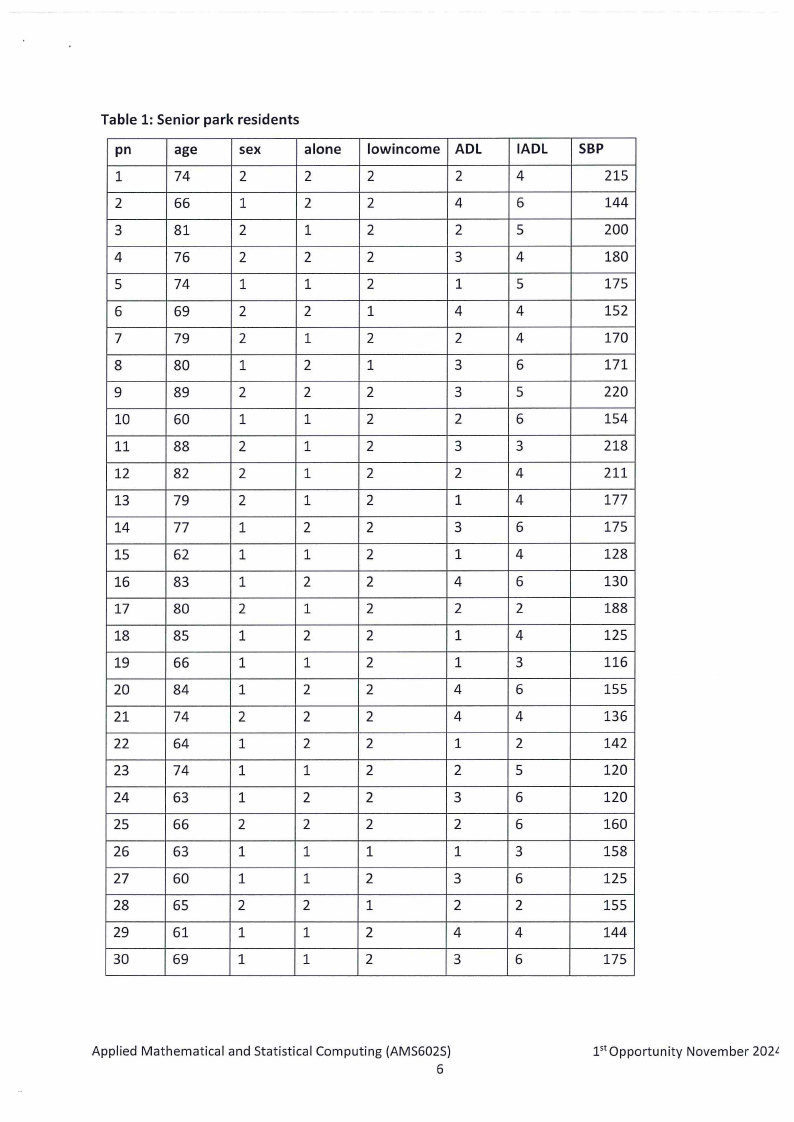
Table 1: Senior park residents
pn
age
sex
alone
1
74
2
2
2
66
1
2
3
81
2
1
4
76
2
2
5
74
1
1
6
69
2
2
7
79
2
1
8
80
1
2
9
89
2
2
10
60
1
1
11
88
2
1
12
82
2
1
13
79
2
1
14
77
1
2
15
62
1
1
16
83
1
2
17
80
2
1
18
85
1
2
19
66
1
1
20
84
1
2
21
74
2
2
22
64
1
2
23
74
1
1
24
63
1
2
25
66
2
2
26
63
1
1
27
60
1
1
28
65
2
2
29
61
1
1
30
69
1
1
lowincome ADL
2
2
2
4
2
2
2
3
2
1
1
4
2
2
1
3
2
3
2
2
2
3
2
2
2
1
2
3
2
1
2
4
2
2
2
1
2
1
2
4
2
4
2
1
2
2
2
3
2
2
1
1
2
3
1
2
2
4
2
3
IADL
4
6
5
4
5
4
4
6
5
6
3
4
4
6
4
6
2
4
3
6
4
2
5
6
6
3
6
2
4
6
SBP
215
144
200
180
175
152
170
171
220
154
218
211
177
175
128
130
188
125
116
155
136
142
120
120
160
158
125
155
144
175
Applied Mathematical and Statistical Computing (AMS602S)
6
1st Opportunity November 202L
|
|
7 Page 7 |
▲back to top |
-------------
- ---
3.1.1 Enter the data from Table 1 above into SPSSand define all the variables in SPSS.
Save your SPSSdata file in your z-drive using your initials and student number, eg.
Studentno_Q3.
[10]
3.1.2. Recode the variable "age" into "agegroup" using the following categories:
1 = 60-69 yrs
2 = 70-79 yrs
3 = 80+ yrs
Define the variable with labels and run a frequency table of the variable
"agegro up".
[2]
3.1.3. Produce frequency tables with counts and percent and appropriate graphs of the
following variables:
i. Sex of respondent ("sex")
ii. Lives alone ("alone")
iii. Need for assistance with the activities of daily living {"ADL")
iv. Need for assistance with the instrumental activities of daily living ("IADL") [8]
3.1.4. Produce descriptive statistics and a histogram with a normal curve of the
following variables:
i. Age at last birthday ("age")
ii. Systolic Blood Pressure ("SBP")
[4]
3.1.5. MoHSS would like to determine whether there is an association between the
Sex of respondent ("sex") and whether the respondent lives alone ("alone"). State the
null and alternative hypothesis. Run an appropriate test to test the hypothesis. Write
up a short narrative explaining your results.
[6]
Question 4 (25 marks}
Please use the data from Question 3.1 to answer the following questions:
4.1 What is the mean age and mean SBP of the 30 people?
[2]
Applied Mathematical and Statistical Computing (AMS602S)
7
l51 Opportunity November 202,
|
|
8 Page 8 |
▲back to top |
4.2 Carry out a simple linear regression of SBP as the dependent variable and age as the
independent variable and show the results.
[4]
4.3 State the regression equation and interpret the equation in terms of age and systolic
blood pressure.
[4]
4.4 How much of the variation in systolic blood pressure is explained by the differences in
age?
[2]
4.5 Is the regression line significant? State your hypothesis and the p-value?
[3]
4.6 If women have, on the average, lower systolic blood pressure than men, can we
conclude that this is also true in our population? Can we make an inference about the
population (all people) from our sample of 30 people selected from the population? Is the
difference statistically significant? State the p-value.
[5]
4.7 Use One-Way Analysis of Variance to compare the mean age of females and males? [5]
**************************END OFEXAMINATION*****************************
Applied Mathematical and Statistical Computing (AMS602S)
8
1st opportunity November 202L