


 |
BBS111S - BASIC BUSINESS STATISTICS 1A- 2ND OPP - JULY 2023 |
|
|
1 Page 1 |
▲back to top |

nAmlBIA
OF SCIEnCE
untVERSITY
Ano TECHnOLOGY
FACULTYOF HEALTH,NATURALRESOURCESAND APPLIEDSCIENCES
SCHOOL OF NATURAL AND APPLIED SCIENCES
DEPARTMENT OF MATHEMATICS, STATISTICSAND ACTUARIAL SCIENCE
QUALIFICATIONS : B. Business Adm in, B. Marketing, B. Human Resource Management, B.
Public Management and B. Logistics and Supply Chain Management
QUALIFICATION CODES:21BBAD / 07BMAR /
07BHR / 24BPN / 07BLSM
LEVEL: 6
COURSE: BASIC BUSINESSSTATISTICSlA
COURSECODE: BBSlllS
DATE:JULY 2023
SESSION: 1
DURATION: 3 HOURS
MARKS: 100
SUPPLEMENTARY/SECONDOPPORTUNITY EXAMINATION QUESTION PAPER
EXAMINER(S}
MR E. MWAHI, MRS. KASHIHALWA, MR J. AMUNYELAD, R.J. MWANYEKANGE,
MR A. ROUX,MS. N. PONHOYOMWENE
MODERATOR:
MR J. SWARTZ
THIS QUESTION PAPER CONSISTS OF 6 PAGES
(Including this front page)
INSTRUCTIONS
1. Answer all the questions and number your solutions correctly.
2. Question 1 of this question paper entails multiple choice questions with options A to
D. Write down the letter corresponding to the best option for each question.
3. For Question 2, 3, 4 & 5 you are required to show clearly all the steps used in the
calculations.
4. All written work MUST be done in blue or black ink.
1. Non-Programmable
PERMISSIBLE MATERIALS
Calculator
ATTACHMENTS
1. None
1
|
|
2 Page 2 |
▲back to top |
QUESTION 1
[20 MARKS]
Write down the letter corresponding to the best answer for each question.
1.1 Which one of the following variables is not categorical?
[2]
A. Age of a person.
B. Gender of a person
C. Choice on a test item
D. Marital status of a person
1.2 Which one of these statistics is unaffected by outliers?
[2]
A. Mean
B. Interquartile range
C. Standard deviation
D. Range
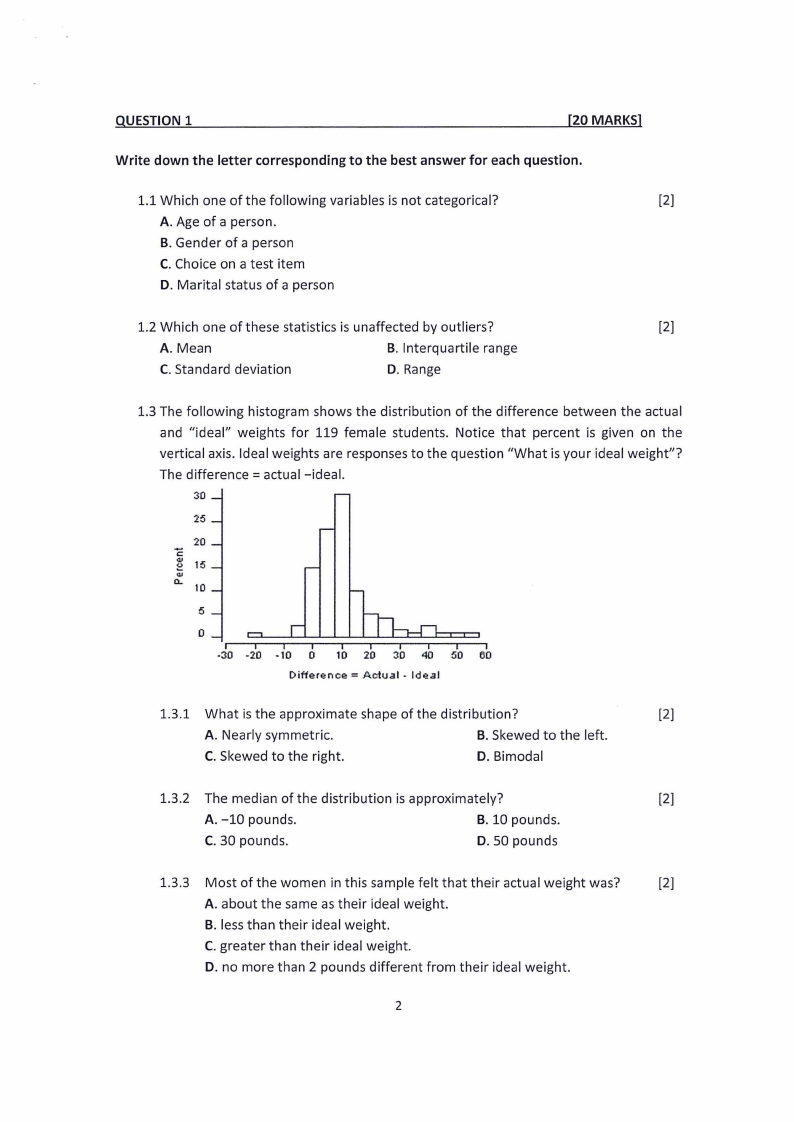
1.3 The following histogram shows the distribution of the difference between the actual
and "ideal" weights for 119 female students. Notice that percent is given on the
vertical axis. Ideal weights are responses to the question "What is your ideal weight"?
The difference =actual-ideal.
30
25
.... 20
C
(11 15
C1I
a.. 10
5
0
-30 -20 -10 0 10 20 30 40 50 60
Difference= Actual - Ideal
1.3.1 What is the approximate shape of the distribution?
[2]
A. Nearly symmetric.
B. Skewed to the left.
C. Skewed to the right.
D. Bimodal
1.3.2 The median of the distribution is approximately?
[2]
A. -10 pounds.
B. 10 pounds.
C. 30 pounds.
D. 50 pounds
1.3.3 Most of the women in this sample felt that their actual weight was?
[2]
A. about the same as their ideal weight.
B. less than their ideal weight.
C. greater than their ideal weight.
D. no more than 2 pounds different from their ideal weight.
2
|
|
3 Page 3 |
▲back to top |
1.4 If P(A) = 0.10, P(B) = 0.40, and P (A and B) = 0, then A and Bare:
[2]
A. statistically dependent events
B. statistically independent events
C. mutually exclusive events
C. collectively exhaustive events
1.5 You calculate the probability of an event, and it turns out to be 0.7, you know
that
[2]
A. the event is certainly going to happen.
B. the event is probably not going to happen.
C. the probability of it not happening is 0.3.
D. you made a mistake.
1.6 A storeowner plans to have his annual "Going out of Business Sale". If each month
has an equal chance of being selected, find the probability that the sale will be in a
month that begins with letter J or A.
[2]
A. 2_
12
B. _!_
4
o.2
2
1.7 A test contains two multiple choice questions, each question having four possible
answers. If a student makes a random guess to answer each question, what is the
probability that both answers are correct.
[2]
A. 0.25
B. 0.0625
C. 0.5
D. 0.75
1.8 If P (A)= 0.10, P (B) = 0.40 and P (A and B) = 0.03, then A and Bare:
[2]
A. Statistically dependent events
C. Non-mutually exclusive events
B. Statistically independent events
D. Mutually exclusive events
3
|
|
4 Page 4 |
▲back to top |

=Q=U-=E=S..:...;Tl=--=Oc..:...N:....:2=-----------------------[21
MARKS]
2.1 For each of the following random variables, determine whether the variable is
categorical or numerical. If the variable is numerical, determine whether it is discrete
or continuous.
[6]
2.1.1 Amount of time spent shopping for clothing in the last month.
2.1.2 Primary type of transportation used when shopping for clothing.
2.1.3 Number of pairs of winter gloves owned.
2.1.4 Most likely time-period during which shopping for clothing takes place.
2.2 One of the primary major measures of the quality of service provided by any
organisation is the speed with which the organisation responds to customer
complaints. The following data represents the number of days between the receipt
of the complaint and the resolution of the complaint at OK furniture in Windhoek.
54 5
35 13 31 27 15 2
12 81 74 27 11
19 12 11 11 29 61 35 94 31 26 5
12 4
16 32 29 28 29 26 25 1
14 13 13 10 5
75
2.2.1 Place the data in an ordered array.
[2]
2.2.2 Set up a stem-and-leaf display for these data.
[5]
2.2.3 Comment on the shape of the distribution you observe in (2.2.2)
[2]
2.2.4 Using classesO- < 15, 15 - < 30, 30 - < 45 etc, construct a frequency distribution
table for these data.
[6]
QUESTION3
(19 marks]
3.1 Bank Windhoek has developed an improved process of serving customers during the
12:00 to 13:00 peak lunch period. The waiting time in minutes of all customers during
this hour is recorded over a period of one week. A random sample of 15 customers is
selected and the results are as follows:
4.21 5.55 3.02 5.13 4.77 2.34 3.54 3.20 4.50 6.10 0.38 5.12
6.46 6.19 3.79
3.1.1 Compute the mean, median and mode for the data, interpret your results. [7]
4
|
|
5 Page 5 |
▲back to top |

3.1.2 Compute the variance and standard deviation for the data.
[4)
3.2 Seventy-six motorists in Okakarara were asked to record for the month of February
2023, the amount of money they spent on petrol purchases. The following distribution
table shows their purchases:
Petrol purchase {N$}
0-< 50
50 - < 100
100 - < 150
150 - < 200
200 - < 250
250 - < 300
Number of motorists
4
11
8
16
22
15
3.2.1 Find the mean amount spent on petrol during February 2023 by these
motorists
[4]
3.2.2 Find the modal amount spent on petrol during February 2023 by these
motorists
[4]
~Q~U~ES~T~_IO__~_N_~_4________________
[26 MARKS]
4.1 In a city, 65% of people drink coffee, 50% drink tea, and 25% both. A person is
chosen at random from this city.
4.1.1 What is the probability that he/she drink at least one of coffee or tea? [2]
4.1.2 What is the probability that he/she drink neither coffee nor tea?
[2]
4.2 According to first year student records at NUST,40% of the students were in the top
10% of their high school class, and that 65% are foreigners, of whom 25% were in the
top 10% of their high school class. What is the probability that a first-year student
selected randomly from this university either was in the top 10% of his or her high
school class or is a foreigner?
[3]
4.3 Consider an experiment in which each of three cars exiting from a university main
entrance turns right (R) or left (L). Assume that a car will turn right or left with equal
probability of 1/2.
4.3.1 What is the sample space 5?
[2]
4.3.2 What is the probability that at least one car will turn left?
[2]
5
|
|
6 Page 6 |
▲back to top |

4.3.3 What is the probability that at most one car will turn left?
[3]
4.3.4 What is the probability that exactly two cars will turn left?
[3]
4.4 Suppose a statistics class contains 70% male and 30% female students. It is known
that in a test, 5% of males and 10% of females got an "A" grade.
4.4.1 If one student from this class is randomly selected, what is the probability that.
he/she has an "A" grade?
[3]
4.4.2 If one student from this class is randomly selected and observed to have an
"A" grade, what is the probability that this is a male student?
[4]
4.4.3 If one student from this class is randomly selected, what is the probability that
he/she does not have an "A" grade?
[2]
~Q~U_ES_T__IO____N___5_______________
[14 MARKS]
5.1 The table below shows the probability distribution table of a discrete random
variable X.
X=x
0
3
5
7
9
P(x)
0.05
0.35
0.25
k
0.25
5.1.1 Show that k = 0.1
5.1.2 Find P(X:,;; 5)
5.1.3 Find the expectation E(X) and Var(X)
5.1.4 Find Var(3X -4)
[2]
[2]
[3, S]
[2]
"'"'ENDOF EXAMINATION PAPER"'"'
6