


 |
CSE511S-CONSERVATION ECOLOGY 1-2ND OPP- JULY 2025 |
|
|
1 Page 1 |
▲back to top |
nAmlBIA UnlVERSITY
OF SCIEnCE Ano TECHnOLOGY
FACULTY OF HEALTH, NATURAL RESOURCES AND APPLIED SCIENCES
DEPARTMENT OF NATURAL RESOURCES SCIENCES
QUALIFICATION: BACHELOR of NATURAL RESOURCE MANAGEMENT (NRM)
QUALIFICATION CODE: 07BNRS
LEVEL: 7
COURSE CODE: CSE511S
COURSE NAME: CONSERVATION ECOLOGY1
SESSION: JULY 2025
DURATION: 3 HOURS
PAPER: THEORY
MARKS: 150
SECOND OPPORTUNITY EXAMINATION QUESTION PAPER
EXAMINER(S)
Mr. J. Amutenya and Prof. T.D. Wassenaar
MODERATOR:
Mr. H. Tjikurunda
INSTRUCTIONS
1. Answer ALL the questions.
2. Read all the questions carefully before answering.
3. Number the answers clearly
4. Make sure your name and surname, question number and the
date appear on the answer script.
5. Please ensure that your writing is legible, neat and presentable.
THIS QUESTION PAPER CONSISTS OF 6 PAGES (Including this front page)
|
|
2 Page 2 |
▲back to top |
QUESTION 1
Write short notes to define or explain the following scientific terms:
1.1. Predation
(1)
1.2. Co-evolution
(2)
1.3. Ecotones
(2)
1.4. Ecosystem engineers
(3)
1.5. Trophic cascade
(2)
[10]
QUESTION 2
Explain the difference between the following pairs of terms.
2.1. Sympatric vs. Allopatric
(2)
2.2. Hemiparasites vs Holoparasites
(2)
2.3. lntraspecific vs. lnterspecific competition
(2)
2.4. Grazing food chain & Detritus food chain
(2)
2.5. Structural vs. Functional connectivity
(2)
[10]
QUESTION 3
Match definitions or examples with correct words (write the number and alphabet). (10)
Definitions or examples
Words
1.1. The environmental factors that support (and
a) Life Histories
influence) the growth, survival and reproduction of
b) Mortality curves
a species.
c) Intermediate
1.2. Species that create, modify and maintain habitats,
Disturbance Hypothesis
by shaping the habitat to their own needs,
d) Ecosystem engineers
subsequently altering the availability of
e) Ecological succession
microhabitats, food, water, sunlight and shelter for
f) Landscape connectivity.
other species, thus making other species' existence
g) Colonisation
possible in a community.
h) Keystone species
1.3. A hypothesis that predicts that local species
i) Natural selection
diversity is maximised when an ecological
j) Ecological niche
disturbance is neither too rare nor too frequent.
k) Keystone species
1.4. The sequence of events related to survival and
I) Mortality curves
reproduction that occur from birth through death.
m) Endemic species
1.5. A type of survivorship curve in which individuals
n) Dispersal
tend to live out their physiological life span and
o) Population size
produce few offspring but provide extensive
p) Ubiquitous species
parental care.
q) Evolution
1.6. A species whose geographic distribution is limited
r) Type Ill
to a specific area or spatial unit (such as a country
s) Population density
or a biome).
t) Type I
1.7. A process in which individual organisms or
phenotypes that possess favourable traits are more
likely to survive and reproduce.
1.8. The process of change in the species structure of an
ecological community over time.
|
|
3 Page 3 |
▲back to top |
1.9. The number of individuals per unit area.
1.10. The degree to which the landscape facilitates or
impedes the movement of organisms among
patches.
QUESTION 4
Choose the correct answer.
4.1. The "O" horizon in a soil profile typically contains:
(1)
A. Bedrock
B. Weathered parent material
C. Organic matter
D. Mineral salts
4.2. Which soil type is most commonly found in the eastern part of Namibia?
(1)
A. Calcisols
B. Gypsisols
C. Arenosols
D. Fluvisols
4.3. Which of the following is an example of qualitative chemical defence in plants? (1)
A. Tannins
B. Resins
C. Spines
D. Alkaloids
4.4. What is the best definition of an ecological niche?
(1)
A. The place where an organism lives
B. The environmental factors that support a species' survival, growth, and
reproduction
C. The number of organisms in an ecosystem
D. The competition between different species
4.5. Which of the following organisms is an example of a specialist species?
(1)
A. Ring-necked dove
B. Camelthorn tree
C. Husab Sand Lizard
D. House sparrow
4.6. Which factor is NOT used to define population structure?
(1)
A. Age structure
B. Population density
C. Sex ratio
D. Species diversity
4.7. What happens when a population reaches its carrying capacity in the logistic (1)
growth model?
A. The population keeps increasing indefinitely
B. The population size stabilises as birth rates equal death rates
C. The population stops reproducing
D. The population crashes completely
2
|
|
4 Page 4 |
▲back to top |
4.8. What is the main factor that has allowed human populations to grow
exponentially?
A. Predation
B. Resource limitation
C. Advances in technology and healthcare
D. Increased competition for resources
4.9. What is a defining characteristic of top-down control in an ecosystem?
A. The abundance of predators controls the population of prey
B. Plant growth determines the number of herbivores
C. Competition among primary producers determines ecosystem
stability
D. Climate conditions regulate food availability
4.10 Which of the following best defines ecological succession?
A. The complete extinction of a species in an ecosystem
B. The replacement of one community by another over time
C. The spread of invasive species in an ecosystem
D. A random process with no predictable pattern
QUESTION 5
Indicate whether the following sentences are true or false.
5.1. Increased population density in some animal species leads to increased stress,
which can suppress immune function.
5.2. Mimicry is a defence strategy where a non-toxic species evolves to resemble
a toxic one.
5.3. Predator-prey cycles always lead to the extinction of the prey population.
5.4. Niche overlap always results in character displacement, where competing
species evolve different traits to reduce competition.
5.5. Species Distribution Models (SDMs) help predict where a species will likely be
found based on environmental factors.
5.6. Natality refers to the number of individuals that leave a population due to
emigration.
5.7. A population pyramid is a graphical representation of the sex ratio only.
5.8. A more heterogeneous habitat generally supports greater species diversity.
5.9. Top-down and bottom-up control mechanisms are independent of each other
and do not interact.
5.10. Primary succession occurs faster than secondary succession.
QUESTION 6 (Units 1: The environment)
6.1. What is plant-available soil moisture (PAM), and why is it important in arid
regions like Namibia?
6.2. Why is the anthroposphere considered inefficient compared to the biosphere?
6.3. Arid soils dominate Namibia's pedosphere. List and explain the dominant soil
groups of Namibia.
(1)
(1)
(1)
[10]
(1)
(1)
(1)
(1)
(1)
(1)
(1)
(1)
(1)
(1)
[10]
(3)
(3)
(8)
[14]
3
|
|
5 Page 5 |
▲back to top |
QUESTION 7 (Unit 3: Species)
7.1. Explain why the logistic growth curve/model is more realistic in describing
(2)
population growth than the exponential growth curve/model.
7.2. What is predator saturation, and how does it help prey species survive predation? (3)
7.3. The ecological niche has three distinct meanings among scientists, each with an (6)
associated conceptual basis. Name and explain these three distinct meanings
and indicate which is the most common in nature.
[11]
QUESTION 8 (Unit 4: Populations)
8.1. Define carrying capacity and explain how it is included in the logistic growth (3)
model.
8.2. Explain how intraspecific competition can lead to changes in the physical traits (2)
(phenotypic plasticity) of animals.
8.3. In animals, increased crowding and social contact cause stress, which triggers (6)
hormonal changes.
8.3.l Explain what is meant by increased crowding and social contact in (1)
the context of population density.
8.3.2 Describe the physiological response of animals to stress caused by (2)
high population density.
8.3.3 List three {3} biological consequences of the hormonal changes (3)
triggered by this stress.
[11]
QUESTION 9 (Unit 5: Communities)
9.1. What parameters can one use to measure the size of the community?
(3)
9.2. Name the two attributes ecologists use to measure physiognomy (physical) (2)
species diversity.
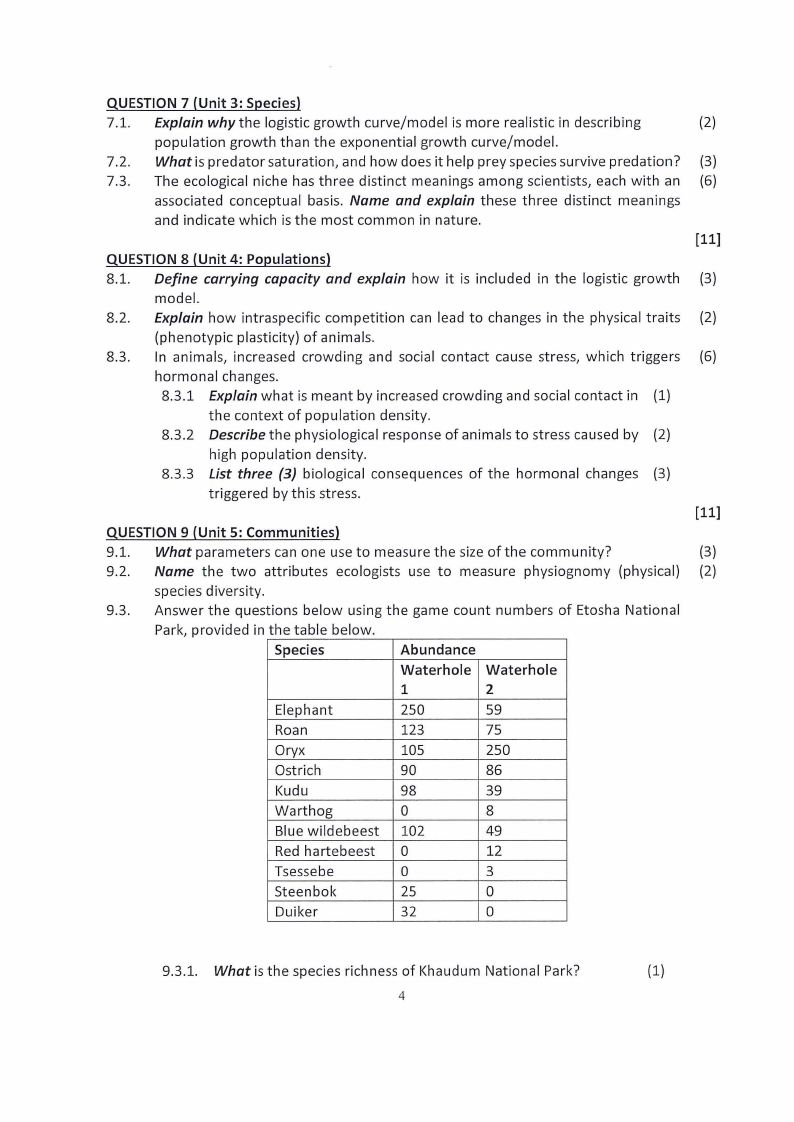
9.3. Answer the questions below using the game count numbers of Etosha National
Park, provided in the table below.
Species
Abundance
Waterhole Waterhole
1
2
Elephant
250
59
Roan
123
75
Oryx
105
250
Ostrich
90
86
Kudu
98
39
Warthog
0
8
Blue wildebeest 102
49
Red hartebeest 0
12
Tsessebe
0
3
Steenbok
25
0
Duiker
32
0
9.3.1. What is the species richness of Khaudum National Park?
(1)
4
|
|
6 Page 6 |
▲back to top |
9.3.2. Using the Bray-Curtis Similarity index (H), compare the similarity (15)
of the two waterholes found in Etosha National Park.
[21)
QUESTION 10 (Unit 6: Ecosystems)
10.1. Place/Rank the following Namibian ecosystems (the Namib Desert, Woodland (6)
Savanna in the Zambezi Region, north-eastern part of Namibia and the Highland
Savanna, central Namibia, including Windhoek) from the highest to lowest (1- 3)
Primary productivity and provide the reasons for your ranking (motivate). In
other words, which ecosystem is expected to have the highest, moderate, and
lowest primary productivity, and why?
10.2. Describe the main processes involved in decomposing organic matter in (10)
terrestrial ecosystems. In your answer, identify the biological and physical agents
responsible for each process and explain how these processes contribute to
nutrient cycling.
[16)
QUESTION 11 (Unit 7: Landscapes)
11.1. Discuss the role of humans in the fragmentation of landscapes and the possible (4)
consequences of such practices.
11.2. Name and explain the four (4) elements that make up the structure of a (8)
landscape.
11.3. Metapopulation dynamics differs from normal population dynamics in that it is (3)
governed by two sets of processes operating at two distinct spatial scales. Name
and explain those processes.
[15)
QUESTION 12 (Unit 8: Global ecology)
12.1. Climate change significantly impacts biodiversity, influencing species and (6)
ecosystems in multiple ways. Identify and describe six major ways in which
biodiversity is affected by climate change.
12.2. The Millennium Ecosystem Assessment (MEA) presented key findings on the state (6)
and trends of global biodiversity. Summarise the main findings of the Millennium
Ecosystem Assessment regarding biodiversity.
[12)
TOTAL: 150 marks
5