DAE702S - DESIGN AND ANALYSIS OF EXPERIMENT - 1ST OPP - NOVEMBER 2023


DAE702S - DESIGN AND ANALYSIS OF EXPERIMENT - 1ST OPP - NOVEMBER 2023


1 Pages 1-10

▲back to top


1.1 Page 1

▲back to top


nAmlBIA UnlVERSITY
OF SCIEnCEAnDTECHnOLOGY
FacultyofHealthN, atural
ResourceasndApplied
Sciences
Schoolof NaturalandApplied
Sciences
Departmentof Mathematics,
StatisticsandActuarialScience
13JacksonKaujeuaStreet
PrivateBag13388
Windhoek
NAMIBIA
T: ~254612072913
E: msas@nust.na
W:www.nust.na
I QUALIFICATION:
QUALIFICATION
I CODE:
I COURSE:
I DATE:
I DURATION:
BACHELOR OF SCIENCE IN APPLIED MATHEMATICS AND I
STATISTICS
07BAMS
I LEVEL: 7
I
I DESIGN AND ANALYSIS OF EXPERI- , COURSE DAE702S
MENT
CODE:
NOVEMBER 2023
I SESSION: 1
3 HOURS
I MARKS: 100
FIRST OPPORTUNITY
I EXAMINER
I MODERATOR
EXAMINATION
QUESTION PAPER
I Dr. Jacob Ong'ala
I Dr Petrus Iiyambo
INSTRUCTION
l. Answer all questions on the separate answer sheet.
2. Please write neatly and legibly.
3. Do not use the left side margin of the exam paper. This must be allowed for the examiner.
4. No books, notes and other additional aids are allowed.
5. Mark all answers clearly with their respective question numbers.
PERMISSIBLE MATERIALS
l. Non-Programmable Calculator
ATTACHEMENTS
l. F distribution table
2. OC Curves for the Fi..xedmodel Analysis of Variance
3. t distribution table
THIS QUESTION PAPER CONSISTS OF 4 PAGES
(including the front page)
1

1.2 Page 2

▲back to top


QUESTION ONE - 26 MARKS
(a) Discuss the basic principles of experimental design
[6 mks]
(b) Rats were given one of four different diets at random, and the response measure was liver
weight as a percentage of body weight. The responses were:
Treatment
1
2
3
4
3.52 3.47 3.54 3.74
3.36 3.73 3.52 3.83
3.57 3.38 3.61 3.87
4.19 3.87 3.76 4.08
3.88 3.69 3.65 4.31
3.76 3.51 3.51 3.98
3.94 3.35
3.86
3.64
3.71
(i) Formulate the hypothesis when fixed effect model is assumed
[2 mks]
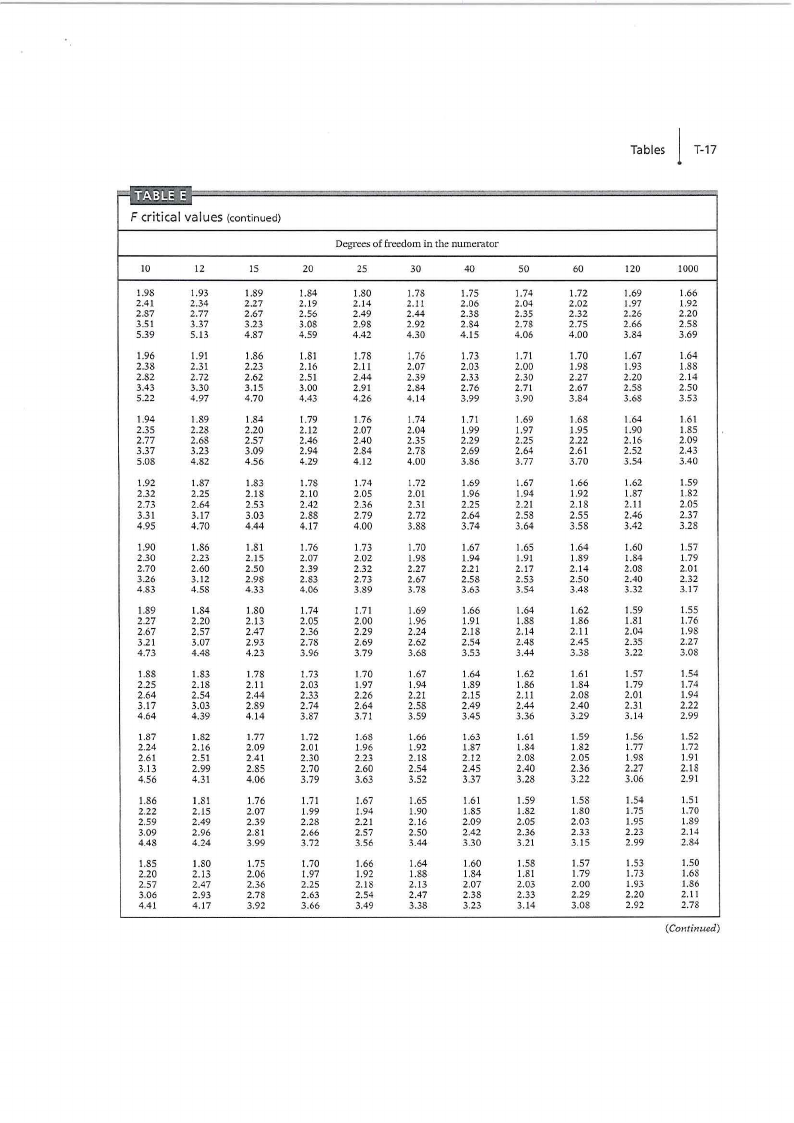
(ii) Compute the Analysis of Variance table for these data. What would you conclude
about the four diets?
[13 mks]
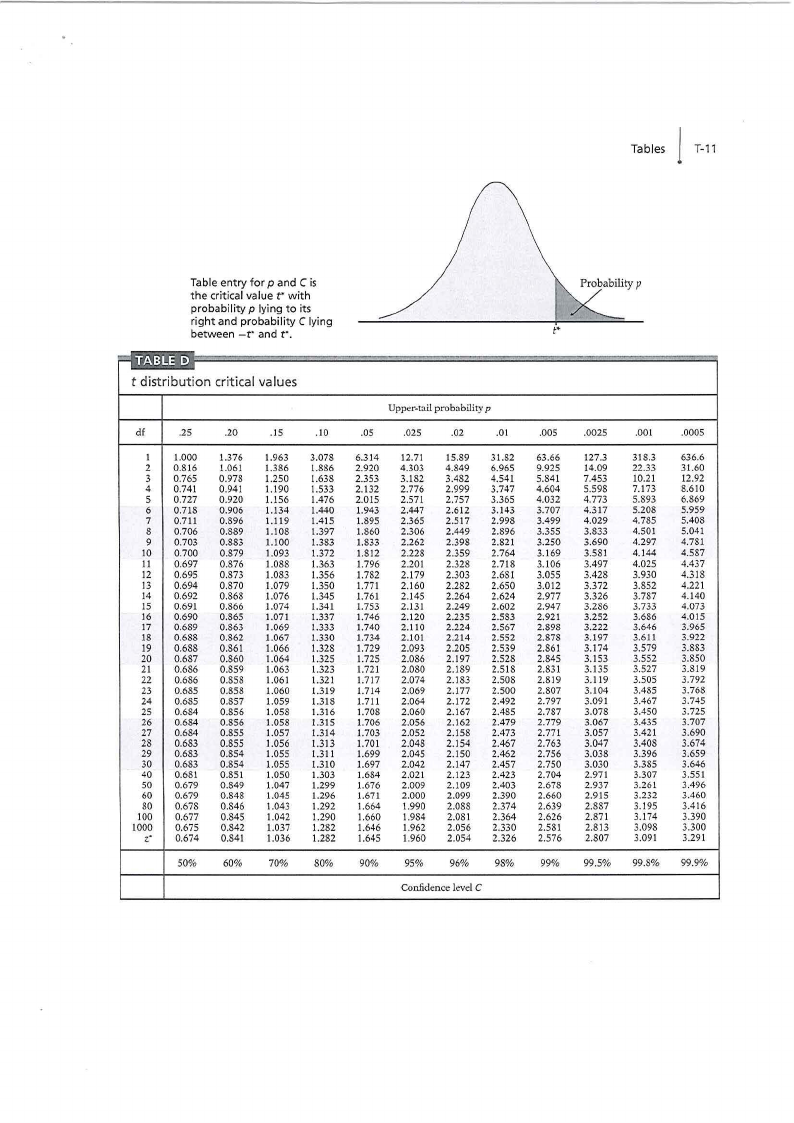
(iii) Construct a 99 percent confidence interval estimate of the mean response for treatment
3.
[5 mks]
QUESTION TWO - 28 MARKS
(a) In many integrated circuit manufacturing steps, wafers are completely coated with a layer
of material such as silicon dioxide or a metal. The unwanted material is then selectively
removed by etching through a mask, thereby creating circuit patterns, electrical intercon-
nects, and areas in which diffusions or metal depositions are to be made. Energy is supplied
by a radio frequency (RF) generator causing plasma to be generated in the gap between the
electrodes. The chemical species in the plasma are determined by the particular gases used.
An engineer is interested in investigating the relationship between the RF power setting
and the etch rate for this tool. The objective of an experiment is to model the relationship
between etch rate and RF power, and to specify the power setting that will give a desired
target etch rate. She wants to test four levels of RF power: 160W, 180W, 200W, and 220W.
Past experience indicate that mean etch rate for each RF power are µ 1= 573 , µ2 = ,593,
µ3= 629 and µ4= 681. Suppose that the experimenter is interested in rejecting the null
hypothesis with a probability of at least 0.90 and she feels that the standard deviation of
etch rate at any particular level of power will be no larger than CJ = 30 A/min. and she
plans to use o: = 0.01.
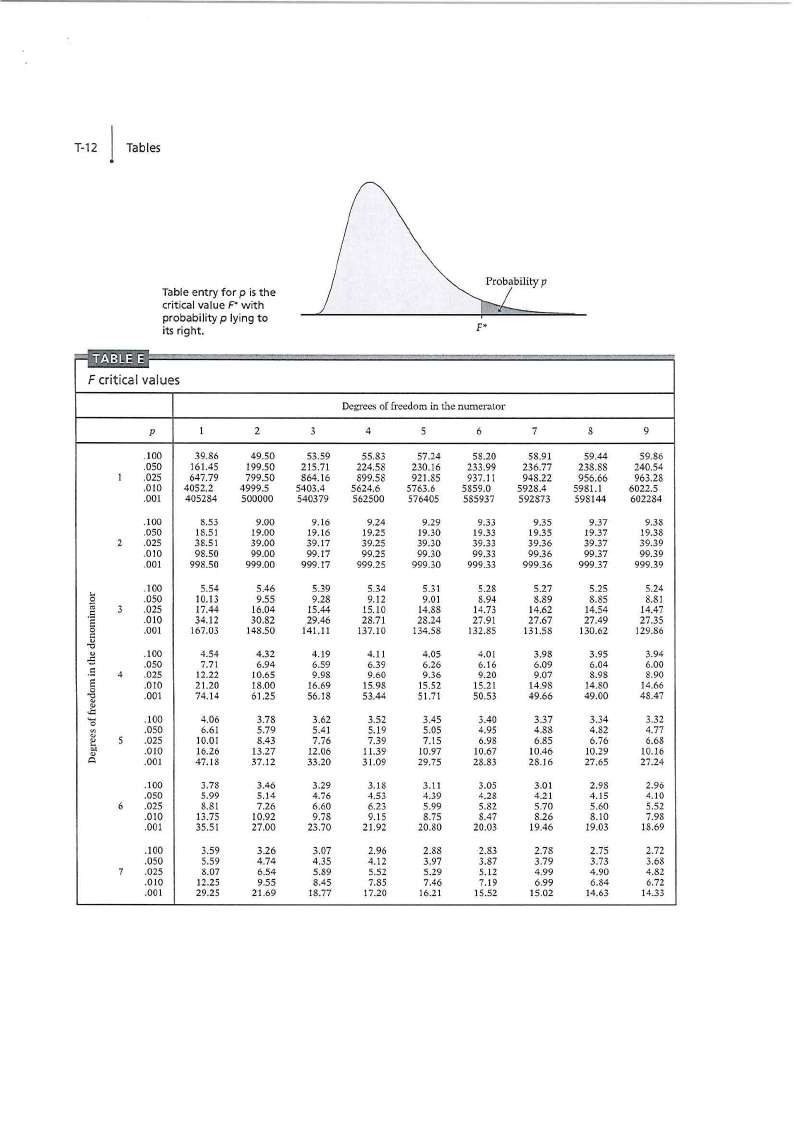
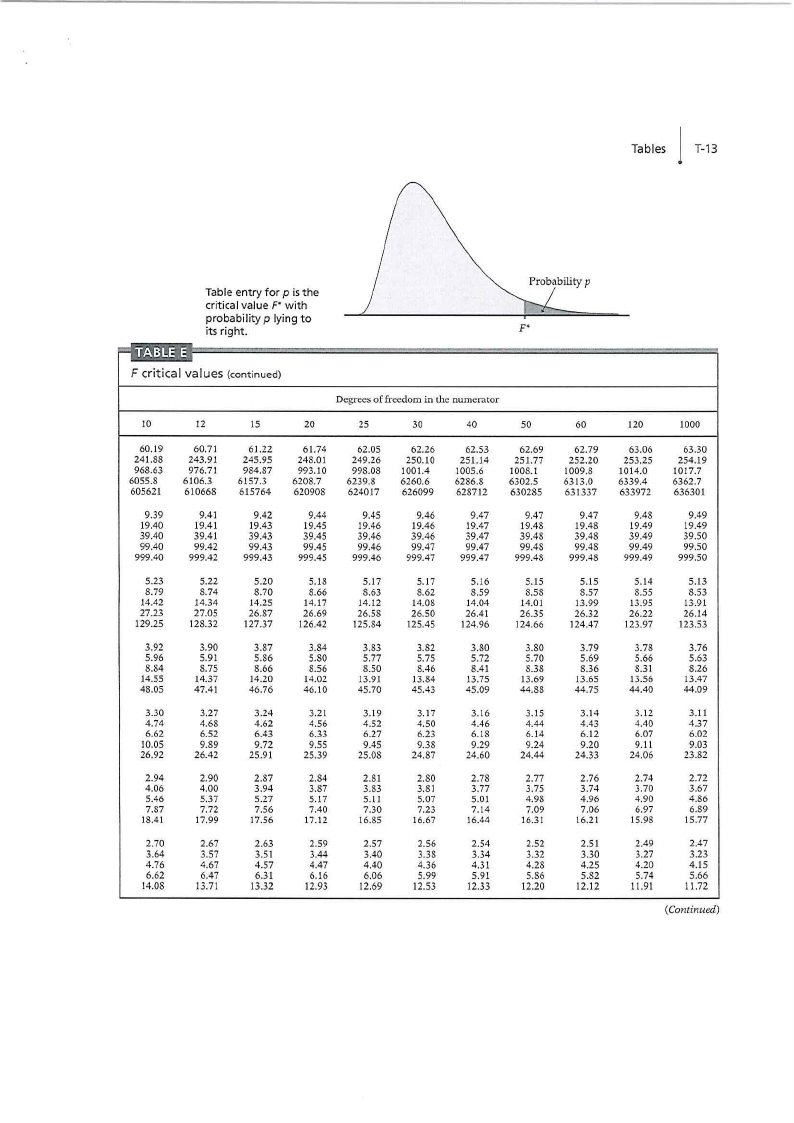
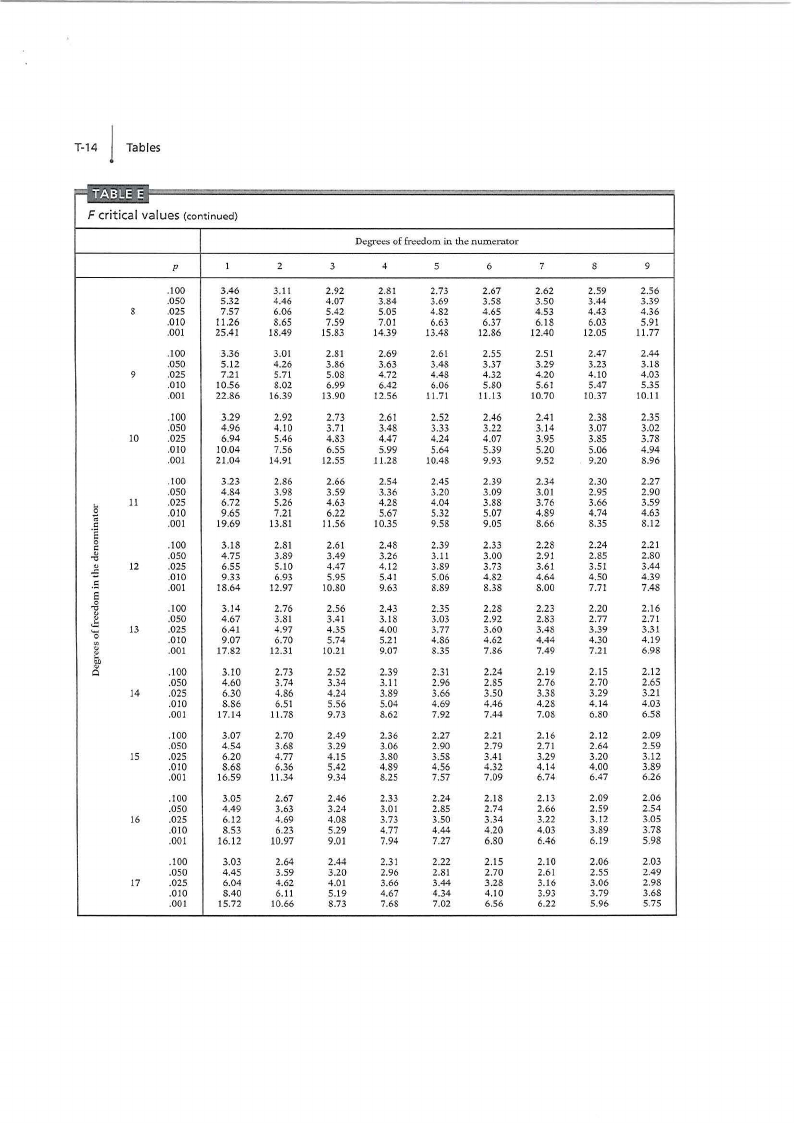
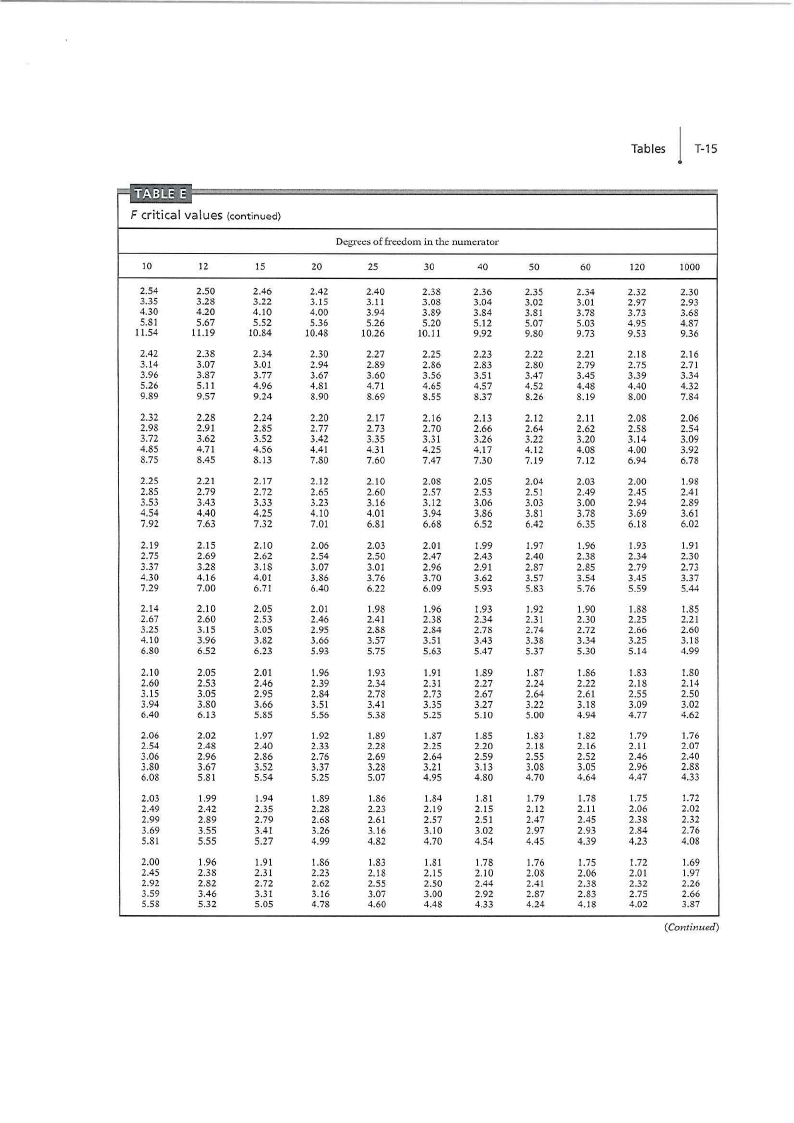
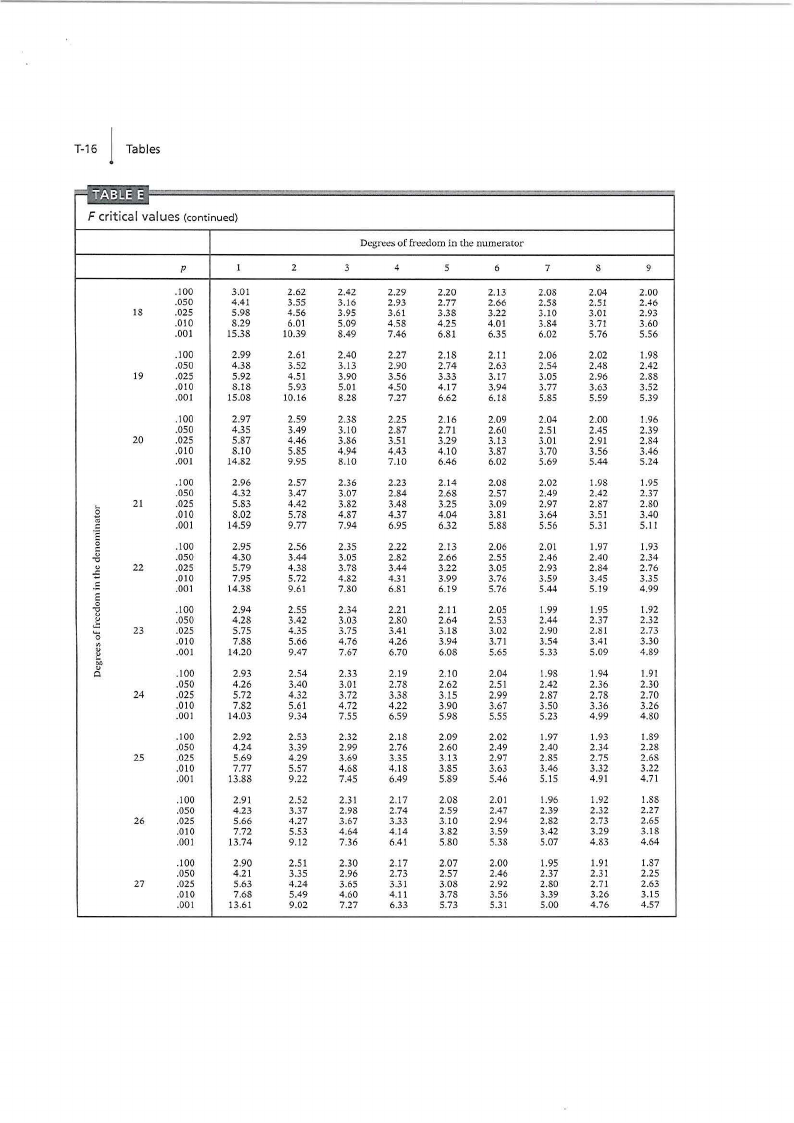
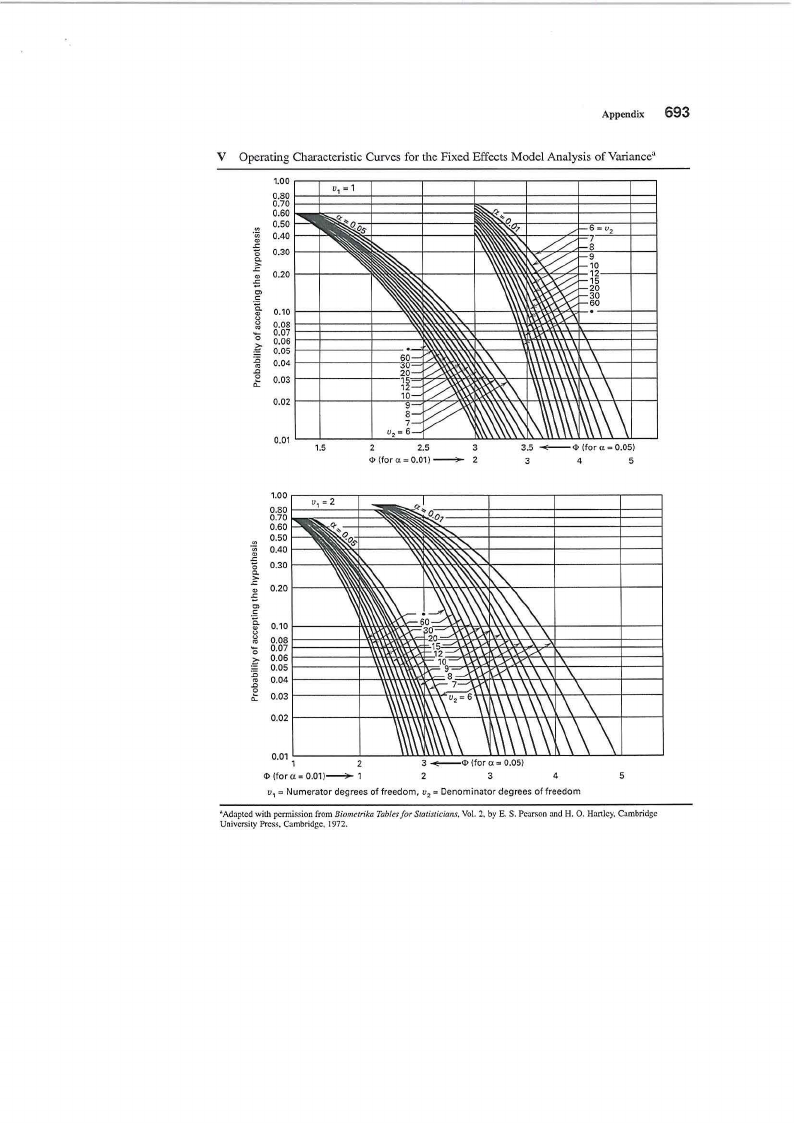
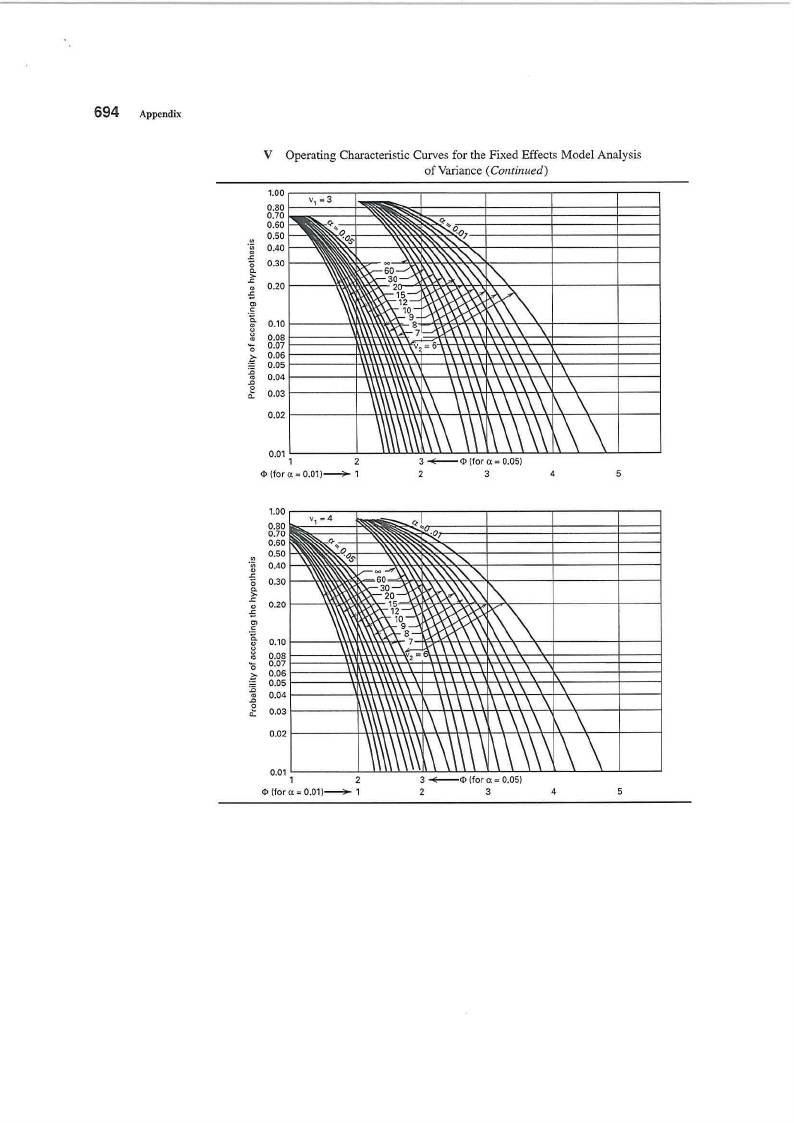
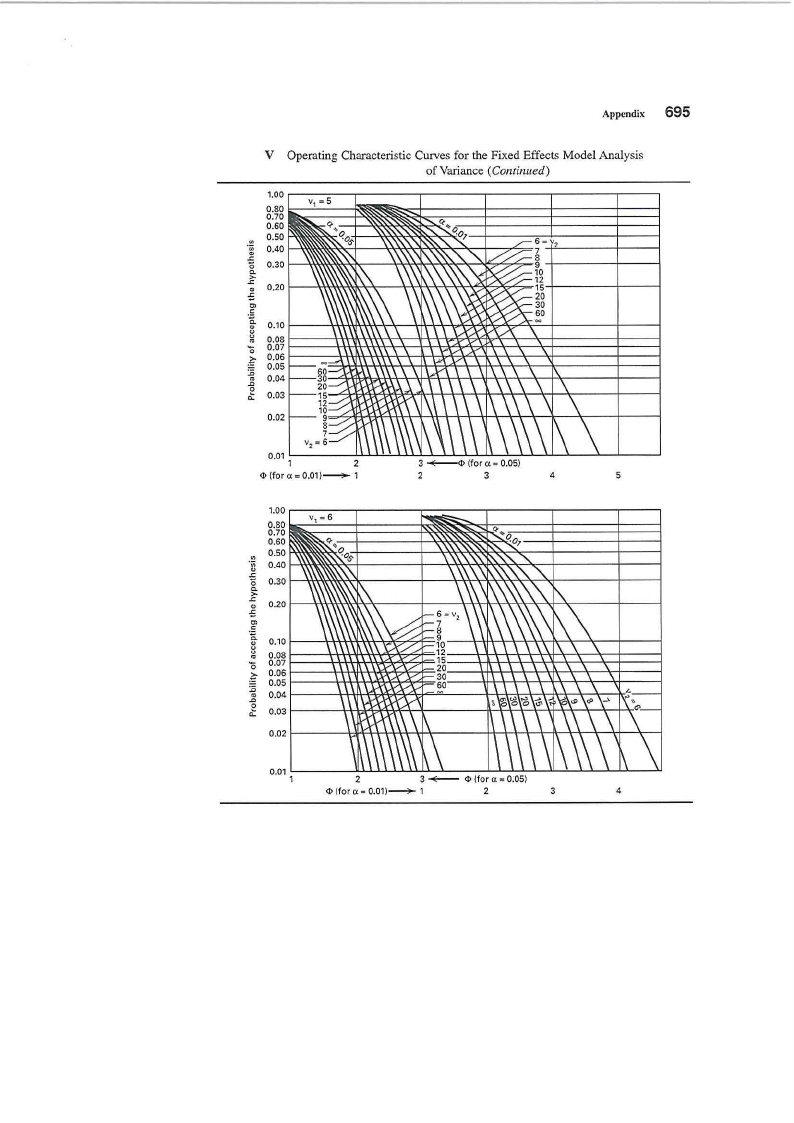
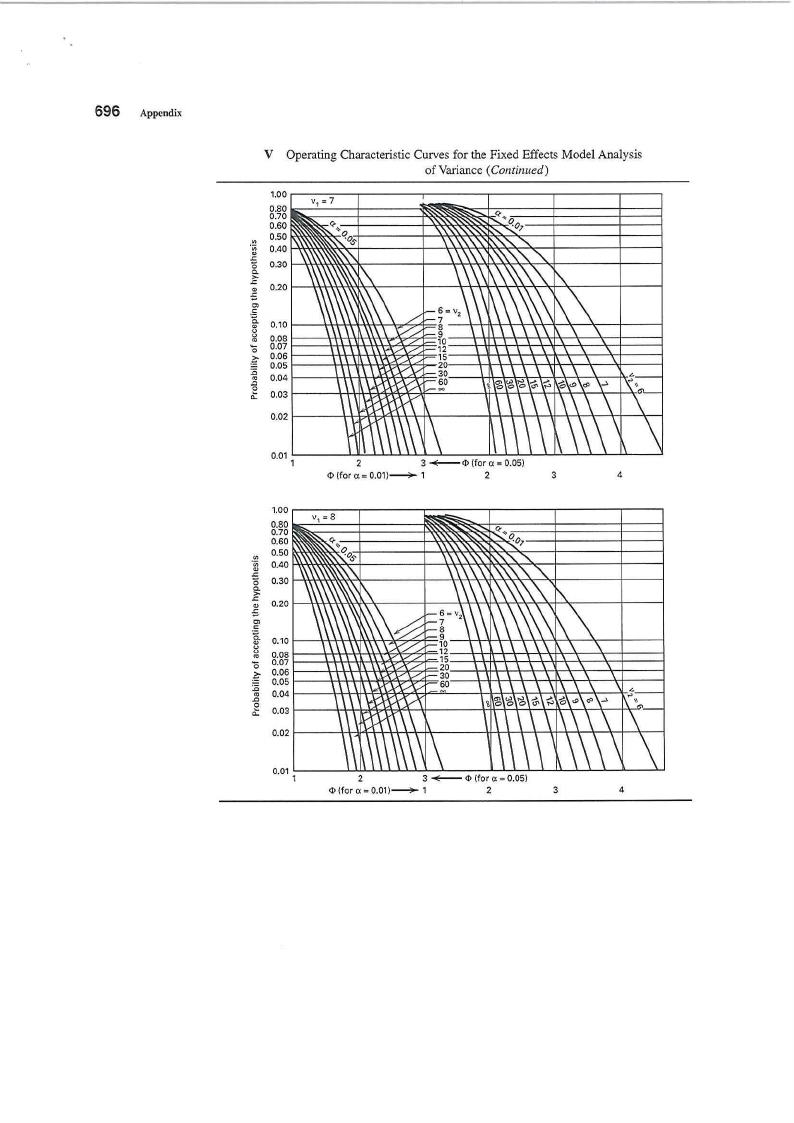
(Note: Use the Operating Characteristic Curves for the Fixed Effects Model Analysis of
Variance)
(i) Compute the treatment effect for each RF power using the above information
[2
mks]
(ii) Starting with an initial sample 3, determine the recommended minimum sample size
(n*)for each treatments that is required to obtain power of 0.90
[11 mks)
2

1.3 Page 3

▲back to top


(b) Suppose you want to determine whether the brand of laundry detergent used and the
temperature affects the amount of dirt removed from your law1dry. To this end, you buy two
different brand of detergent (" Super" and "Best") and choose three different temperature
levels ("cold", "warm", and "hot"). Then you divide your laundry randomly into 6xr piles
of equal size and assign each r=4 piles into the combination of ("Super" and "Best") and
("cold" ,"warm", and "hot"). The amounts Yijk of dirt removed when washing sub pile
k(k = 1, 2, 3, 4) with detergent i(i = 1, 2) at temperature j(j = 1, 2, 3) are recorded in the
table below.
Super
Best
Cold
4.5.6.5
6.6.4.4
Warm
Hor
7.9.8.12 10.12.11,9
13.15.12.12 12.13.10.13
(i) Formulate the hypotheses for this experiment
(ii) Test the hypothesis above using Analysis of Variance
(iii) What do you conclude from the ANOVA results above
QUESTION THREE - 29 MARKS
[2 mks]
[10 mks]
[3 mks]
(a) The ANOVA from a randomized complete block experiment output is shown below.
Source
Treatment
Block
Error
Total
DF
ss
MS
Fp
4 1010.56
? 29.84 ?
?
? 64.765
??
20 169.33
?
29 1503.71
(i) Fill in the blanks
(ii) How many blocks were used in this experiment?
(iii) What conclusions can you draw?
[4 mks]
[1 mks]
[2 mks]
(b) Three different washing solutions are being compared to study their effectiveness in retard-
ing bacteria growth in 5-gallon milk containers. The analysis is done in a laboratory, and
only three trials can be run on any day. Because days could represent a potential source
of variability, the experimenter decides to use a randomized block design. Observations are
taken for four days, and the data. a.re shown below
Solution
2
3
Days
1
2
3
4
13
22
18
39
16
24
17
44
5
4
22
(i) Analyze the data from this experiment. (use a:= 0.05)
[13 mks]
(ii) Use the Fisher LSD method to make comparisons among the three Solutions at a: =
0.05
[9 mks]
3

1.4 Page 4

▲back to top


QUESTION FOUR - 17 MARKS
An industrial engineer is investigating the effect of four assembly methods (A, B, C, D) on
the assembly time for a color television component. Four operators are selected for the study.
Furthermore, the engineer knows that each assembly method produces such fatigue that the
time required for the last assembly may be greater than the time required for the first, regardless
of the method. That is, a trend develops in the required assembly time. To account for this
source of variability, the engineer uses the Latin square design shown below. Analyze the data
from this e>-.-periment( a:= 0.05) and draw appropriate conclusions. (In this question, use coded
data)
Order of
Assembly
2
3
4
1
C = 10
B=7
A= 5
D = 10
Opcr.ator
2
3
D = 14
C = 18
B = 10
A= IO
A= 7
D= 11
C= 11
B = 12
4
8=8
A=8
D=9
C= 14
- END OF QUESTIONS -
4

1.5 Page 5

▲back to top


lT-12 Tables
Table entry for p is the
critical value F" with
probability p lying to
its right.
~-••:t•--
F critical values
1
2
:..
C
-"~ 3
g
OJ
-0
-5
.s 4
E
C
-0
OJ
"<..I.:...
C
<'O-JJ)
5
A""
6
7
p
1
.100
39.86
.050
161 .45
.025
647.79
.010 4052.2
.001 405284
.100
.050
.025
.DlO
.001
8.53
18.51
38.51
98.50
998.50
.100
5.54
.050
10.13
.025
17.44
.010
34.12
.001
167.03
.100
.050
.025
.QlO
.001
4.54
7.71
12.22
21.20
74.14
.100
4.06
.050
6.61
.025
10.01
.010
16.26
.001
47.18
.100
3.78
.050
5.99
.025
8.81
.010
13.75
.001
35.51
.100
3.59
.050
5.59
.025
8.07
.010
12.25
.001
29.25
2
49.50
199.50
799.50
4999.5
500000
9.00
19.00
39.00
99.00
999.00
5.46
9.55
16.04
30.82
148.50
4.32
6.94
10.65
18.00
61.25
3.78
5.79
8.43
13.27
37.12
3.46
5.14
7.26
10.92
27.00
3.26
4.74
6.54
9.55
21.69
Probability p
F*
Degrees of freedom in the numerator
3
4
5
6
7
53.59
215.71
864.16
5403.4
540379
55.83
224.58
899.58
5624.6
562500
57.24
230.16
921.85
5763.6
576405
58.20
233.99
937.11
5859.0
5S5937
58.91
236.77
948.22
5928.4
592S73
9. 16
19.16
39.17
99.17
999.17
9.24
19.25
39.25
99.25
999.25
9.29
19.30
39.30
99.30
999.30
9.33
19.33
39.33
99.33
999.33
9.35
19.35
39.36
99.36
999.36
5.39
9.28
15.44
29.46
141.1 l
4.19
6.59
9.98
16.69
56.18
5.34
9.12
15.10
28.71
137.10
4.11
6.39
9.60
15.98
53.44
5.31
9.01
14.88
28.24
134.58
4.05
6.26
9.36
15.52
51.71
5.28
S.94
14.73
27.91
132.85
4.01
6.16
9.20
15.21
50.53
5.27
8.89
14.62
27.67
131.58
3.98
6.09
9.07
14.98
49.66
3.62
5.41
7.76
12.06
33.20
3.52
5.19
7.39
11.39
31.09
3.45
5.05
7.15
10.97
29.75
3.40
4.95
6.98
10.67
28.83
3.37
4.88
6.85
10.46
28.16
3.29
4.76
6.60
9.7S
23.70
3.18
4.53
6.23
9.15
21.92
3.11
4.39
5.99
8.75
20.80
3.05
4.28
5.S2
8.47
20.03
3.01
4.21
5.70
8.26
19.46
3.07
4.35
5.S9
8.45
1S.77
2.96
4.12
5.52
7.85
17.20
2.88
3.97
5.29
7.46
16.21
2.83
3.87
5.12
7.19
15.52
2.78
3.79
4.99
6.99
15.02
8
59.44
23S.88
956.66
5981.1
598144
9.37
19.37
39.37
99.37
999.37
5.25
8.85
14.54
27.49
130.62
3.95
6.04
8.98
14.80
49.00
3.34
4.82
6.76
10.29
27.65
2.98
4.15
5.60
8.10
19.03
2.75
3.73
4.90
6.84
14.63
9
59.86
240.54
963.28
6022.5
602284
9.38
19.38
39.39
99.39
999.39
5.24
8.81
14.47
27.35
129.86
3.94
6.00
8.90
14.66
48.47
3.32
4.77
6.68
10.16
27.24
2.96
4.10
5.52
7.98
18.69
2.72
3.68
4.82
6.72
14.33

1.6 Page 6

▲back to top


l Tables T-13
~-·•=t•
Table entry for p is the
critical value with
probability p lying to
its right.
F critical values (continued)
Probability p
F*
Degrees of freedom in the numerator
10
12
15
20
25
30
40
so
60
60.19
241.88
968.63
6055.8
605621
9.39
19.40
39.40
99.40
999.40
60.71
243.91
976.71
6106.3
610668
9.41
19.41
39.41
99.42
999.42
61.22
245.95
984.87
6157.3
615764
9.42
19.43
39.43
99.43
999.43
61.74
248.01
993.10
6208.7
620908
9.44
I 9.45
39.45
99.45
999.45
62.05
249.26
998.08
6239.8
624017
9.45
19.46
39.46
99.46
999.46
62.26
250.10
1001.4
6260.6
626099
9.46
19.46
39.46
99.47
999.47
62.53
251.14
1005.6
6286.8
628712
9.47
19.47
39.47
99.47
999.47
62.69
251.77
JOOS.I
6302.5
630285
9.47
19.48
39.48
99.48
999.48
62.79
252.20
1009.8
6313.0
631337
9.47
19.48
39.48
99.48
999.48
5.23
8.79
14.42
27.23
129.25
3.92
5.96
8.64
14.55
48.05
5.22
8.74
14.34
27.05
128.32
3.90
5.91
8.75
14.37
47.41
5.20
8.70
14.25
26.87
127.37
3.87
5.86
8.66
14.20
46.76
5.18
8.66
14.17
26.69
126.42
3.84
5.SO
6.56
14.02
46.10
5.17
8.63
14.12
26.58
125.84
3.83
5.77
6.50
13.91
45.70
5.17
8.62
14.08
26.50
125.45
3.82
5.75
8.46
13.84
45.43
5.16
8.59
14.04
26.41
124.96
3.SO
5.72
8.41
13.75
45.09
5.15
8.58
14.01
26.35
124.66
3.80
5.70
8.38
13.69
44.88
5.15
8.57
13.99
26.32
124.47
3.79
5.69
8.36
13.65
44.75
3.30
4.74
6.62
10.05
26.92
2.94
4.06
5.46
7.S7
18.41
3.27
4.68
6.52
9.89
26.42
2.90
4.00
5.37
7.72
17.99
3.24
4.62
6.43
9.72
25.91
2.87
3.94
5.27
7.56
17.56
3.21
4.56
6.33
9.55
25.39
2.S4
3.87
5.17
7.40
17.12
3.19
4.52
6.27
9.45
25.08
2.81
3.83
5.11
7.30
16.85
3.17
4.50
6.23
9.38
24.87
2.SO
3.81
5.07
7.23
16.67
3.16
4.46
6.18
9.29
24.60
2.7S
3.77
5.01
7.14
16.44
3.15
4.44
6.14
9.24
24.44
2.77
3.75
4.98
7.09
16.31
3.14
4.43
6.12
9.20
24.33
2.76
3.74
4.96
7.06
16.21
2.70
3.64
4.76
6.62
14.08
2.67
3.57
4.67
6.47
13.71
2.63
3.51
4.57
6.31
13.32
2.59
3.44
4.47
6.16
12.93
2.57
3.40
4.40
6.06
12.69
2.56
3.38
4.36
5.99
12.53
2.54
3.34
4.31
5.91
12.33
2.52
3.32
4.28
5.86
12.20
2.51
3.30
4.25
5.82
12.12
120
1000
63.06
253.25
1014.0
6339.4
633972
9.48
19.49
39.49
99.49
999.49
63.30
254.19
1017.7
6362.7
636301
9.49
19.49
39.50
99.50
999.50
5.14
8.55
13.95
26.22
123.97
3.78
5.66
6.31
13.56
44.40
5.13
8.53
13.91
26.14
123.53
3.76
5.63
8.26
13.47
44.09
3.12
4.40
6.07
9.11
24.06
3.11
4.37
6.02
9.03
23.82
2.74
3.70
4.90
6.97
JS.98
2.72
3.67
4.86
6.89
15.77
2.49
3.27
4.20
5.74
11.91
2.47
3.23
4.15
5.66
11.72
( Continued)

1.7 Page 7

▲back to top


l T-14 Tables
FIi·:"t • =-
F critical values (continued)
s
9
10
,.. 11
0
""C§:
0
C:
O;
-0
-5 12
.5
E
0
-0
."".::
'o
13
""!"'
bl)
O;
Q
14
15
16
17
p
.100
.050
.025
.010
.001
.100
.050
.025
.010
.001
.100
.050
.025
.010
.001
.100
.050
.025
.QIO
.001
.100
.050
.025
.010
.001
.JOO
.050
.025
.010
.001
.100
.050
.025
.010
.001
.100
.050
.025
.010
.001
.100
.050
.025
.010
.001
.100
.050
.025
.010
.001
1
3.46
5.32
7.57
11.26
25.41
3.36
5.12
7.21
10.56
22.86
3.29
4.96
6.94
10.Q4
21.04
3.23
4.84
6.72
9.65
19.69
3.18
4.75
6.55
9.33
18.64
3.14
4.67
6.41
9.07
17.82
3.10
4.60
6.30
S.S6
17.14
3.07
4.54
6.20
S.6S
16.59
3.05
4.49
6.12
8.53
16.12
3.03
4.45
6.04
8.40
15.72
2
3.11
4.46
6.06
8.65
18.49
3.01
4.26
5.71
8.02
16.39
2.92
4.10
5.46
7.56
14.91
2.86
3.98
5.26
7.21
13.81
2.81
3.89
5.10
6.93
12.97
2.76
3.81
4.97
6.70
12.31
2.73
3.74
4.86
6.51
11.78
2.70
3.68
4.77
6.36
11.34
2.67
3.63
4.69
6.23
10.97
2.64
3.59
4.62
6.11
10.66
Degrees of frc:edom in the numerator
3
4
5
6
2.92
4.07
5.42
7.59
15.83
2.81
3.86
5.08
6.99
13.90
2.73
3.71
4.83
6.55
12.55
2.66
3.59
4.63
6.22
11.56
2.61
3.49
4.47
5.95
10.80
2.56
3.41
4.35
5.74
10.21
2.52
3.34
4.24
5.56
9.73
2.49
3.29
4.15
5.42
9.34
2.46
3.24
4.08
5.29
9.01
2.44
3.20
4.01
5.19
8.73
2.81
3.84
5.05
7.01
14.39
2.69
3.63
4.72
6.42
12.56
2.61
3.48
4.47
5.99
11.28
2.54
3.36
4.28
5.67
10.35
2.48
3.26
4.12
5.41
9.63
2.43
3.18
4.00
5.21
9.07
2.39
3.11
3.89
5.04
S.62
2.36
3.06
3.80
4.S9
8.25
2.33
3.01
3.73
4.77
7.94
2.31
2.96
3.66
4.67
7.68
2.73
3.69
4.82
6.63
13.48
2.61
3.48
4.48
6.06
11.71
2.52
3.33
4.24
5.64
10.48
2.45
3.20
4.04
5.32
9.58
2.39
3.11
3.89
5.06
8.89
2.35
3.03
3.77
4.86
8.35
2.31
2.96
3.66
4.69
7.92
2.27
2.90
3.58
4.56
7.57
2.24
2.85
3.50
4.44
7.27
2.22
2.81
3.44
4.34
7.02
2.67
3.58
4.65
6.37
12.86
2.55
3.37
4.32
5.80
11.13
2.46
3.22
4.07
5.39
9.93
2.39
3.09
3.88
5.07
9.05
2.33
3.00
3.73
4.82
8.38
2.28
2.92
3.60
4.62
7.86
2.24
2.85
3.50
4.46
7.44
2.21
2.79
3.41
4.32
7.09
2.18
2.74
3.34
4.20
6.80
2.15
2.70
3.28
4.10
6.56
7
2.62
3.50
4.53
6.18
12.40
2.51
3.29
4.20
5.61
10.70
2.41
3.14
3.95
5.20
9.52
2.34
3.01
3.76
4.89
8.66
2.28
2.91
3.61
4.64
8.00
2.23
2.83
3.48
4.44
7.49
2.19
2.76
3.38
4.28
7.08
2.16
2.71
3.29
4.14
6.74
2.13
2.66
3.22
4.03
6.46
2.10
2.61
3.16
3.93
6.22
8
2.59
3.44
4.43
6.03
12.05
2.47
3.23
4.10
5.47
10.37
2.38
3.07
3.85
5.06
9.20
2.30
2.95
3.66
4.74
8.35
2.24
2.85
3.51
4.50
7.71
2.20
2.77
3.39
4.30
7.21
2.15
2.70
3.29
4.14
6.80
2.12
2.64
3.20
4.00
6.47
2.09
2.59
3.12
3.89
6.19
2.06
2.55
3.06
3.79
5.96
9
2.56
3.39
4.36
5.91
11.77
2.44
3.18
4.03
5.35
10.11
2.35
3.02
3.78
4.94
8.96
2.27
2.90
3.59
4.63
8.12
2.21
2.80
3.44
4.39
7.48
2.16
2.71
3.31
4.19
6.98
2.12
2.65
3.21
4.03
6.58
2.09
2.59
3.12
3.89
6.26
2.06
2.54
3.05
3.78
5.98
2.03
2.49
2.98
3.6S
5.75

1.8 Page 8

▲back to top


1 Tables
T-15
F critical values (continued}
D<!gr<:esof freedom in the numerator
10
12
15
20
25
30
40
so
60
120
1000
2.54
2.50
2.46
2.42
2.40
2.38
2.36
2.35
2.34
2.32
2.30
3.35
3.28
3.22
3.15
3.11
3.08
3.04
3.02
3.01
2.97
2.93
4.30
4.20
4.10
4.00
3.94
3.S9
3.84
3.S1
3.78
3.73
3.68
5.81
5.67
5.52
5.36
5.26
5.20
5.12
5.07
5.03
4.95
4.87
11.54
11.19
10.84
10.48
10.26
10.11
9.92
9.80
9.73
9.53
9.36
2.42
2.38
2.34
2.30
2.27
2.25
2.23
2.22
2.21
2.18
2.16
3.14
3.07
3.01
2.94
2.89
2.86
2.83
2.80
2.79
2.75
2.71
3.96
3.87
3.77
3.67
3.60
3.56
3.51
3.47
3.45
3.39
3.34
5.26
5.11
4.96
4.81
4.71
4.65
4.57
4.52
4.48
4.40
4.32
9.89
9.57
9.24
8.90
8.69
8.55
8.37
8.26
8.19
8.00
7.84
2.32
2.28
2.24
2.20
2.17
2.16
2.13
2.12
2.11
2.08
2.06
2.98
2.91
2.85
2.77
2.73
2.70
2.66
2.64
2.62
2.58
2.54
3.72
3.62
3.52
3.42
3.35
3.31
3.26
3.22
3.20
3.14
3.09
4.85
4.71
4.56
4.41
4.31
4.25
4.17
4.12
4.08
4.00
3.92
8.75
8.45
8.13
7.80
7.60
7.47
7.30
7.19
7.12
6.94
6.78
2.25
2.21
2.17
2.12
2.10
2.08
2.05
2.04
2.03
2.00
1.98
2.85
2.79
2.72
2.65
2.60
2.57
2.53
2.51
2.49
2.45
2.41
3.53
3.43
3.33
3.23
3.16
3.12
3.06
3.03
3.00
2.94
2.89
4.54
4.40
4.25
4.10
4.01
3.94
3.86
3.81
3.78
3.69
3.61
7.92
7.63
7.32
7.01
6.81
6.68
6.52
6.42
6.35
6.18
6.02
2.19
2.15
2.10
2.06
2.03
2.01
1.99
1.97
1.96
1.93
1.91
2.75
2.69
2.62
2.54
2.50
2.47
2.43
2.40
2.38
2.34
2.30
3.37
3.28
3.18
3.07
3.01
2.96
2.91
2.87
2.85
2.79
2.73
4.30
4.16
4.01
3.86
3.76
3.70
3.62
3.57
3.54
3.45
3.37
7.29
7.00
6.71
6.40
6.22
6.09
5.93
5.83
5.76
5.59
5.44
2.14
2.10
2.05
2.01
1.98
1.96
1.93
J.92
1.90
1.88
1.85
2.67
2.60
2.53
2.46
2.41
2.38
2.34
2.31
2.30
2.25
2.21
3.25
3.15
3.05
2.95
2.88
2.84
2.78
2.74
2.72
2.66
2.60
4.10
3.96
3.82
3.66
3.57
3.51
3.43
3.38
3.34
3.25
3.18
6.80
6.52
6.23
5.93
5.75
5.63
5.47
5.37
5.30
5.14
4.99
2.10
2.05
2.01
1.96
1.93
1.91
1.89
1.87
1.86
1.83
I.SO
2.60
2.53
2.46
2.39
2.34
2.31
2.27
2.24
2.22
2.18
2.14
3.15
3.05
2.95
2.84
2.78
2.73
2.67
2.64
2.61
2.55
2.50
3.94
3.80
3.66
3.51
3.41
3.35
3.27
3.22
3.18
3.09
3.02
6.40
6.13
5.85
5.56
5.38
5.25
5.10
5.00
4.94
4.77
4.62
2.06
2.02
1.97
1.92
1.89
1.87
1.85
1.83
1.82
1.79
1.76
2.54
2.48
2.40
2.33
2.28
2.25
2.20
2.18
2.16
2.11
2.07
3.06
2.96
2.86
2.76
2.69
2.64
2.59
2.55
2.52
2.46
2.40
3.80
3.67
3.52
3.37
3.28
3.21
3.13
3.08
3.05
2.96
2.88
6.08
5.81
5.54
5.25
5.07
4.95
4.80
4.70
4.64
4.47
4.33
2.03
1.99
1.94
1.89
l.S6
1.84
I.SI
1.79
1.78
1.75
1.72
2.49
2.42
2.35
2.28
2.23
2.19
2.15
2.12
2.11
2.06
2.02
2.99
2.89
2.79
2.68
2.61
2.57
2.51
2.47
2.45
2.38
2.32
3.69
3.55
3.41
3.26
3.16
3.10
3.02
2.97
2.93
2.84
2.76
5.81
5.55
5.27
4.99
4.82
4.70
4.54
4.45
4.39
4.23
4.08
2.00
1.96
1.91
1.86
1.83
1.81
1.78
1.76
1.75
1.72
1.69
2.45
2.38
2.31
2.23
2.18
2.15
2.10
2.08
2.06
2.01
1.97
2.92
2.82
2.72
2.62
2.55
2.50
2.44
2.41
2.38
2.32
2.26
3.59
3.46
3.31
3.16
3.07
3.00
2.92
2.87
2.83
2.75
2.66
5.58
5.32
5.05
4.78
4.60
4.48
4.33
4.24
4.18
4.02
3.87
(Continued)

1.9 Page 9

▲back to top


l T-16
Tables
F critical values (continued)
18
19
20
5
21
".5
§
:::
"-0
-5 22
·E =
0
-..0",...:.,:.
23
0
""ob'
Q"
24
25
26
27
p
.JOO
.050
.025
.010
.001
.100
.050
.025
.010
.001
.100
.050
.025
.010
.001
.100
.050
.025
.010
.001
.100
.050
.025
.010
.001
.100
.050
.025
.010
.001
.100
.050
.025
.010
.001
.JOO
.050
.025
.010
.001
.100
.050
.025
.010
.001
.100
.050
.025
.010
.001
I
3.01
4.41
5.98
S.29
15.38
2.99
4.38
5.92
8.18
IS.OS
2.97
4.35
5.87
8.10
14.82
2.96
4.32
5.S3
8.02
14.59
2.95
4.30
5.79
7.95
14.3S
2.94
4.28
5.75
7.88
14.20
2.93
4.26
5.72
7.S2
14.03
2.92
4.24
5.69
7.77
13.88
2.91
4.23
5.66
7.72
13.74
2.90
4.21
5.63
7.68
13.61
2
2.62
3.55
4.56
6.01
10.39
2.61
3.52
4.51
5.93
10.16
2.59
3.49
4.46
5.85
9.95
2.57
3.47
4.42
5.7S
9.77
2.56
3.44
4.38
5.72
9.61
2.55
3.42
4.35
5.66
9.47
2.54
3.40
4.32
5.61
9.34
2.53
3.39
4.29
5.57
9.22
2.52
3.37
4.27
5.53
9.12
2.51
3.35
4.24
5.49
9.02
Degree$ of freedom in the numerator
3
4
5
6
2.42
2.29
2.20
2.13
3.16
2.93
2.77
2.66
3.95
3.61
3.38
3.22
5.09
4.58
4.25
4.01
8.49
7.46
6.81
6.35
2.40
2.27
2.1S
2.11
3.13
2.90
2.74
2.63
3.90
3.56
3.33
3.17
5.01
4.50
4.17
3.94
8.2S
7.27
6.62
6.18
2.3S
2.25
2.16
2.09
3.10
2.87
2.71
2.60
3.86
3.51
3.29
3.13
4.94
4.43
4.10
3.87
8.10
7.10
6.46
6.02
2.36
2.23
2.14
2.08
3.07
2.84
2.68
2.57
3.82
3.48
3.25
3.09
4.87
4.37
4.04
3.81
7.94
6.95
6.32
5.88
2.35
2.22
2.13
2.06
3.05
2.S2
2.66
2.55
3.7S
3.44
3.22
3.05
4.82
4.31
3.99
3.76
7.SO
6.81
6.19
5.76
2.34
2.21
2.11
2.05
3.03
2.SO
2.64
2.53
3.75
3.41
3.18
3.02
4.76
4.26
3.94
3.71
7.67
6.70
6.0S
5.65
2.33
2.19
2.10
2.04
3.01
2.78
2.62
2.51
3.72
3.38
3.15
2.99
4.72
4.22
3.90
3.67
7.55
6.59
5.9S
5.55
2.32
2.18
2.09
2.02
2.99
2.76
2.60
2.49
3.69
3.35
3.13
2.97
4.6S
4.18
3.85
3.63
7.45
6.49
5.89
5.46
2.31
2.17
2.08
2.01
2.98
2.74
2.59
2.47
3.67
3.33
3.10
2.94
4.64
4.14
3.82
3.59
7.36
6.41
5.80
5.38
2.30
2.17
2.07
2.00
2.96
2.73
2.57
2.46
3.65
3.31
3.08
2.92
4.60
4.11
3.78
3.56
7.27
6.33
5.73
5.31
7
2.08
2.58
3.10
3.84
6.02
2.06
2.54
3.05
3.77
5.85
2.04
2.51
3.01
3.70
5.69
2.02
2.49
2.97
3.64
5.56
2.01
2.46
2.93
3.59
5.44
1.99
2.44
2.90
3.54
5.33
1.98
2.42
2.87
3.50
5.23
1.97
2.40
2.85
3.46
5.15
1.96
2.39
2.82
3.42
5.07
1.95
2.37
2.80
3.39
5.00
8
2.04
2.51
3.01
3.71
5.76
2.02
2.48
2.96
3.63
5.59
2.00
2.45
2.91
3.56
5.44
1.98
2.42
2.87
3.51
5.31
1.97
2.40
2.84
3.45
5.19
1.95
2.37
2.81
3.41
5.09
1.94
2.36
2.78
3.36
4.99
1.93
2.34
2.75
3.32
4.91
1.92
2.32
2.73
3.29
4.83
1.91
2.31
2.71
3.26
4.76
9
2.00
2.46
2.93
3.60
5.56
1.98
2.42
2.88
3.52
5.39
1.96
2.39
2.84
3.46
5.24
1.95
2.37
2.80
3.40
5.1 I
1.93
2.34
2.76
3.35
4.99
1.92
2.32
2.73
3.30
4.89
1.91
2.30
2.70
3.26
4.80
1.89
2.28
2.6S
3.22
4.71
1.88
2.27
2.65
3.18
4.64
1.87
2.25
2.63
3.15
4.57

1.10 Page 10

▲back to top


i--1111••11:t ,_
F critical values (continued)
JO
l.98
2.41
2.S7
3.51
5.39
1.96
2.38
2.82
3.43
5.22
1.94
2.35
2.77
3.37
5.08
1.92
2.32
2.73
3.31
4.95
1.90
2.30
2.70
3.26
4.83
I.S9
2.27
2.67
3.21
4.73
1.88
2.25
2.64
3.17
4.64
1.87
2.24
2.61
3.13
4.56
1.86
2.22
2.59
3.09
4.48
1.85
2.20
2.57
3.06
4.41
12
l.93
2.34
2.77
3.37
5.13
1.91
2.31
2.72
3.30
4.97
1.89
2.28
2.68
3.23
4.82
1.87
2.25
2.64
3.17
4.70
1.86
2.23
2.60
3.12
4.58
1.S4
2.20
2.57
3.07
4.46
1.83
2.16
2.54
3.03
4.39
J.82
2.16
2.51
2.99
4.31
I.SI
2.15
2.49
2.96
4.24
J.80
2.13
2.47
2.93
4.17
15
1.89
2.27
2.67
3.23
4.87
1.86
2.23
2.62
3.15
4.70
1.S4
2.20
2.57
3.09
4.56
1.83
2.18
2.53
3.03
4.44
I.SI
2.15
2.50
2.96
4.33
J.80
2.13
2.47
2.93
4.23
J.78
2.1 J
2.44
2.89
4.14
l.77
2.09
2.41
2.85
4.06
1.76
2.07
2.39
2.81
3.99
1.75
2.06
2.36
2.78
3.92
Degrees of freedom in the numerator
20
25
30
40
l.84
2.19
2.56
3.08
4.59
1.81
2.16
2.51
3.00
4.43
1.79
2.12
2.46
2.94
4.29
1.78
2.10
2.42
2.88
4.17
1.76
2.07
2.39
2.83
4.06
1.74
2.05
2.36
2.78
3.96
l.73
2.03
2.33
2.74
3.67
1.72
2.01
2.30
2.70
3.79
1.71
1.99
2.28
2.66
3.72
J.70
1.97
2.25
2.63
3.66
1.80
2.14
2.49
2.98
4.42
l.78
2.11
2.44
2.91
4.26
1.76
2.07
2.40
2.84
4.12
1.74
2.05
2.36
2.79
4.00
1.73
2.02
2.32
2.73
3.89
1.71
2.00
2.29
2.69
3.79
1.70
J.97
2.26
2.64
3.71
l.68
1.96
2.23
2.60
3.63
1.67
1.94
2.21
2.57
3.56
1.66
1.92
2.18
2.54
3.49
1.78
2.11
2.44
2.92
4.30
1.76
2.07
2.39
2.84
4.14
1.74
2.04
2.35
2.7S
4.00
1.72
2.01
2.31
2.72
3.88
1.70
1.98
2.27
2.67
3.78
1.69
1.96
2.24
2.62
3.68
J.67
1.94
2.21
2.58
3.59
l.66
1.92
2.18
2.54
3.52
1.65
1.90
2.16
2.50
3.44
l.64
J.88
2.13
2.47
3.38
l.75
2.06
2.3S
2.84
4.15
1.73
2.03
2.33
2.76
3.99
1.71
1.99
2.29
2.69
3.86
1.69
1.96
2.25
2.64
3.74
1.67
1.94
2.21
2.58
3.63
1.66
1.91
2.18
2.54
3.53
1.64
J.89
2.15
2.49
3.45
1.63
1.87
2.12
2.45
3.37
1.61
J.85
2.09
2.42
3.30
1.60
J.84
2.07
2.38
3.23
50
l.74
2.04
2.35
2.78
4.06
1.71
2.00
2.30
2.71
3.90
1.69
1.97
2.25
2.64
3.77
1.67
1.94
2.21
2.58
3.64
1.65
1.91
2.17
2.53
3.54
1.64
l.S8
2.14
2.48
3.44
J.62
1.86
2.1 J
2.44
3.36
l.61
1.84
2.08
2.40
3.28
1.59
1.82
2.05
2.36
3.21
1.58
J.81
2.03
2.33
3.14
60
l.72
2.02
2.32
2.75
4.00
1.70
1.98
2.27
2.67
3.64
1.68
1.95
2.22
2.61
3.70
1.66
1.92
2.18
2.55
3.58
1.64
1.89
2.14
2.50
3.48
l.62
J.86
2.11
2.45
3.36
1.6 I
J.84
2.0S
2.40
3.29
1.59
1.82
2.05
2.36
3.22
1.58
J.60
2.03
2.33
3.15
1.57
J.79
2.00
2.29
3.08
l Tables T-17
120
l.69
1.97
2.26
2.66
3.84
1.67
1.93
2.20
2.58
3.68
1.64
1.90
2.16
2.52
3.54
1.62
1.87
2.1 I
2.46
3.42
1.60
1.84
2.08
2.40
3.32
1.59
1.81
2.04
2.35
3.22
1.57
1.79
2.01
2.31
3.14
1.56
1.77
1.98
2.27
3.06
1.54
1.75
1.95
2.23
2.99
1.53
1.73
l.93
2.20
2.92
1000
l.66
1.92
2.20
2.58
3.69
1.64
1.88
2.14
2.50
3.53
1.61
J.85
2.09
2.43
3.40
1.59
1.82
2.05
2.37
3.28
1.57
1.79
2.01
2.32
3.17
1.55
l.76
J.98
2.27
3.08
1.54
l.74
1.94
2.22
2.99
1.52
1.72
1.91
2.18
2.91
1.51
1.70
1.89
2.14
2.84
1.50
1.68
1.86
2.11
2.78
(Continued)

2 Pages 11-20

▲back to top


2.1 Page 11

▲back to top


Appendix 693
V Operating Characteristic Curves for the Fixed Effects Model Analysis of Variance"
1.00
0.80
0.70
0.60
0.50
"·<.h; 0.40
.s:::
0 0.30
.0>s.:::
-"s 0.20
0)
.!::
.."'C. 0.10
<<..>> 0.08
..10
0.07
0.06
0.05
:..,0, 0.04
c0t 0.03
0.02
0.01
1.5
2
2.5
3
3.5 -<I>
(for a= 0.05)
<l>(fora=0.01)-
2
3
4
5
1.00
0.80
0.70
0.60
0.50
"'·<.h; 0.40
.s:::
0 0.30
.0>s.:::
" 0.20
-=0)
.!::
"..C. 0.10
<<..>> 0.08
0 0.07
0.06
0.05
:.".,0', 0.04
0
ct
0.03
0.02
2
3 -<I>
(for am 0.05)
<I>(for a= 0.01 )-
1
2
3
4
5
u1 = Numerator degrees of freedom, u2 a Denominator degrees of freedom
•Adaptedwith permissionfromBiomctrika Tablesfor Stat;s1icia1u.Vol.2. by E. S. Pearsonand H. 0. Hartley.Cambridge
University Press. Cambridge, 1972.

2.2 Page 12

▲back to top


694 Appendix
V Operating Characteristic Curves for the Fixed Effects Model Analysis
of Variance (Continued)
1.00
0.80
0.70
0.60
., 0.50
·.;,;; 0.40
.r:::
.0,a>:;.
0.30
-"5 0.20
Cl
-C.=,.
uu
0"'
0.10
0.08
0.07
0.06
:c
.c"e'
0..
0.05
0.04
0.03
0.02
2
3 -<I>
(for a a 0.05)
<l>(fora=0.01)-1
2
3
4
5
1.00
0.80
0.70
0.60
., 0.50
·.;;,; 0.40
.r:::
.0a.:>:,.
0.30
0.20
-5
Cl
·C.g, _ 0.10
uu
0"'
0.08
0.07
0.06
e:c
."c '
0.05
0.04
0.. 0.03
0.02
2
3 -<I>
(for a~ 0.05)
<I>(for a:; 0.01)-
1
2
3
4
5

2.3 Page 13

▲back to top


Appendix 695
V Operating Characteristic Curves for the Fixed Effects Model Analysis
of Variance (Continued)
1.00
0.80
0.70
0.60
0.50
"·";;;' 0.40
L;
0 0.30
Q.
>-
L;
£" 0.20
C)
.a!:.
"0'"'--'''
?
0.10
0.08
0.07
0.06
0.05
0.04
.0
0
ct
0.03
0.02
2
3 ._<I>
(for CL= 0.05)
<I>(for CLm 0.01)-
1
2
3
4
5
0.80
0.70
0.60
0.50
0.40 µMl""-~~~-+--------1---+~+l~~~__:lo,.-~-----+-----l
2
3 ._
<l>(foro:=0:05)
<l>(forCL~o.011-,
2
3
4

2.4 Page 14

▲back to top


696 Appendix
V Operating Characteristic Curves for the Fixed Effects Model Analysis
of Variance (Continued)
1.00
0.80
0.70
0.60
., 0.50
·.;;
(I)
0.40
.:::.
0 0.30
,:C>;.-
-"s 0.20
Cl
·aC:
-(uuI)
Cl)
0
0.10
0.08
0.07
0.06
0.05
.,,:E
C\\)
0.04
ea.. 0.03
0.02
2
3 -<I>
!for CL= 0.05)
<l>(fora=0.01)-1
2
3
4
1.00
0.80
0.70
0.60
-~ 0.50
(I) 0.40
.:::.
0 0.30
.tC>:.-
-s(I)
0.20
Cl
a.!:
(I) 0.10
uu
C\\)
0.08
0 0.07
0.06
.,,:a
Cl)
0.05
0.04
ea.. 0.03
0.02
2
3-
<I>(for o. = 0.05)
<l>(foro.=0.01)-1
2
3
4

2.5 Page 15

▲back to top


l Tables
T-11
Table entry for p and C is
the critical value t" with
probability p lying to its
right and probability C lying
between -t· and t•.
-·•'l:1•=-•
t distribution critical values
Upper-tail probability p
df
.25
.20
.IS
.10
.05
.025
.02
.01
I
2
3
4
5
6
7
8
9
10
11
12
13
14
15
16
17
18
19
20
21
22
23
24
25
26
27
28
29
30
40
50
60
80
100
1000
1.000
0.816
0.765
0.741
0.727
0.71S
0.711
0.706
0.703
0.700
0.697
0.695
0.694
0.692
0.691
0.690
0.689
0.688
0.688
0.687
0.686
0.686
0.685
0.685
0.684
0.684
0.6S4
0.683
0.683
0.683
0.681
0.679
0.679
0.678
0.677
0.675
0.674
1.376
1.061
0.978
0.941
0.920
0.906
0.896
0.889
0.883
0.879
0.876
0.873
0.870
0.868
O.S66
0.865
0.863
0.862
O.S61
0.860
0.859
0.858
0.858
O.S57
0.856
0.856
0.855
0.855
0.854
0.854
0.851
0.849
0.848
0.846
0.845
0.842
0.841
1.963
1.386
1.250
1.190
1.156
1.134
1.119
1.108
1.100
1.093
1.088
1.083
1.079
1.076
1.074
1.071
1.069
1.067
1.066
1.064
1.063
1.061
1.060
1.059
1.058
1.058
1.057
.1.056
1.055
1.055
1.050
1.047
1.045
1.043
1.042
1.037
1.036
3.07S
1.886
1.638
1.533
1.476
1.440
1.415
1.397
1.383
1.372
1.363
1.356
1.350
1.345
1.341
1.337
1.333
1.330
1.328
1.325
1.323
l.321
1.319
1.318
1.316
1.315
1.314
1.313
1.311
1.310
1.303
1.299
1.296
1.292
1.290
1.282
1.282
6.314
2.920
2.353
2.132
2.015
1.943
1.895
1.860
1.833
1.812
1.796
1.782
1.771
1.761
1.753
1.746
1.740
1.734
1.729
1.725
1.721
1.717
1.714
1.711
1.708
1.706
1.703
1.701
1.699
1.697
1.684
1.676
1.671
1.664
1.660
1.646
1.645
12.71
4.303
3.182
2.776
2.571
2.447
2.365
2.306
2.262
2.228
2.201
2.179
2.160
2.145
2.131
2.120
2.110
2.101
2.093
2.086
2.080
2.074
2.069
2.064
2.060
2.056
2.052
2.048
2.045
2.042
2.021
2.009
2.000
1.990
1.984
1.962
1.960
15.89
4.849
3.482
2.999
2.757
2.612
2.517
2.449
2.398
2.359
2.328
2.303
2.282
2.264
2.249
2.235
2.224
2.214
2.205
2.197
2.189
2.183
2.177
2.172
2.167
2.162
2.158
2.154
2.150
2.147
2.123
2.109
2.099
2.088
2.081
2.056
2.054
31.S2
6.965
4.541
3.747
3.365
3.143
2.998
2.896
2.821
2.764
2.718
2.681
2.650
2.624
2.602
2.583
2.567
2.552
2.539
2.528
2.518
2.508
2.500
2.492
2.485
2.479
2.473
2.467
2.462
2.457
2.423
2.403
2.390
2.374
2.364
2.330
2.326
50%
60%
70%
SO% 90%
95%
96%
98%
Confidence level C
.005
63.66
9.925
5.841
4.604
4.032
3.707
3.499
3.355
3.250
3.169
3.106
3.055
3.012
2.977
2.947
2.921
2.898
2.878
2.861
2.845
2.831
2.819
2.807
2.797
2.787
2.779
2.771
2.763
2.756
2.750
2.704
2.678
2.660
2.639
2.626
2.581
2.576
99%
Probability p
.0025
127.3
14.09
7.453
5.59S
4.773
4.317
4.029
3.833
3.690
3.581
3.497
3.428
3.372
3.326
3.2S6
3.252
3.222
3.197
3.174
3.153
3.135
3.119
3.104
3.091
3.078
3.067
3.057
3.047
3.038
3.030
2.971
2.937
2.915
2.887
2.871
2.813
2.807
99.5%
.001
318.3
22.33
10.21
7.173
5.893
5.208
4.785
4.501
4.297
4.144
4.025
3.930
3.852
3.787
3.733
3.6S6
3.646
3.611
3.579
3.552
3.527
3.505
3.485
3.467
3.450
3.435
3.421
3.408
3.396
3.385
3.307
3.261
3.232
3.195
3.174
3.098
3.091
99.8%
.0005
636.6
31.60
12.92
8.610
6.869
5.959
5.408
5.041
4.781
4.587
4.437
4.318
4.221
4.140
4.073
4.015
3.965
3.922
3.883
3.850
3.819
3.792
3.768
3.745
3.725
3.707
3.690
3.674
3.659
3.646
3.551
3.496
3.460
3.416
3.390
3.300
3.291
99.9%