


 |
BBS611C-BASIC BUSINESS STATISTICS-2ND OPP- NOV 2024 |
|
|
1 Page 1 |
▲back to top |
nAmlBIA
unlVERSITY
OF SCIEnCE Ano
TECHnOLOGY
HAROLDPUPKEWITZ
GraduateSchoolof Business
FACULTY OF COMMERCE; HUMAN SCIENCES AND EDUCATION
HAROLD PUPKEWITZ GRADUATE SCHOOL OF BUSINESS
QUALIFICATION: DIPLOMA IN BUSINESS PROCESS MANAGEMENT
QUALIFICATION CODE: 06DBPM LEVEL: 6
COURSE CODE: BBS611C
COURSE NAME: BASIC BUSINESS
STATISTICS
SESSION: JANUARY 2025
DURATION: 3 HOURS
PAPER: PAPER 1
MARKS:90
SECOND OPPORTUNITY/ SUPPLEMENTARY EXAMINATION -
QUESTION PAPER
EXAMINER(S) Mr.A.Roux
MODERATOR: Mr. J. Amunyela
INSTRUCTIONS
1. Answer ALL the questions.
2. Write clearly and neatly.
3. Number the answers clearly.
PERMISSIBLE MATERIALS
1. Examination paper
2. Examination script
3. Scientific calculator
ATTACHMENTS
1. Standard Normal Probability Distribution Table
2. 1 x A4 Graph Sheet
THIS QUESTION PAPER CONSISTS OF 4 PAGES (INCLUDING THIS FRONT
PAGE)
1
|
|
2 Page 2 |
▲back to top |
..;;;Q:..;;;U..;;;E;;_.;_;;;S;..;_.T.[.".;"_0."._.]"11-0;;T;;h...iNs;.i.s;;..a..;m1 ultiple choice question. You only need to write
down the letter indicating the answer to your choice to the question
1.1 Which of the following measures of central tendency can reliably be used
when dataset has outliers?
a) Mean
b) Median c) Mode
d) All the above
[2]
1.2 A sample is
a) An experiment in the population
c) A variable in the population
b) A subset of the population
d) An outcome of the population
[2]
1.3 A parameter refers to
a) Calculation made from the population
b) A measurement that is made
from the population
c) A value observed in the experiment
d) All of the above
[2]
1.4 Weight is a ____
a) Continuous
variable
b) Discrete
c) Ordinal
d) Interval [2]
1.5 Researchers do sampling because of all of the following reasons except
a) Reduce cost
b) More time effective
c) Sampling is interesting
d) Easy to manage due to manageable logistics requirements
[2]
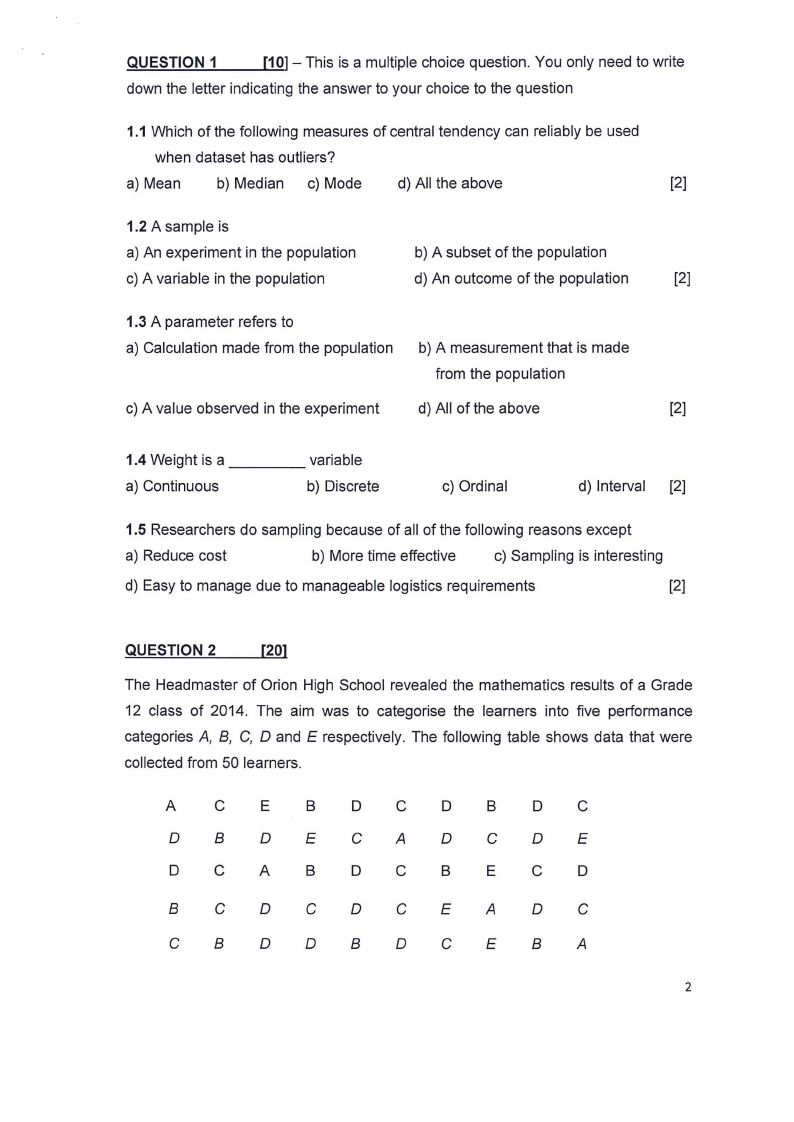
QUESTION 2
[20]
The Headmaster of Orion High School revealed the mathematics results of a Grade
12 class of 2014. The aim was to categorise the learners into five performance
categories A, B, C, D and E respectively. The following table shows data that were
collected from 50 learners.
A
C E BDCDBDC
D
B
D
E
CA
D
C
D
E
DCA BDCBEC D
B
C
D
C
D
C
E
A
D
C
CB DDBDCEBA
2
|
|
3 Page 3 |
▲back to top |
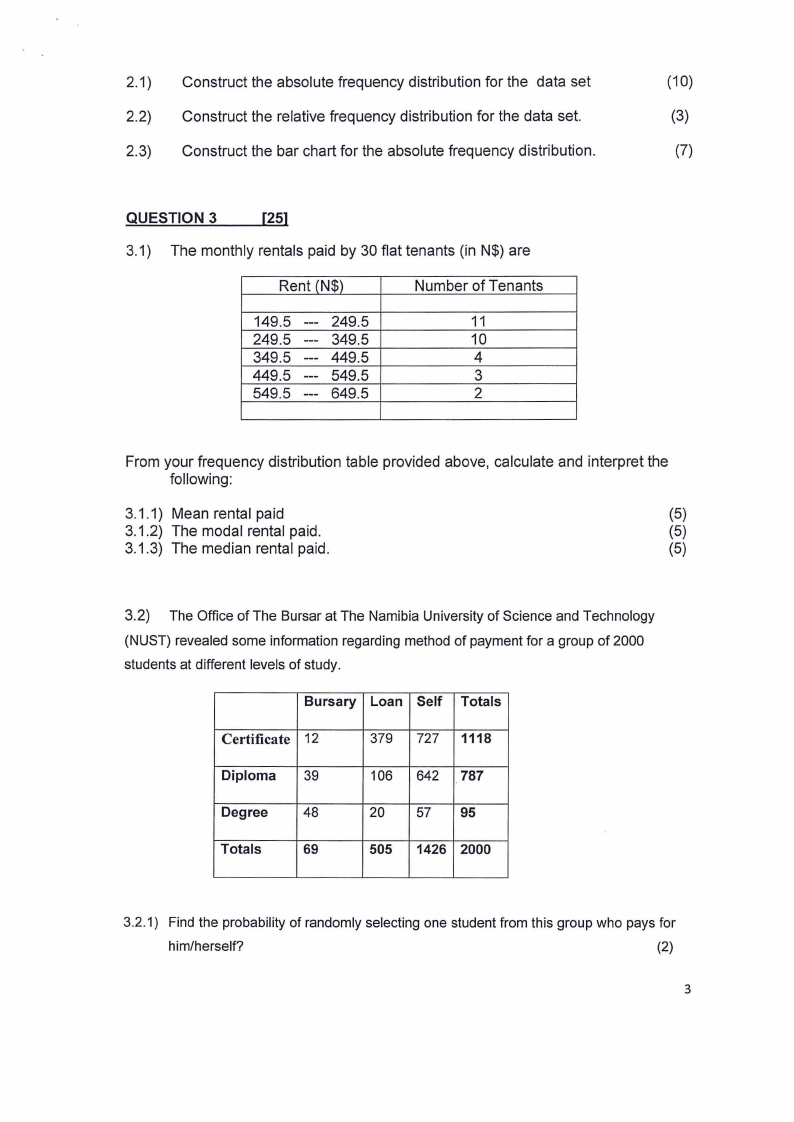
2.1) Construct the absolute frequency distribution for the data set
(10)
2.2) Construct the relative frequency distribution for the data set.
(3)
2.3) Construct the bar chart for the absolute frequency distribution.
(7)
QUESTION 3
[251
3.1) The monthly rentals paid by 30 flat tenants (in N$) are
Rent (N$)
Number of Tenants
149.5 --- 249.5
11
249.5 --- 349.5
10
349.5 --- 449.5
4
449.5 --- 549.5
3
549.5 --- 649.5
2
From your frequency distribution table provided above, calculate and interpret the
following:
3.1.1) Mean rental paid
(5)
3.1.2) The modal rental paid.
(5)
3.1.3) The median rental paid.
(5)
3.2) The Office of The Bursar at The Namibia University of Science and Technology
(NUST) revealed some information regarding method of payment for a group of 2000
students at different levels of study.
Bursary Loan Self Totals
Certificate 12
379 727 1118
Diploma 39
106 642 787
Degree
48
20 57 95
Totals
69
505 1426 2000
3.2.1) Find the probability of randomly selecting one student from this group who pays for
him/herself?
(2)
3
|
|
4 Page 4 |
▲back to top |
3.2.2) Find the probability of randomly selecting one student from this group who
has a Diploma or a Degree?
(4)
3.2.3) Find the probability of randomly selecting one student from this group who
has a Bursary or Degree?
(4)
QUESTION 4
[35)
4.1) The Office of the Registrar has revealed that only 12 out of every 20 students
graduate. Based upon this assumption, determine the probability that out of a
random sample of 5 students
4.1.1) None will graduate
(4)
4.1.2) All will graduate.
(4)
4.1.3) At most one student will graduate
(5)
4.1 .4) At least four will graduate
(5)
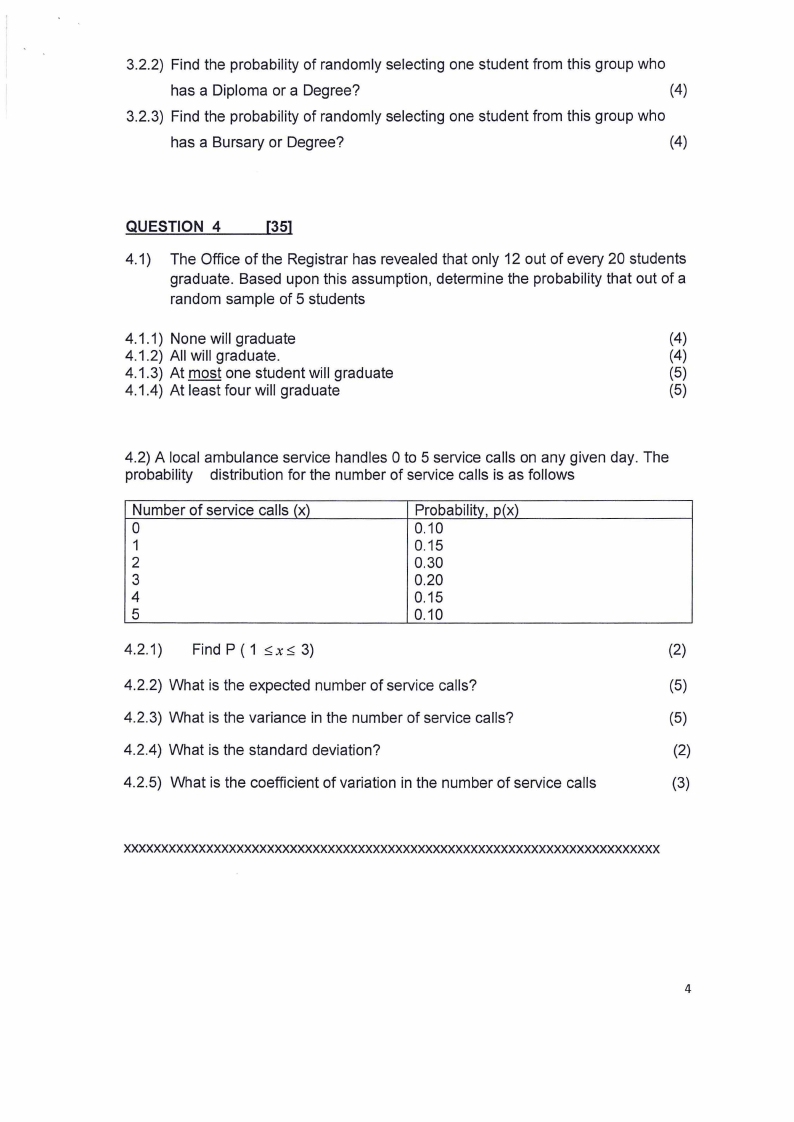
4.2) A local ambulance service handles O to 5 service calls on any given day. The
probability distribution for the number of service calls is as follows
Number of service calls (x)
0
1
2
3
4
5
Probability, p(x)
0.10
0.15
0.30
0.20
0.15
0.10
4.2.1) Find P ( 1 x 3)
(2)
4.2.2) What is the expected number of service calls?
(5)
4.2.3) What is the variance in the number of service calls?
(5)
4.2.4) What is the standard deviation?
(2)
4.2.5) What is the coefficient of variation in the number of service calls
(3)
xxxxxxxxxxxxxxxxxxxxxxxxxxxxxxxxxxxxxxxxxxxxxxxxxxxxxxxxxxxxxxxxxxxxxxx
4
|
|
5 Page 5 |
▲back to top |
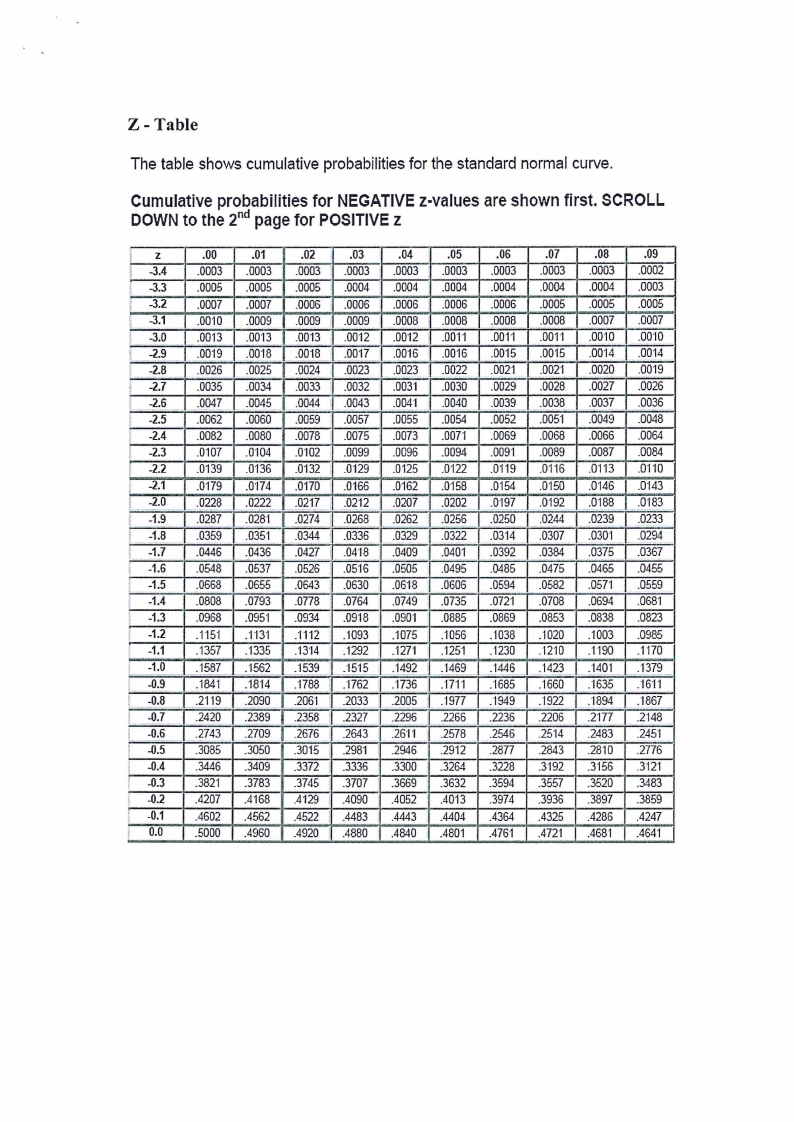
Z-Table
The table shows cumulativeprobabilitiesfor the standardnormal curve.
Cumulativeprobabilitiesfor NEGATIVEz-valuesareshownfirst.SCROLL
DOWNto the 2nd pagefor POSITIVEz
Iz
I -3.4
-3.3
: -3.2
I -3.1
' -3. .-0
'. -2.9
-2.8
: -2.7
-2.6
i -2.5
-2.4
I -2.3
I -2.2
! -2.1
I --2.0
! -1.9
l .. -1.8
: -1.7
I -1.6
'' - -1.5
I -1.4
-1.3
I -1.2
-1.1
-1.0
-0.9
r -0.8
L -0.7
i -0.6
l -0.5
•'
-0.4
-0.3
l -0.2
l -0.1
i 0.0
.00
.01
.02
.03
.04 I .05
.0003 .0003 .0003 .0003 .0003 .0003
.0005 .0005 .0005 .0004 .0004 .0004
.0007
.0010
.0013
.0007
.0009
.00'13
.0006 I .0006 I .0006
.0009 I .0009 .0008
.0013 ' .00·12 .00·12
.0006
.0008
.0011
.0019 .0018 .0018 I .0017 .00'16 .0016
.0026 .0025 .0024 .0023 .0023 .0022
.0035 .0034 .0033 I .0032 .0031 .0030
. _.9_()47 .0045
.0044
I
I
.0043
.0041
.0040
.0062 .0060 .0059 .0057 .0055 .0054
.0082 .0080 .0078 .0075 .0073 .0071
.0107 .0'104 .0102 .0099 .0096 .0094
.0139 .0136 .0'132 .0129 .0125 .0122
.0179 .0174 .0170 .0'166 .0162 .0158
.. .0228
.0287
.0359
.0446
.0548
.0222
.028'1
.0351
.0436
.0537
_:0_21] .02·12 .0207
.0274 .0268 .0262
.03·-4-4. .03. 3-5 - .0329
.0427 ' - .0-4'18 .0409
.0526 .0516 .0505
.0202
.0256 ..
..0..322
.0401
.0495
.0668 .0655 .0643 I .0630 .06'18 .0606
.0808 .0793 .0778 .0764 .0749 .0735
.0968 .Q95·1 .0934 .0918 .090'1 .0885
.1151 .·113'1 .1112 .1093 .1075 .1056
.1357 .'1335 .'13'14 i .1292 .1271 .1251
.1587 .'1562
I)841 I .1814
.2119 .2090
.1539 .1515
.1788 i .1762
.2061 ; .2033
.14~2 ...1.:469
.1736 .1711
.2005 .1977
...2- 420 .2389 .2358 .2327 .2296 .2266
.2743 .2709 .2676 .2643 .26'1'1 .2578
.3085 .3050 .3015 .298'1 .2946 .2912
.3446 .3409 .3372 .3335 .3300 .3264
.3821 .3783 .3745 I .3707 .3669 .3632
.4207 .4168 .4'129 .4090 .4052 .4013
.4. 602 .4562 .4522 'I .4483 I .4443 .4404
.5000 .4960 .4920 .4880 .4840 .4801
.06
.07
.0003 .0003
.0004 .0004
.0006 .0005
.0008 .0008
.001·1 .001°1
.0015 .0015
.0021 .0021
.0029 .0028
.0039 .0038
.0052 .0051
.0069 .0068
.0091 .0089
.0·119 .01·16
.0154 .0150
.-0-·1-9.7 .0192
.0250 .0244
.0314 .0307
.0392 .0384
.0485 .0475
.0594 .0582
.0721 .0708
.0869 .0853
.1038 .1020
.1230 .'1210
.1446 . __.1423
.1685 .1660
.1949 .1922
.2236 .2206
.2546 .2514
.2877 .2843
.3228 .3192
.3594 .3557
.3974 .3936
.4364 .4325
.4761 .4721
.08
.0003
.0004
.0005
.0007
.0010
.0014
.0020
.0027
.0037
.0049
.0066
.0087
.0·113
.0146
.0188
.0239
.030'1
.0375
.0465
.0571
.0694
.0838
.1003
.1190
.·1401
.'1635
.'1894
.2177
.2483
.2810
.3·156
.3520
.3897
.4286
.4681
.09
.0002
.0003
.0005
.0007
.0010
.0014
.0019
.0026
.0036
.0048
.0064
.0084
.0110
.0·143
.0'183
.0233
.0294
.0367
.0455
.0559
.0681
.0823
.0985
.1170
.1379
.'1611
.1867
.2'148
.2451
.2776
.3121
.3483
.3859
.4247
.4641
|
|
6 Page 6 |
▲back to top |
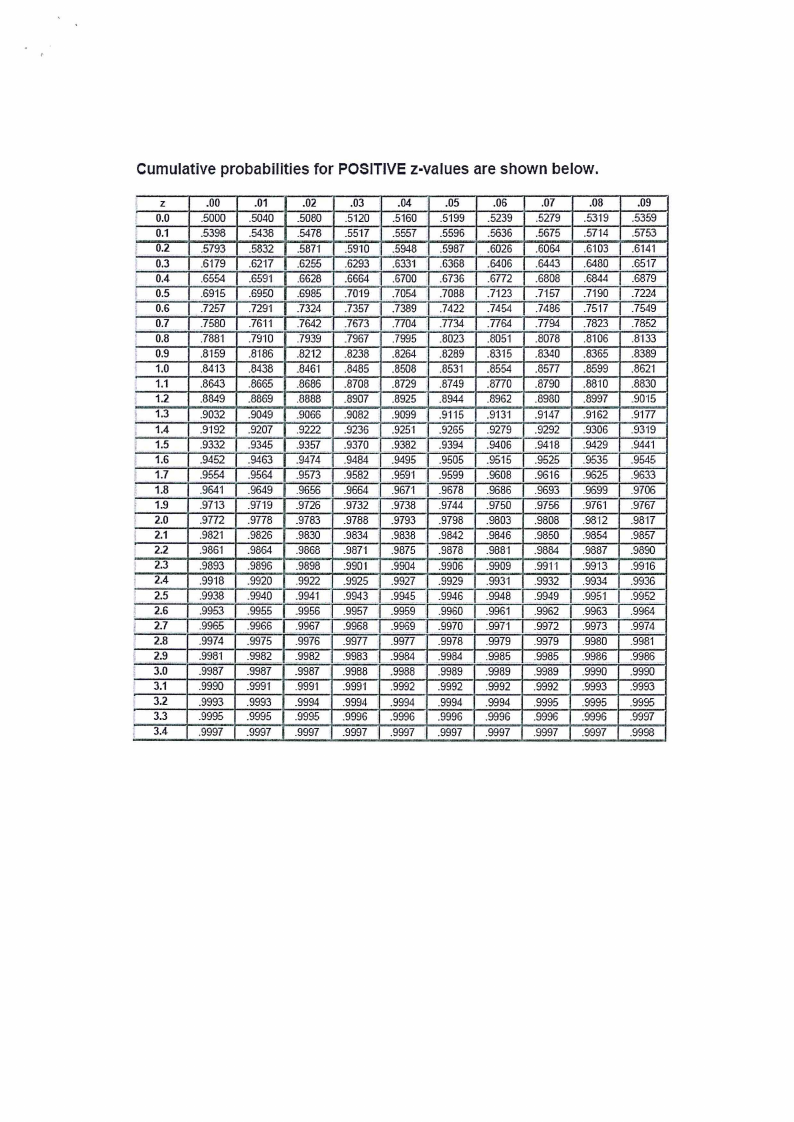
Cumulativeprobabilitiesfor POSITIVEz-valuesare shownbelow.
Iz
I 0.0
; 0.1
;' 0.2
0.3
; 0.4
I 0.5
.i .. 0.6
' 0.7
0.8
0.9
1.0
1.1
I 1.2
I 1.3
I 1.4
i -1.5
l 1.6 -
I 1.7
! 1.8
i 1.9
l 2.0
1 2.1
2.2
2.3
1 2.4
i 2.5
l 2.6
I -2.7
I 2.8
I -·2-.9.
i 3.0
3.1
3.2
3.3
•, 3.4
.00
.01
.02
.5000 .5040 .5080
.5398 .5438 .5478
.5793
.6179
.58. 32
.6217
.5..871
.6255
.6554 .. .6591
.6915 .6950
.6628
.6985
.7257
.7580
.7.2.9"1
.7611
.7324
.7642
.7881 .79"IO .7939
.8159 .8"186 .8212
.8413 .8438 .8461
.8643 .8665 .8686
.8849 .8869 .8888
.9032 .9049 .9066
- .9192
.9332
.9207
.9345
.9222
.9357
.9452 .9463 .9474
.9554 .9564 .9573
.9641 .9649 .9656
.9713 .9719 .9726
.9772 .9778 .9783
.9821 .9826 .9830
.9861 .9864 .9868
.9893 .9896 .9898
.9918 .9920 .9922
.9938 .9940 .9941
.9953 .9955 .9956
.9965 _ .9_966 .9967
.9974 .9975 .9976
.9981
.9987
.9982 . .9982
.9987 .9987
.9990 .9991 .9991
.9993 .9993 .9994
.9995 .9995 .9995
.9997 .9997 .9997
.03
.04
_5·120 I .5160
.5517 .5557
.5910
.6293
··•.-5- .9. 48
.633"1
.6664 .6700
.10·19 .7054
.7}§7 .7389
.7673 .7704
.7967 .7995
.8238 .8264
.8485 .8508
.8708 .8729
.8907 .8925
.9082 .9099
.9236 .9251
.9370 .9382
.9484 .9495
- .9582
.9664
.9591
.967"1
.9732 .9738
.9788 .9793
.9834 .9838
.9871 .9875
.9901 .9904
.9925 .9927
.9943 .9-9-45
.9957 I .9959
.9968
.9977
.9%9 '
.9977
.9983 .9984
.9988 .9988
.999'1 .9992
.9994 .9994
.9996 .9996
.9997 .9997
.05
.5199
.5596
.598-·7·
.6368
.6736
.7088
.7422
.7734
.8023
.8289
.8531
.8749
.8944
.9115
.9265
.9394
.9505
.9599
.9678
.9744
.9798
.9842
.9878
.9906
.9929
.9946
.9960
.9970 .
.9978
.9984
.9989
.9992
.9994
.9996
.9997
.06
.5239
.5636
.6026
.6406
.6772
.7123
.7454
.7764
.8051
.8315
.8554
.8770
.8962
.9131
.9279
.9406
.9515
.9608
.9686
.9750
.9803
.9846
.9881
.9909
.9931
.9948
.9961
.9971
.9979
.9-98.. 5-
.9989
.9992
.9994
.9996
.9997
.07
.5279
.5675
.6064
.6443
.6808
.7"157
.7486
.7794
.8078
.8340
.8577
.8790
.8980
.9147
.9292
.9418
.9525
.9616
.9693
.9756
.9808
.9850
.9884
.9911
.9932
.9949
.9962
.9972
.9979
.9985
.9989
.9992
.9995
.9996
.9997
.08
.5319
.5714
.6103
.6480
.6844
.7190
.7517
.7823
.8106
.8365
.8599
.8810
.8997
.9·162
.9306
.9429
.9535
.9625
.9699
.9761
.9812
.9854
.9887
.9913
.9934
.9951
.9963
.9973
.9980
.998...6
.9990
.9993
.9995
.9996
.9997
.09
.5359
.5753
.6141
.6517
.6879
.7224
.7549. .
.7852
.8133
.8389
.862·1
.8830
.9015
.9177
_93·19
.9441
.9545
.9633
.9706
.9767
.9817
.9857
.9890
.9916
.9936
.9952
.9964
.9974
.9981
.9986
.9990
.9993
.9995
.9997
.9998
|
|
7 Page 7 |
▲back to top |

I
I
I
I
I
I
I
I
II
I
I
I
II
II
II
II
I
I
I
I
I
I
I
I
I
I
.
I
I
I
I
I
I