


 |
ECM712S- ECONOMETRICS- 1ST OPP- JUNE 2023 |
|
|
1 Page 1 |
▲back to top |

nAm I BI A un IVERS ITV
OF S.CEI nCE Ano TECHn OLOGY
FACULTY OFCOMMERCE, HUMAN SCIENCE AND EDUCATION
DEPARTMENT OF ECONOMICS, ACCOUNTING AND FINANCE
QUALIFICATION: BACHELOR OF ECONOMICS
QUALIFICATION CODE:
07BECO
LEVEL: 7
COURSE CODE: ECM712S
COURSE NAME: ECONOMETRICS
SESSION: JUNE 2023
DURATION: 3 HOURS
PAPER:THEORY
MARKS: 100
FIRST OPPORTUNITY EXAMINATION QUESTION PAPER
EXAMINER(S) MR. PINEHAS NANGULA
MODERATOR: Dr R. KAMAT!
INSTRUCTIONS
1. Answer ALL the questions in section A and B
2. Write clearly and neatly.
3. Number the answers clearly.
PERMISSIBLE MATERIALS
I. Scientific calculator
2. Pen and Pencil
3. Ruler
This question paper consists of _6_ pages (including this front page)
|
|
2 Page 2 |
▲back to top |
SECTION A
[20MARKS]
MULTIPLE CHOICE QUESTIONS
1. OLSstands for what in Econometrics?
a) Optimally Linearized Solution
b) There is no such thing in Econometrics
c) The only rock band that Econometricians are crazy about
d) Ordinary Least Squares
2. Data collected at a point in time is called
a) Cross-sectional data
b) Time series data
c) Pooled data
d) Panel data
3. Data collected for a variable over a period of time is called
a) Cross-sectional data
b) Time series data
c) Pooled data
d) Panel data
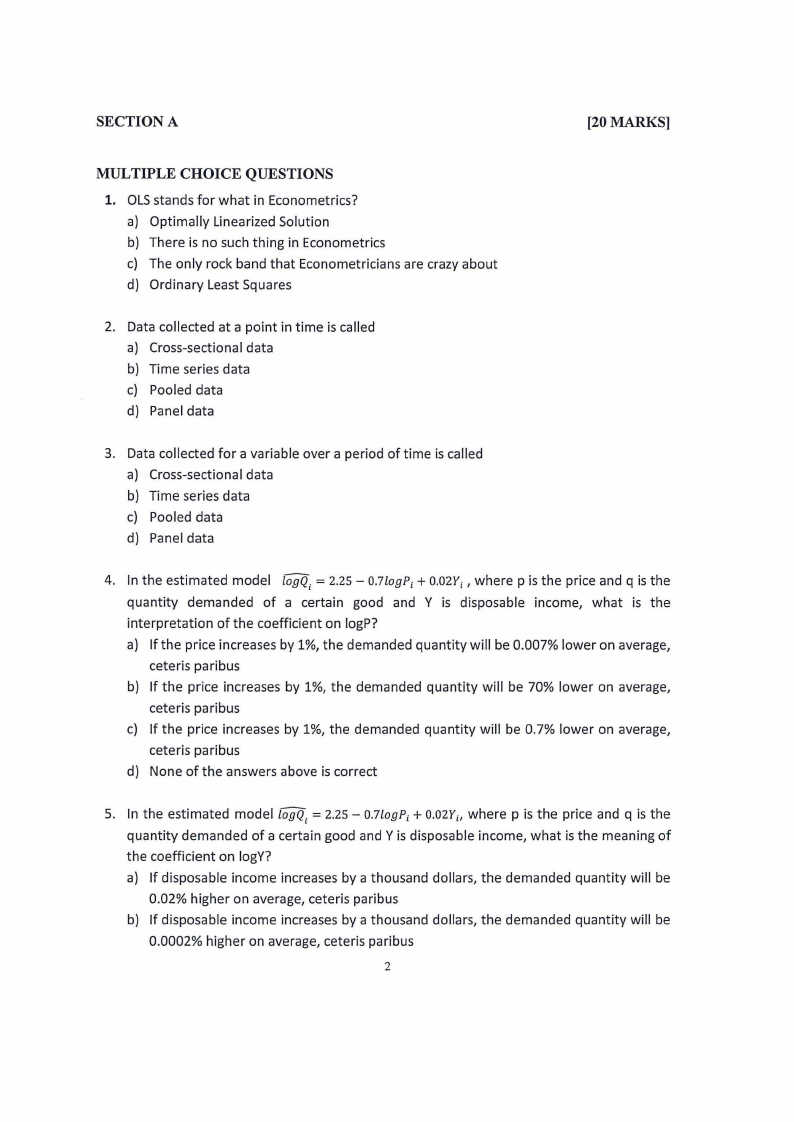
4. In the estimated model logQi = 2.25 - 0.7/ogP; + 0.02Y;, where pis the price and q is the
quantity demanded of a certain good and Y is disposable income, what is the
interpretation of the coefficient on logP?
a) If the price increases by 1%, the demanded quantity will be 0.007% lower on average,
ceteris paribus
b) If the price increases by 1%, the demanded quantity will be 70% lower on average,
ceteris paribus
c) If the price increases by 1%, the demanded quantity will be 0.7% lower on average,
ceteris paribus
d) None of the answers above is correct
5. In the estimated model logQ. = 2.25 - 0.7logP; + 0.02Y;, where pis the price and q is the
l
quantity demanded of a certain good and Y is disposable income, what is the meaning of
the coefficient on logY?
a) If disposable income increases by a thousand dollars, the demanded quantity will be
0.02% higher on average, ceteris paribus
b) If disposable income increases by a thousand dollars, the demanded quantity will be
0.0002% higher on average, ceteris paribus
2
|
|
3 Page 3 |
▲back to top |

c) If disposable income increases by a thousand dollars, the demanded quantity will be
2% higher on average, ceteris paribus
d) None of the answers above is correct
6. Which of the following are alternative names for the dependent variable {usually denoted
by y) in linear regression analysis?
a) The regressand
b) The regressor
c) The explanatory variable
d) None of the above
7. Which of the following statements is TRUEconcerning OLSestimation?
a) OLSminimises the sum of the vertical distances from the points to the line
b) OLSminimises the sum of the squares of the vertical distances from the points to the
line
c) OLSminimises the sum of the horizontal distances from the points to the line
d) OLS minimises the sum of the squares of the horizontal distances from the points to
the line.
8. The residual from a standard regression model is defined as
a) The difference between the actual value, y, and the mean, y-bar
b) The difference between the fitted value, y-hat, and the mean, y-bar
c) The difference between the actual value, y, and the fitted value, y-hat
d) The square of the difference between the fitted value, y-hat, and the mean, y-bar
9. Which one of the following statements best describes the algebraic representation of the
fitted regression line?
a)
"
Yr
=a,.+.
f;.i. x,+u,.,.
b)
YA r=
aA +
fo
t
c) YA , =aA + /AJ,x+ui
d) Y, =a+fix+, u,
10. Which one of the following statements best describes a Type II error?
a. It is the probability of incorrectly rejecting the null hypothesis
b. It is equivalent to the power of the test
c. It is equivalent to the size of the test
d. It is the probability of failing to reject a null hypothesis that was wrong
3
|
|
4 Page 4 |
▲back to top |
SECTIONB
[80 MARKS]
QUESTION ONE
[30 MARKS]
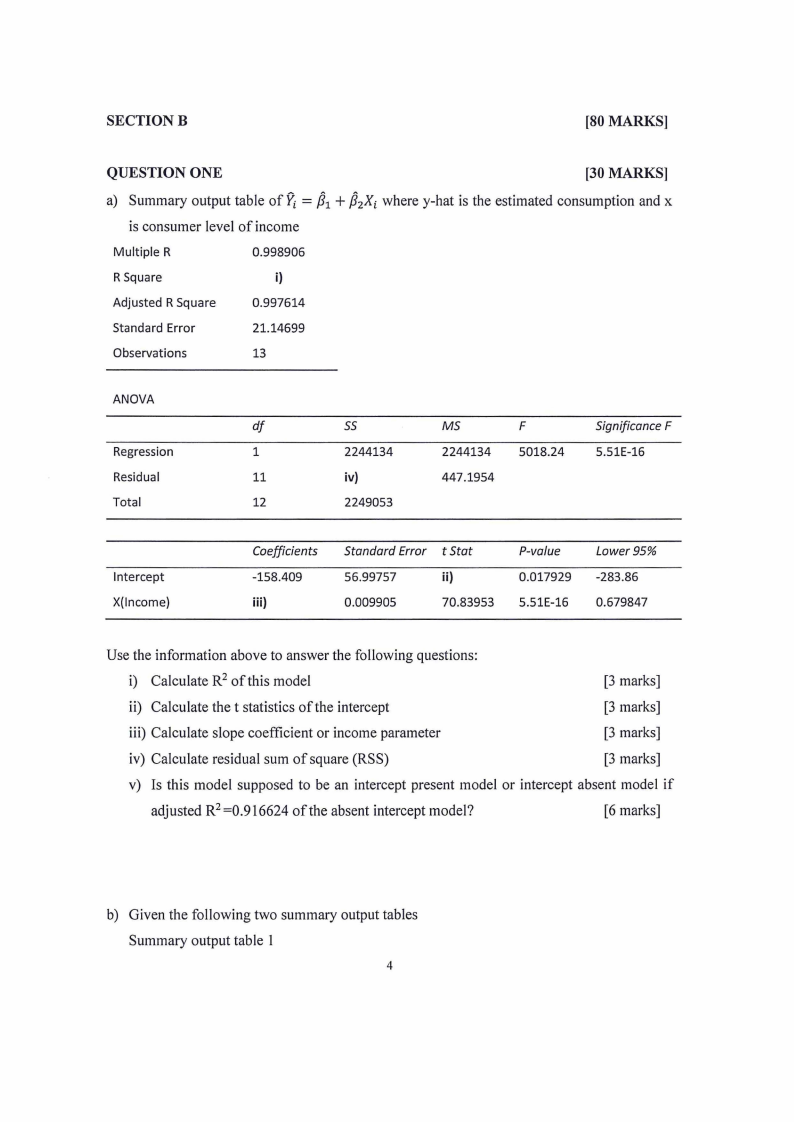
p a) Summary output table of Yi = 1 + PzXi where y-hat is the estimated consumption and x
is consumer level of income
Multiple R
0.998906
R Square
i)
Adjusted R Square
0.997614
Standard Error
21.14699
Observations
13
ANOVA
df
55
MS
F
Significance F
Regression
1
2244134
2244134 5018.24
5.51E-16
Residual
11
iv)
447.1954
Total
12
2249053
Intercept
X(lncome)
Coefficients
-158.409
iii)
Standard Error t Stat
56.99757
ii)
0.009905
70.83953
P-va/ue
0.017929
5.51E-16
Lower 95%
-283.86
0.679847
Use the information above to answer the following questions:
i) Calculate R2 of this model
[3 marks]
ii) Calculate the t statistics of the intercept
[3 marks]
iii) Calculate slope coefficient or income parameter
[3 marks]
iv) Calculate residual sum of square (RSS)
[3 marks]
v) Is this model supposed to be an intercept present model or intercept absent model if
adjusted R2 =0.916624 of the absent intercept model?
[6 marks]
b) Given the following two summary output tables
Summary output table 1
4
|
|
5 Page 5 |
▲back to top |
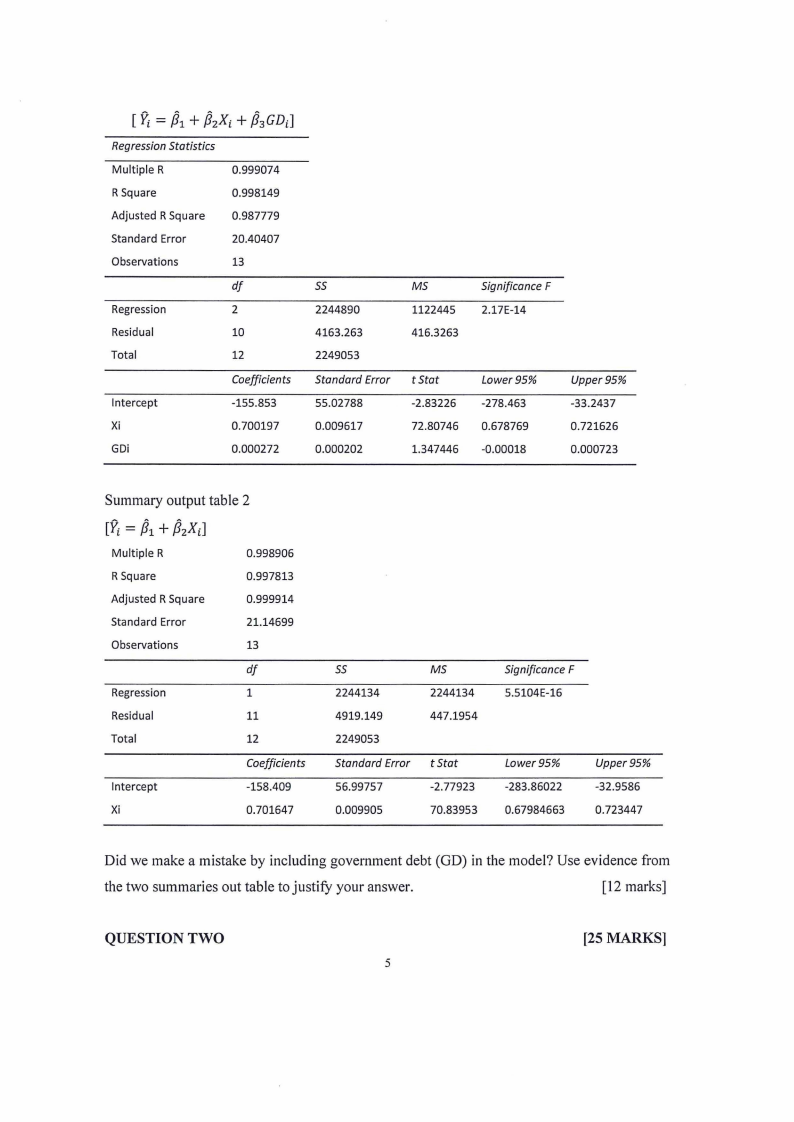
[ = /J1+ /J2Xi+ /J3GDi]
Regression Statistics
Multiple R
0.999074
R Square
0.998149
Adjusted R Square 0.987779
Standard Error
20.40407
Observations
13
df
ss
Regression
2
2244890
Residual
10
4163.263
Total
12
2249053
Coefficients Standard Error
Intercept
-155.853
55.02788
Xi
0.700197
0.009617
GDi
0.000272
0.000202
MS
1122445
416.3263
t Stat
-2.83226
72.80746
1.347446
Significance F
2.17E-14
Lower95%
-278.463
0.678769
-0.00018
Upper95%
-33.2437
0.721626
0.000723
Summary output table 2
[Yi= /J1+ /J2Xi]
Multiple R
0.998906
R Square
0.997813
Adjusted R Square
0.999914
Standard Error
21.14699
Observations
13
df
Regression
1
Residual
11
Total
12
Coefficients
Intercept
-158.409
Xi
0.701647
ss
MS
2244134
2244134
4919.149
447.1954
2249053
Standard Error t Stat
56.99757
-2.77923
0.009905
70.83953
Significance F
5.5104E-16
Lower95%
-283.86022
0.67984663
Upper95%
-32.9586
0.723447
Did we make a mistake by including government debt (GD) in the model? Use evidence from
the two summaries out table to justify your answer.
[12 marks]
QUESTION TWO
5
[25 MARKS]
|
|
6 Page 6 |
▲back to top |

A researcher is using data for a sample of 10consumers to investigate the relationship
between the annual consumption C; and annual income l;.
Year
Income, /1
Consumption, C,
2010
12003
10810
2011
13307
11000
2012
14001
13706
2013
15305
14605
2014
18707
16807
2015
19905
18203
2016
21502
20207
2017
23202
22406
2018
25603
24202
2019
27904
25508
Use the information in the table above to compute the following:
a) If=1i2 i =?
b) If=1c/ =?
c} If=1ct=?
[5 marks]
[5 marks]
[15 marks]
QUESTION THREE
[25MARKS]
a) With proper examples draw a distinction between mathematical and econometric model?
[6 marks]
b) Discuss the two types of error that arise in hypothetical conclusions
[4 marks]
c) Explain four differences between model with intercept and model without intercept
[8 marks]
d) Given~ = 7.6182 + 0.08145Xiand Y = 29, X = 262.5.Use elasticity of expenditure to
interpret the model above.
[4 marks]
e) What do we mean by a linear regression model in parameters?
[3 marks]
All the best
'I,,
6
|
|
7 Page 7 |
▲back to top |

j Tables
T-11
Table entry for p and C is
the critical value t· with
probability plying to its
right and probability C lying
between -t• and t'.
=a If, 1 :ii :Ill t
t distribution critical values
"~~'!'~ITT
t*
.. ' ..
Upper-Lail prnbability p
df
.25
.20
.IS
.10
.05
.025
.02
.01
.005
.0025
.001
1 1.000 1.376
2
0.816
1.061
3 0.765 0.978
4 0.741 0.941
5
0.727
0.920
6 0.718 0.906
.. 7
0.711
0.896
8 0.706 0.889
9 0.703 0.88'3
10 0. 7.QO.. , 0.879
11 0.697 0.876
12 0.695 0.873
13 0.694 0.870
14 0.692
0.868
..
15
16''
": 17
' 18
0.691
-~'6.69b
0.689
0.688
0.866
o,sc5
0'.863
J'.9,862
19 0.688 '0.861
-~s20
> , ii
0.687
0.686
0.890
0.859
22
0,686
0.858
23
0,685
0.858
24 0.685 0.857
25 0.684 0.856
26 '0.684
o:8s6
,, . 2278
-0.684' 0.855
0.683, . 0.855
:t~g:·~;{.0,68,:,. ,· '0.854
__0_.__91!_~-;1'0,~5'1
40 0.681 0.851
50
0.679
0.849
60 0.679 0.848
80 0.678 0.846
100 0.677 0.845
1000
0.675
0.842
z'
0.674
0.841
1.963
3.078
6.314
12.71
15.89
1.386 1.886 2.920 4.303 4.849
1.250 1.638 2.353 3.182 3.482
1.190
1.533
2.132
2.776
2.999
1.156 1.476 2.015 2.571 2.757
1.134
1.440
L943
2.447
2.612
1.119 1.415 1.895 2.365 2.517
1.108
1.39=7 1.860 . 2.306
2.449
1.100
1.383
1.833
2.262
2.398
1.093
1.372
1.812 2.228
2.359
1.088 1.363
1.796 2.2oi
2.328
1.083
1.356
1.782
2.179
2.303
1.079
1.350
1.771 2.160
2.282
1.076 1.345 1.761 2.145 2.264
1.074
1.341
1.753
2.131
2.249
1.071 1.337 1.746. . 2.120 2.235
1.969
l'.333 \\ 1.740
2.IJO
2.224
1.067
1.330 ' T.734
2_.101 2.214
1.066
1.328
1.7:29 2.093 · 2.205
1,064
1.325
1.725 . '2,086
2.1·97
1.063
1.323
1.721
2.080
2.189
1.061
1.321
1.717
2.074
2.183
1.060
1.319
1.714
2.069
2.177
1.059
1.318
1.711
2.064
2.172
1.058 1.316 1.708 2.060 2.167
1.058
1.315
l..?Op 2.056
2.162
1.057
1.314
1.703 ·' 2.052
2.158
1.056 '1.313
1.701.
, 1.05s·, .,· 'u 1.1 ·· ,1,699
L.05?, •.''•·u-10,. ·. 1.697
2.048 ''2)54
2,045 ,,, 2,;150
2.042 .• ',2:147
1.050
1.303
i.684
2.021
2.123
1.047
1.299
1.676
2.009
2.109
1.045
1.296
1.671
2.000
2.099
1.043
1.292
1.664
1.990
2.088
1.042
1.290
1.660
1.984
2.081
1.037
1.282
1.646
1.962
2.056
1.036
1.282
1.645
1.960
2.054
31.82
6.965
4.541
3.747
3.365
3.143
2.998
2.896
2.8:21
·2.764
2.718
2.681
2.650
2.624
2.602
2.583
2.567
2.,552
2.539
2.528
2.518
2.508
2.500
2.492
2.485
2:479
2.473
· 2.467
2:462
'
2·.457
2.423
2.403
2.390
2.374
2.364
2.330
2.326
63.66
9.925
5.841
4.604
4.032
3.707
3.499
3.355
3.250
,3.1,69
3.106
3.055
3.012
2.977
2.947
2.921
2.898
2.878
2.&61
2:845
2.h1·
2.819
2.807
2.797
2.787
2.779
2.771
2,763
•2:156
' ·'2.7-50
2.704
2.678
2.660
2.639
2.626
2.581
2.576
127.3
318.3
14.09
22.33
7.453
10.21
5.598
7.173
4.773
5.893
4.317
5.208
4.029
4.785
3.833
4:SOI
3.690
4.297
3.581
4.144
3.497
4.025
3.428
3.930
3.372
3.852
3.326
3.787
3.286
3.733
J:252.
3:686
3.222
3.646
3.197
·'.3.174.
,.
,,
;3.61-l
:l.579
3.153 ·..3_552
3°.135 3.527
3.119
3.505
3.104
3.485
3.091
3.467
3.078
3.450
3:067
3:435
~.057. . 3.421
3:047 ''3A08
-3.038';,, J\\3.396:
}_.0,30- 3.385
2.971
3.307
2.937
3.261
2.915
3.232
2.887
3.195
2.871
3.174
2.813
3.098
2.807
3.091
50%
60%
70%
80%
90%
95%
96%
98%
99%
99.5%
99.8%
Confidence level C
.0005
636.6
31.60
12.92
8.610
6.869
5.959
5.408
5.041
4.781
4.587
4.437
4.318
4.221
4.140
4.073
4.015
3:965
3.922
''3.883
'3,85'o ·
3.819
3.792
3.768
3,745
3.725
3.707
3.690
3.674
.3. ·:659,
J.646
3.551
3.496
3.460
3.416
3.390
3.300
3.291
99.9%