


 |
ECM712S- ECONOMETRICS- 2ND OPP- JUNE 2023 |
|
|
1 Page 1 |
▲back to top |
J
nAmlBIA unlVERSITY
OF SCIEnCE Ano TECHnOLOGY
FACULTY OFCOMMERCE, HUMAN SCIENCE AND EDUCATION
DEPARTMENT OF ECONOMICS, ACCOUNTING AND FINANCE
QUALIFICATION:BACHELOROF ECONOMICS
QUALIFICATION CODE: 07BECO
LEVEL: 7
COURSECODE: ECM712s
COURSENAME: ECONOMETRICS
SESSION:June 2023
PAPER:THEORY
DURATION: 3 HOURS
MARKS: 100
SECONDOPPORTUNITY EXAMINATION QUESTION PAPER
EXAMINER(S) MR. PINEHAS NANGULA
MODERATOR: Dr R. KAMATI
INSTRUCTIONS
1. Answer ALL the questions in section A and B
2. Write clearly and neatly.
3. Number the answers clearly.
PERMISSIBLEMATERIALS
1. Scientific calculator
2. Pen and Pencil
3. Ruler
THIS QUESTION PAPERCONSISTSOF _5_ PAGES(Including this front page)
|
|
2 Page 2 |
▲back to top |
SECTION A
[20 MARKS]
MULTIPLE CHOICE QUESTIONS
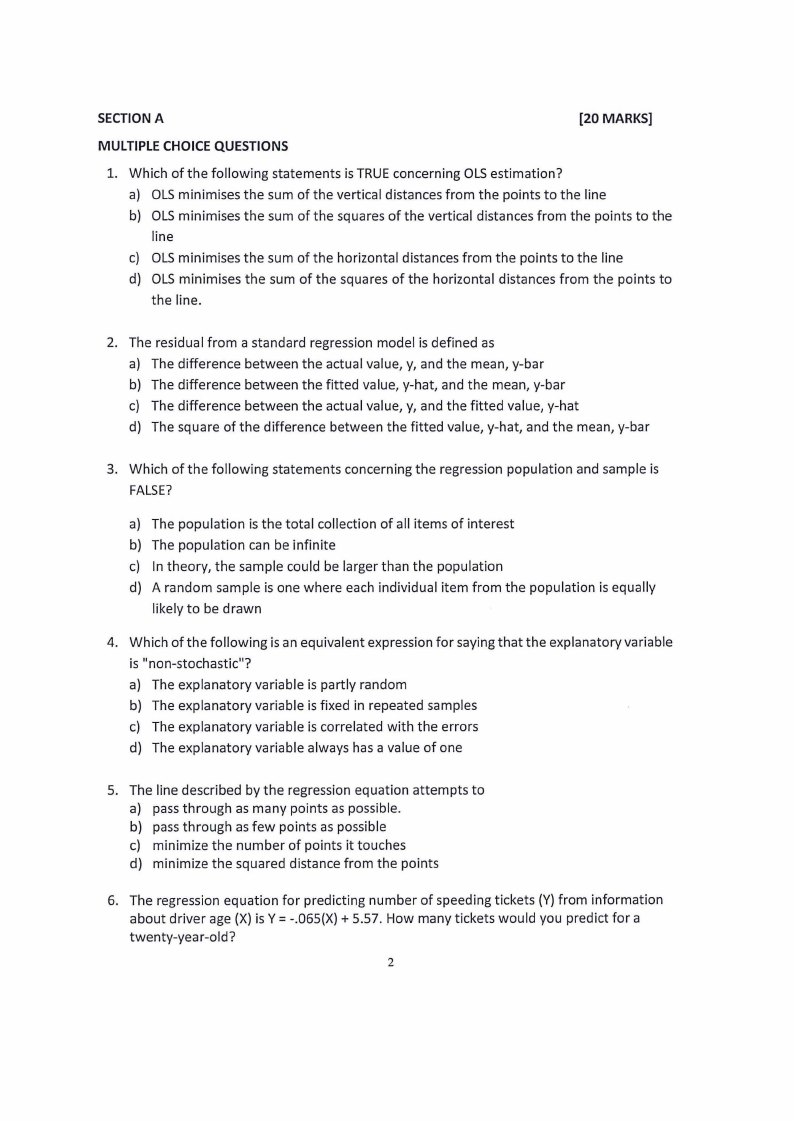
1. Which of the following statements is TRUEconcerning OLSestimation?
a) OLSminimises the sum of the vertical distances from the points to the line
b) OLSminimises the sum of the squares of the vertical distances from the points to the
line
c) OLSminimises the sum of the horizontal distances from the points to the line
d) OLS minimises the sum of the squares of the horizontal distances from the points to
the line.
2. The residual from a standard regression model is defined as
a) The difference between the actual value, y, and the mean, y-bar
b) The difference between the fitted value, y-hat, and the mean, y-bar
c) The difference between the actual value, y, and the fitted value, y-hat
d) The square of the difference between the fitted value, y-hat, and the mean, y-bar
3. Which of the following statements concerning the regression population and sample is
FALSE?
a) The population is the total collection of all items of interest
b) The population can be infinite
c) In theory, the sample could be larger than the population
d) A random sample is one where each individual item from the population is equally
likely to be drawn
4. Which of the following is an equivalent expression for saying that the explanatory variable
is "non-stochastic"?
a) The explanatory variable is partly random
b) The explanatory variable is fixed in repeated samples
c) The explanatory variable is correlated with the errors
d) The explanatory variable always has a value of one
5. The line described by the regression equation attempts to
a) pass through as many points as possible.
b) pass through as few points as possible
c) minimize the number of points it touches
d) minimize the squared distance from the points
6. The regression equation for predicting number of speeding tickets (Y) from information
about driver age (X) is Y = -.065(X) + 5.57. How many tickets would you predict for a
twenty-year-old?
2
|
|
3 Page 3 |
▲back to top |
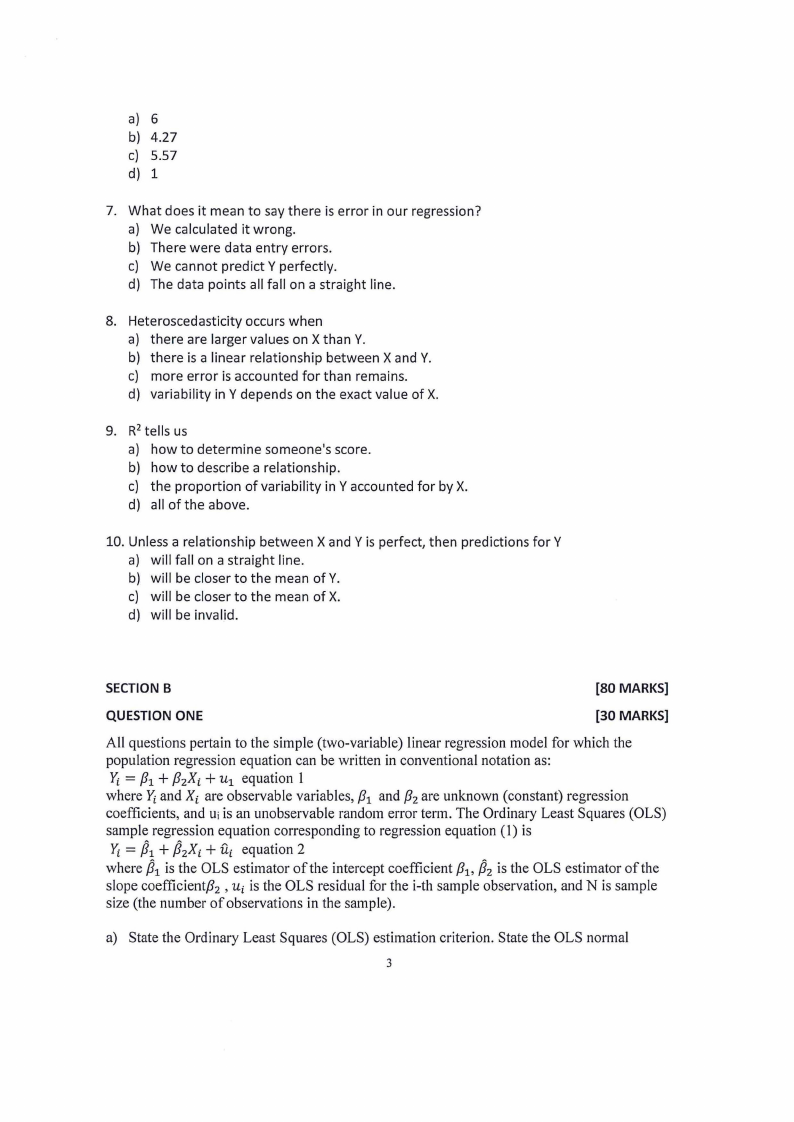
a) 6
b) 4.27
c) 5.57
d) 1
7. What does it mean to say there is error in our regression?
a) We calculated it wrong.
b) There were data entry errors.
c) We cannot predict V perfectly.
d) The data points all fall on a straight line.
8. Heteroscedasticity occurs when
a) there are larger values on X than V.
b) there is a linear relationship between X and V.
c) more error is accounted for than remains.
d) variability in V depends on the exact value of X.
9. R2 tells us
a) how to determine someone's score.
b) how to describe a relationship.
c) the proportion of variability in V accounted for by X.
d) all of the above.
10. Unless a relationship between X and Vis perfect, then predictions for V
a) will fall on a straight line.
b) will be closer to the mean of V.
c) will be closer to the mean of X.
d) will be invalid.
SECTION B
[80 MARKS]
QUESTION ONE
[30 MARKS]
All questions pertain to the simple (two-variable) linear regression model for which the
population regression equation can be written in conventional notation as:
ff = /31+ f32Xi+ u1 equation 1
where ff and Xi are observable variables, {31 and /32 are unknown (constant) regression
coefficients, and Ui is an unobservable random error term. The Ordinary Least Squares (OLS)
sample regression equation corresponding to regression equation (1) is
ff = P1 + P2Xi + fi.i equation 2
where P1 is the OLS estimator of the intercept coefficient {31, P2 is the OLS estimator of the
slope coefficient/3 2 , ui is the OLS residual for the i-th sample observation, and N is sample
size (the number of observations in the sample).
a) State the Ordinary Least Squares (OLS) estimation criterion. State the OLS normal
3
|
|
4 Page 4 |
▲back to top |
equations.
[5 marks]
b) Derive the OLS normal equations from the OLS estimation criterion.
[5 marks]
c) Show that the OLS slope coefficient estimator,81 , is a linear function of the Yi, sample
values.
[10 marks]
d) Stating explicitly all required assumptions, prove that the OLS slope coefficient estimator
,82 is an unbiased estimator of the slope coefficient [32 •
[10 marks]
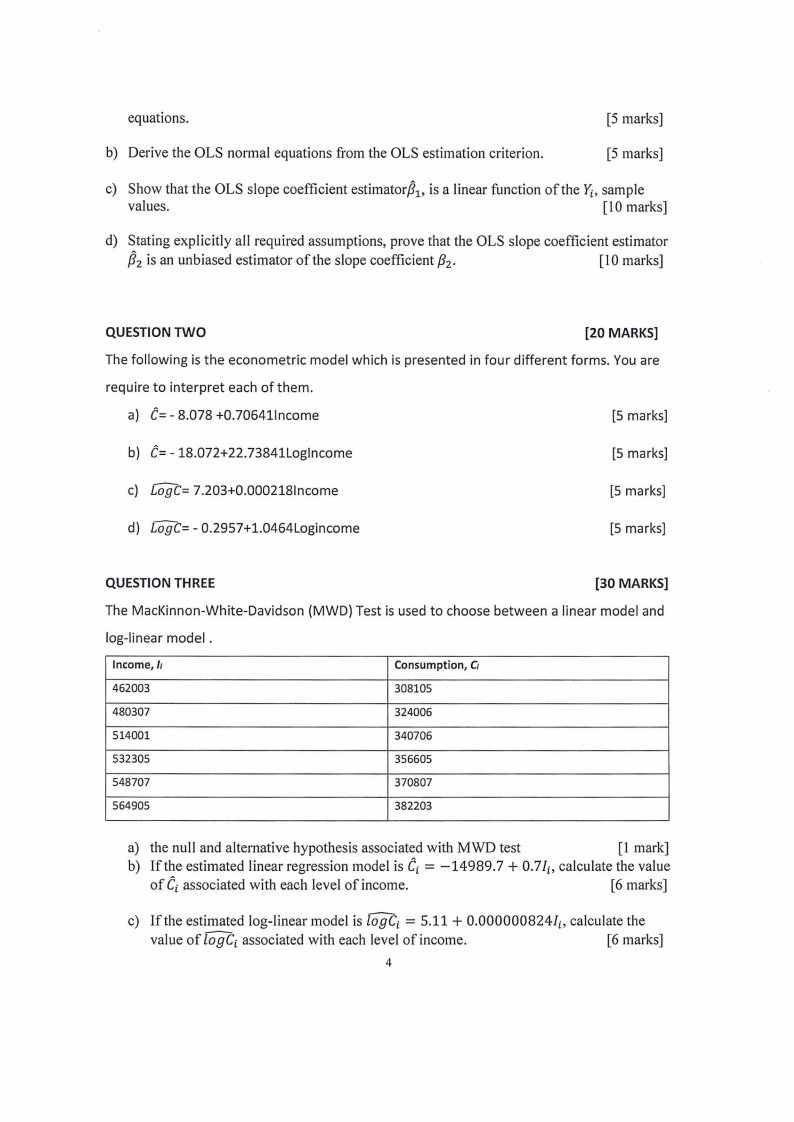
QUESTION TWO
[20 MARKS]
The following is the econometric model which is presented in four different forms. You are
require to interpret each of them.
a) C= - 8.078 +0.706411ncome
[5 marks]
b) C= - 18.072+22.73841Loglncome
[5 marks]
c) LogC= 7.203+0.0002181ncome
[5 marks]
d) LogC= - 0.2957+1.0464Logincome
[5 marks]
QUESTION THREE
[30 MARKS]
The MacKinnon-White-Davidson (MWD) Test is used to choose between a linear model and
log-linear model .
Income, Ii
462003
480307
514001
532305
548707
564905
Consumption, Ci
308105
324006
340706
356605
370807
382203
a) the null and alternative hypothesis associated with MWD test
[1 mark]
b) If the estimated linear regression model is Ci= -14989.7 + 0.7/i, calculate the value
of Ci associated with each level of income.
[6 marks]
c) If the estimated log-linear model is logCi = 5.11 + 0.000000824/i> calculate the
value of log Ci associated with each level of income.
[6 marks]
4
|
|
5 Page 5 |
▲back to top |
d) Obtain the values of Z1i
[12 marks]
e) The linear regression model which came from regressing consumption on income and
Zli is Ci= -15023.5 + 0.700064h - 125428Z 1i, standard error for Z1i is
317372.1. Use t - statistic and t - critical to evaluate the significance Z1i in the
estimated equation.
[5 marks]
All the best
5
|
|
6 Page 6 |
▲back to top |
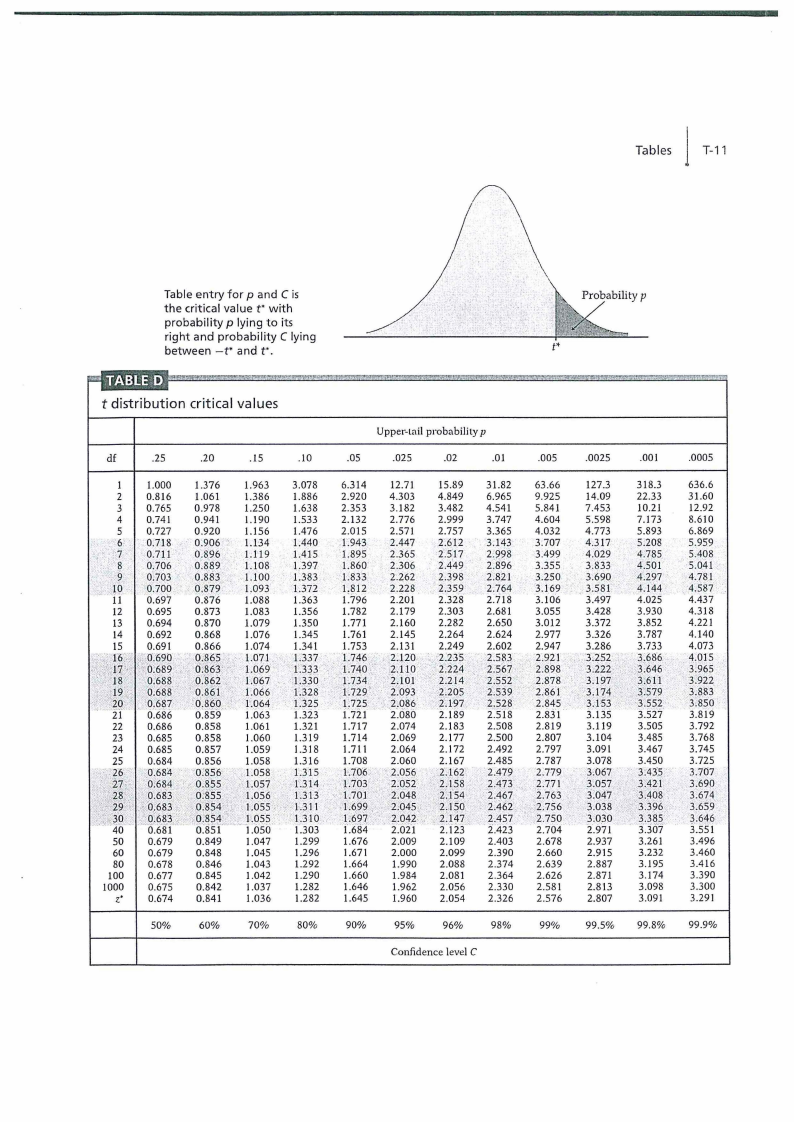
j Tables
T-11
Table entry for p and C is
the critical value t• with
probability p lying to its
right and probability C lying
between -t• and t·.
t*
t distribution critical values
Upper-tail prnbability p
df
.25
.20
.15
.JO
.OS
.025
.02
.01
.005
.0025
.001
.0005
I
1.000 1.376 1.963 3.078 6.314 12.71 15.89 31.82 63.66
127.3
318.3
636.6
2 0.816 1.061
1.386 1.886 2.920 4.303 4.849 6.965 9.925
14.09
22.33
31.60
3 0.765 0.978
1.250 1.638 2.353 3.182 3.482 4.541 5.841
7.453
10.21
12.92
4 0.741 0.941
1.190 1.533 2.132 2.776 2.999 3.747 4.604
5.598
7.173
8.610
5 0.727 0.920
1.156 1.476 2.015 2.571 2.757 3.365 4.032
4.773
5.893
6.869
6 0.718 0:906
1.1-34 1.440 1.943 2.447 2.611 3.143 3.707
4.317
5.208
5.959
7 0.7~1 0.896
1.119 1.415 1.895 2.365 2.517 2.998 3.499
4.029
4.785
5.408
8 0.706 0'.889 1.108 1.397
1.860 2.306 2.449 2.896 3.355
3.833
4.501
5.041
,::,
_
:_1_.0•_\\_,·_· .
0:703
0.100
0.883
b.879-
LI 00 . 1.383
1.093 1.372
1.833
1.812
2.262
2.228
2.398
2.359
2.821
2.764
3.250 3:690 . 4.297 · 4.781
3.169 ·. 3.581. 4.144
4,587
11 0.697 0.876
1.088 1.363 (796
2.201 2.328 2.718 3.106
3.497
4.025
4.437
12 0.695 0.873
1.083 1.356 1.782 2.179 2.303 2.681 3.055
3.428
3.930
4.318
13 0.694 0.870
1.079 1.350 1.771 2.160 2.282 2.650 3.012
3.372
3.852
4.221
14 0.692 0.868
1.076 1.345 1.761 2.145 2.264 2.624 2.977
3.326
3.787
4.140
-~-<r~~i 15 0.691 0.866 1.074 1.341
··<:'fl7··•<i_,1N;f60;6.6989~·-...,·
o.865
0:863'
,.
....
1.01-1 .,
1.069°
1.337
;L333.
1.753
1.746
1.740/
2.131 2.249
2:1.20 ': ·2.~:3'5
2:110"' . 2.224
2.602
2.583
2:567
2.947
3.286
3.733
2.921 .. ,,.3:'.f52, 3.68'6.
2.898 3.222· · .,3.646
4.073
4.015
3.965
·.,718': ·o:688 o.862 ·., 1.001 , . ··1,.3_36, -··n34 . 2.101 2.214 ·2.s52 2.878 . 3.197 ,3:#11
3.922
.. :19 :•. 0.688 .• 0.861 ., 1.066 1·.328 1.7'29' 2.0<)3 ·-2.los. 2.539 2.86 I • · 3.174,: · 3.579
3.883
~,- '!2o•'Z '-'Q.687· ,Q.860 i , 0 1.064 f325
,,.. if o.686 o:8s9.. 1.063 ui3
1.725 · 2.086
i'.721 2'.080
'i:1·97
2.189
2.528
2.518
2.845 , 3.1·53 . ,,3_'552 3.850
2.831
3.135
3.527
3.819
22 0.686 0.858
1.061 1.321
1.717 2.074 2.183 2.508 2.819
3.119
3.505
3.792
23 0.685 0.858
1.060 1.319 1.714 2.069 2.177 2.500 2.807
3.104
3.485
3.768
24 0.685 0.857
1.059 1.318 1.711 2.064 2.172 2.492 2.797
3.091
3.467
3.745
25 0.684 0.856
1.058 1.316 1.708 2.060 2.167 2.485 2.787
3.078
3.450
3.725
"' ,;._26- ,o.6_84 o.856 , 1.058 i.:ns
, 1vf2m,·, · ·o:68~ ., ,. o.855 · :-i:os7
J'.314,
.,'\\ gsi,:: ',0,68~ o:iiss , fos6 : l'.313
·:.:,,.-.'~\\gi:~.i:f;'{-g]~f·>',::]~~.·,,:~6··~ ,fg1·t.·tH-6~··:1~.1;~_~:.·.!fgt} )t;~·~,\\ , "i,=~p,,~";'~0,,683,., .: 0,8?4 ,.,;,., 1.055;-,'.;,. L:311
t,zXs·s L70'6., ,, 2.056 . 2:162
·l.703
2:os2
2.479
J.473:
1.701 ..
2.779
2.111
,1.6J9 ,
1.697 -~ ·-2-:04,2.. 2,147
f.684. 2.021 2.i23
2-.457', .., 2.750
2.423 2.704
· . 3,067
· <3:os7,.,
<
'3,030
·2.971
3~43:s·
_,3:A2i
3.385'
3'.307
3.707
3.690
3.674
3.659,
. J.646
3.551
so 0.679 0.849
1.047 1.299 1.676 2.009 2.109 2.403 2.678
2.937
3.261
3.496
60 0.679 0.848
1.045 1.296 1.671 2.000 2.099 2.390 2.660
2.915
3.232
3.460
80 0.678 0.846
1.043 l.292
1.664 1.990 2.088 2.374 2.639
2.887
3.195
3.416
100 0.677 0.845
1.042 1.290 1.660 1.984 2.081 2.364 2.626
2.871
3.174
3.390
1000 0.675 0.842
1.037 1.282 1.646 1.962 2.056 2.330 2.581
2.813
3.098
3.300
z· 0.674 0.841
1.036 1.282 1.645 I.960 2.054 2.326 2.576
2.807
3.091
3.291
50%
60%
70%
80%
90%
95%
96%
98%
99%
99.5% 99.8% 99.9%
Confidence level C