


 |
BSD721S-BIOSTATISTICS AND DEMOGRAPHY - 1st Opp - JUNE 2022 |
|
|
1 Page 1 |
▲back to top |
nAmlBIA unlVERSITY
OF SCIEnCE Ano TECHnOLOGY
FACULTY OF HEALTH, APPLIED SCIENCES AND NATURAL RESOURCES
DEPARTMENT OF HEALTH SCIENCES
QUALIFICATION: BACHELOR OF SCIENCEIN HEALTH INFORMATION SYSTEMSMANAGEMENT
QUALIFICATION CODE: 07BHIS
LEVEL: 7
COURSE: BIOSTATISTICSAND
DEMOGRAPHY
SESSION: JUNE 2022
COURSE CODE: BSD721S
PAPER: THEORY
DURATION: 3 HOURS
MARKS: 100
EXAMINER
MODERATOR
FIRST OPPORTUNITY EXAMINATION QUESTION PAPER
Dr Jacob Ong'ala
Prof Lillian Pazvakawambwa
INSTRUCTIONS
1. Answer ALL the questions.
2. Show clearly all steps in the calculations.
3. All written work must be done in blue or black ink.
PERMISSIBLE MATERIALS
Scientific Calculator
THIS QUESTION PAPER CONSISTS OF 4 PAGES (including this front page)
1
|
|
2 Page 2 |
▲back to top |
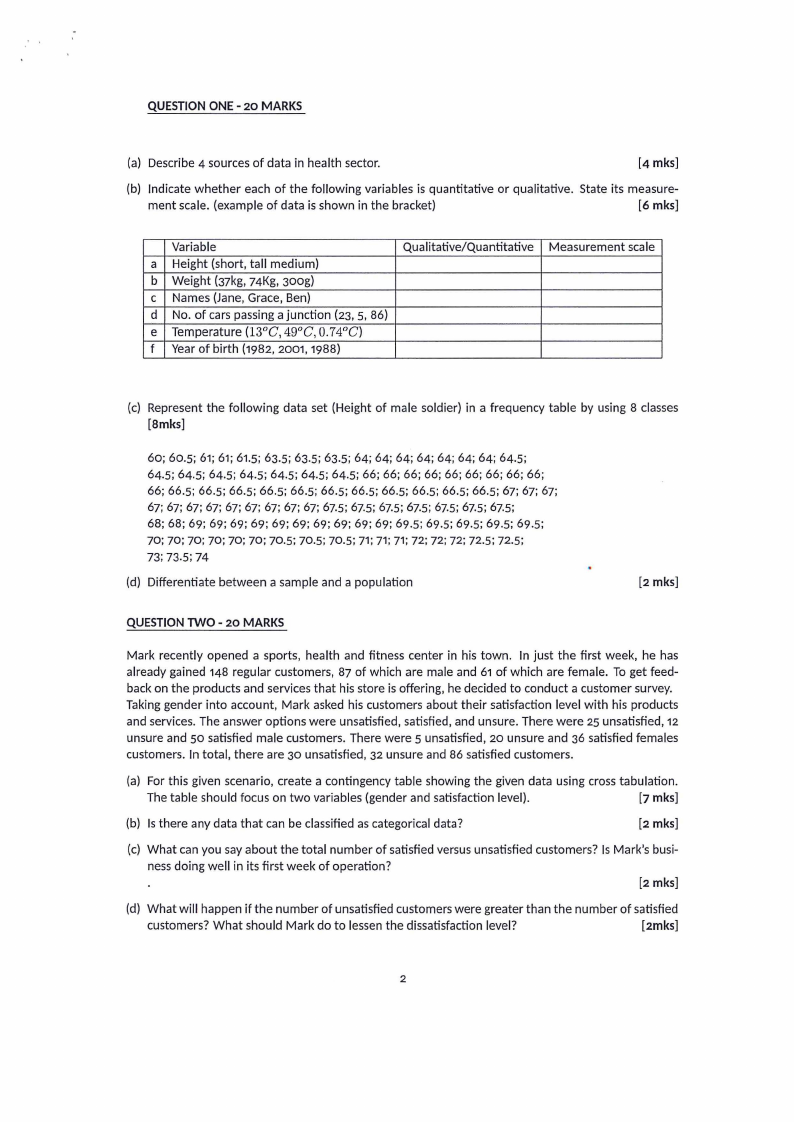
QUESTIONONE- 20 MARKS
(a) Describe 4 sources of data in health sector.
[4mks]
(bl Indicate whether each of the following variables is quantitative or qualitative. State its measure-
ment scale. (example of data is shown in the bracket)
[6 mks]
Variable
Qualitative/Quantitative
a Height (short, tall medium)
b Weight (37kg, 74Kg, 300g)
C Names (Jane, Grace, Ben)
d No. of cars passing a junction (23, s, 86)
e Temperature (13°C, 49°C, 0.74°C)
f Year of birth (1982, 2001, 1988)
Measurement scale
(cl Represent the following data set (Height of male soldier) in a frequency table by using 8 classes
[8mks]
60; 60.s; 61; 61; 61.s; 63.s; 63.s; 63.s; 64; 64; 64; 64; 64; 64; 64; 64.s;
64.5; 64.5; 64.5; 64.5; 64.5; 64.5; 64.5; 66; 66; 66; 66; 66; 66; 66; 66; 66;
66; 66.s; 66.s: 66.s; 66.s; 66.s; 66.s: 66.s: 66.s; 66.s; 66.s; 66.s; 67; 67; 67;
67; 67; 67; 67; 67; 67; 67; 67; 67; 67.5; 67.5; 67.5; 67.5; 67.S;67.S;67.5;
68; 68; 69; 69; 69; 69; 69; 69; 69; 69; 69; 69; 69.S; 69.5; 69.5; 69.5; 69.5;
70; 70; 70; 70; 70; 70; 70.s: 70.s; 70.s; 71;71;71;72; 72; 72; 72.s: 72.s:
73; 73.5; 74
(d) Differentiate between a sample and a population
[2 mks]
QUESTIONTWO- 20 MARKS
Mark recently opened a sports, health and fitness center in his town. In just the first week, he has
already gained 148 regular customers, 87 of which are male and 61 of which are female. To get feed-
back on the products and services that his store is offering, he decided to conduct a customer survey.
Taking gender into account, Mark asked his customers about their satisfaction level with his products
and services. The answer options were unsatisfied, satisfied, and unsure. There were 25 unsatisfied, 12
unsure and so satisfied male customers. There were s unsatisfied, 20 unsure and 36 satisfied females
customers. In total, there are 30 unsatisfied, 32 unsure and 86 satisfied customers.
(a) For this given scenario, create a contingency table showing the given data using cross tabulation.
The table should focus on two variables (gender and satisfaction level).
[7 mks]
(bl Is there any data that can be classified as categorical data?
[2 mks]
(cl What can you say about the total number of satisfied versus unsatisfied customers? Is Mark's busi-
ness doing well in its first week of operation?
[2 mks]
(d) What will happen if the number of unsatisfied customers were greater than the number of satisfied
customers? What should Mark do to lessen the dissatisfaction level?
[2mks]
2
|
|
3 Page 3 |
▲back to top |
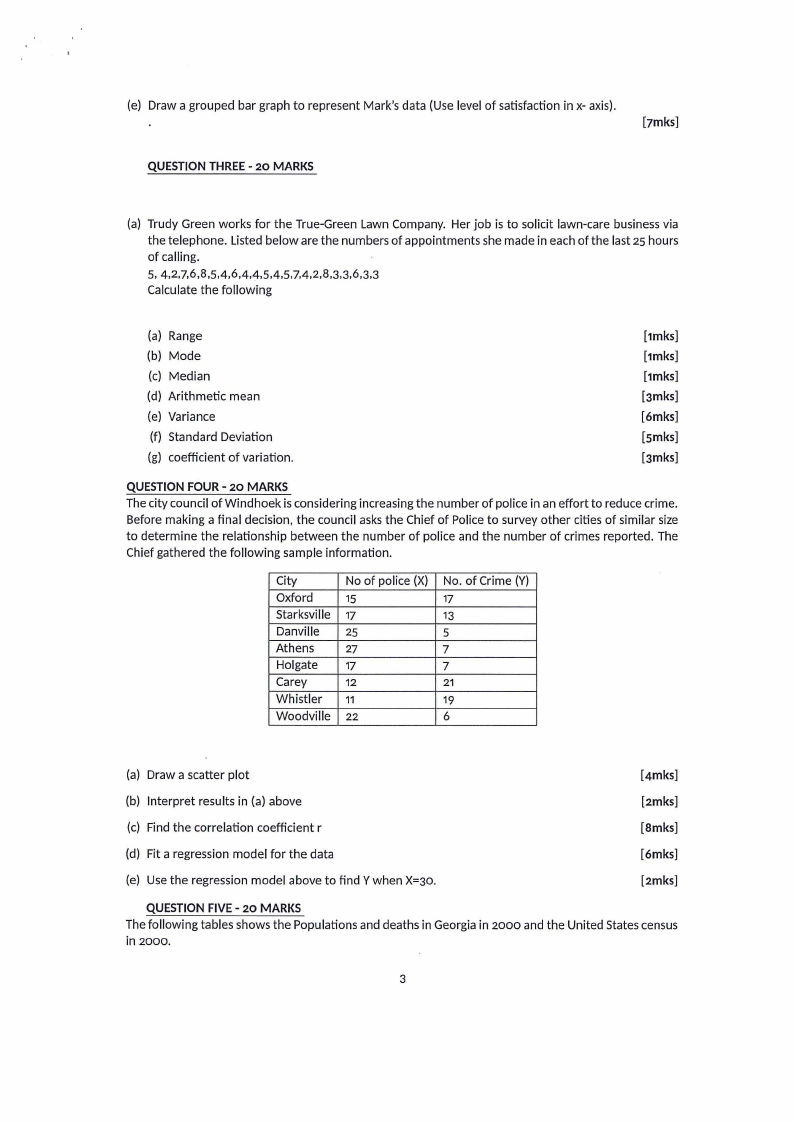
(e) Draw a grouped bar graph to represent Mark's data (Use level of satisfaction in x-axis).
[7mks]
QUESTIONTHREE- 20 MARKS
(a) Trudy Green works for the True-Green Lawn Company. Her job is to solicit lawn-care business via
the telephone. Listed below are the numbers of appointments she made in each of the last 25 hours
of calling.
5, 4,2,7,6,8,5,4,6,4,4,5,4,5,7,4,2,8,3,3,6,3,3
Calculate the following
(a) Range
(b) Mode
(c) Median
(d) Arithmetic mean
(e) Variance
(f) Standard Deviation
(g) coefficient of variation.
[1mks]
[1mks]
[1mks]
[3mks]
[6mks]
[smks]
[3mks]
QUESTIONFOUR- 20 MARKS
The city council of Windhoek is considering increasing the number of police in an effort to reduce crime.
Before making a final decision, the council asks the Chief of Police to survey other cities of similar size
to determine the relationship between the number of police and the number of crimes reported. The
Chief gathered the following sample information.
City
Oxford
Starksville
Danville
Athens
Holgate
Carey
Whistler
Woodville
No of police (X)
15
17
25
27
17
12
11
22
No. of Crime (Y)
17
13
5
7
7
21
19
6
(a) Draw a scatter plot
[4mks]
(b) Interpret results in (a) above
[2mks]
(c) Find the correlation coefficient r
[8mks]
(d) Fit a regression model for the data
(e) Use the regression model above to find Y when X=30.
[6mks]
[2mks]
QUESTIONFIVE- 20 MARKS
The following tables shows the Populations and deaths in Georgia in 2000 and the United States census
in 2000.
3
|
|
4 Page 4 |
▲back to top |
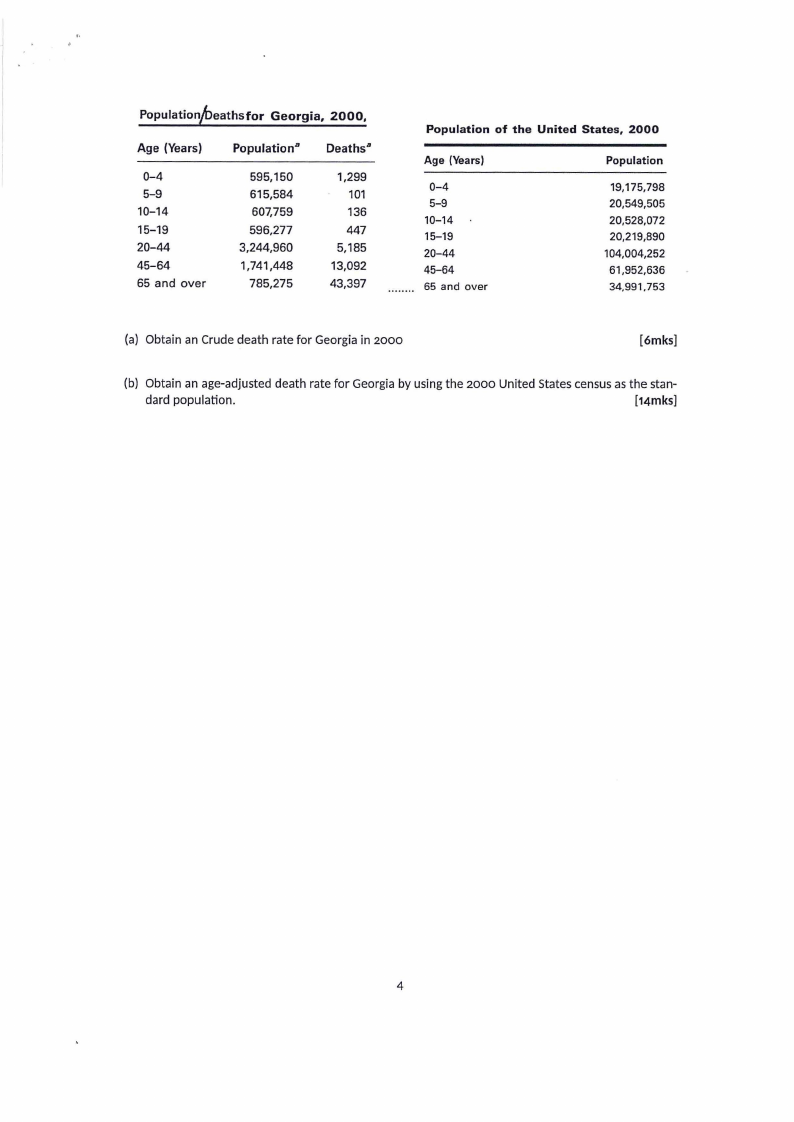
Populationfaeathsfor Georgia, 2000,
Age (Years)
0-4
5-9
10-14
15-19
20-44
45-64
65 and over
Populationa
595,150
615,584
607,759
596,277
3,244,960
1,741,448
785,275
Deathsa
1,299
101
136
447
5,185
13,092
43,397
Population of the United States, 2000
Age (Years)
0-4
5-9
10-14
15-19
20-44
45-64
65 and over
Population
19,175,798
20,549,505
20,528,072
20,219,890
104,004,252
61,952,636
34,991,753
(a) Obtain an Crude death rate for Georgia in 2000
[6mks]
(b) Obtain an age-adjusted death rate for Georgia by using the 2000 United States census as the stan-
dard population.
[14mks]
4