


 |
DEM602S - DEMOGRAPHY - 1ST OPP - NOV 2022 |
|
|
1 Page 1 |
▲back to top |
nAm I BI A u n IVE RS ITY
OF SCIEn CE Ano TECHn OLOGY
FACULTYOF HEALTH,NATURAL RESOURCESAND APPLIEDSCIENCES
DEPARTMENT OF MATHEMATICS AND STATISTICS
QUALIFICATION: Bachelor of science in Applied Mathematics and Statistics
QUALIFICATION CODE: 07BSAM
LEVEL: 6
COURSE CODE: DEM602S
COURSE NAME: DEMOGRAPHY
SESSION: NOVEMBER 2022
DURATION: 3 HOURS
PAPER: THEORY
MARKS: 80
EXAMINER
FIRSTOPPORTUNITY EXAMINATION QUESTION PAPER
MR. ROUX, AJ
MODERATOR:
Mr SWARTZ,J
INSTRUCTIONS
1. Answer ALL the questions in the booklet provided.
2. Show clearly all the steps used in the calculations.
3. All written work must be done in blue or black ink and sketches must
be done in pencil.
PERMISSIBLEMATERIALS
1. Non-programmable calculator without a cover.
THIS QUESTION PAPER CONSISTS OF 4 PAGES (Including this front page)
1
|
|
2 Page 2 |
▲back to top |
QUESTION . 1 : Introduction to Demography [30]
1.1) State and explain the variables use in the equations used to calculate
1.1.1) Crude birth rate
(3)
1.1.2) Crude death rate
(3)
1.1.3) Crude migration rate
(3)
1.2) State the balancing formula which is used to express population growth. ( identify
all variables in the formula) ·· ·
(3)
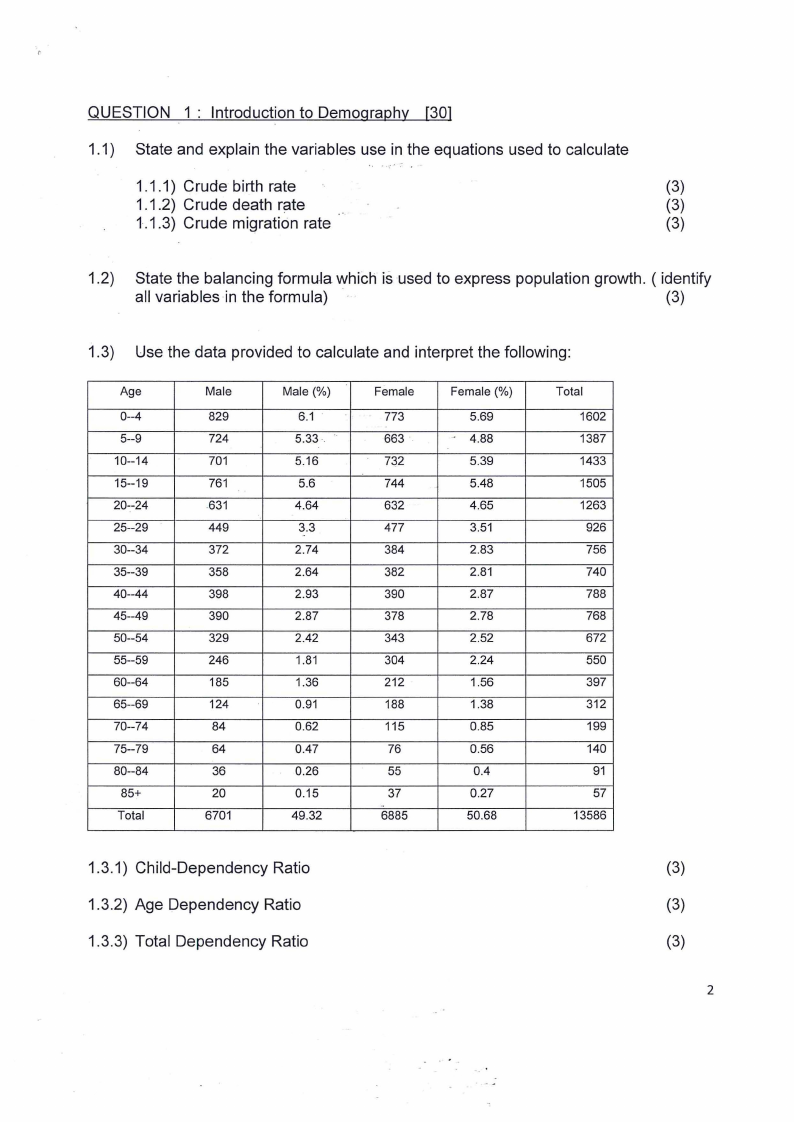
1.3) Use the data provided to calculate and interpret the following:
Age
0--4
5--9
10--14
15--19
20--24
25--29
30--34
35--39
40--44
45--49
50--54
55--59
60--64
65--69
70--74
75--79
80--84
85+
Total
Male
829
724
701
761
631
449
372
358
398
390
329
246
185
124
84
64
36
20
6701
Male(%)
6.1 ·
5.33 .
5.16
5.6
4.64
3-.3
2.74
2.64
2.93
2.87
2.42
1.81
1.36
0.91
0.62
0.47
0.26
0.15
49.32
Female
773
663
732
744
632
477
384
382
390
378
343
304
212
188
115
76
55
.. 37
6885
Female(%)
5.69
.. 4.88
5.39
5.48
4.65
3.51
2.83
2.81
2.87
2.78
2.52
2.24
1.56
1.38
0.85
0.56
0.4
0.27
50.68
Total
1602
1387
1433
1505
1263
926
756
740
788
768
672
550
397
312
199
140
91
57
13586
1.3.1) Child-Dependency Ratio
1.3.2) Age Dependency Ratio
1.3.3) Total Dependency Ratio
(3)
(3)
(3)
2
|
|
3 Page 3 |
▲back to top |
1.3.4) Gender Ratio
(3)
1.3.5) The median age of the population
(6)
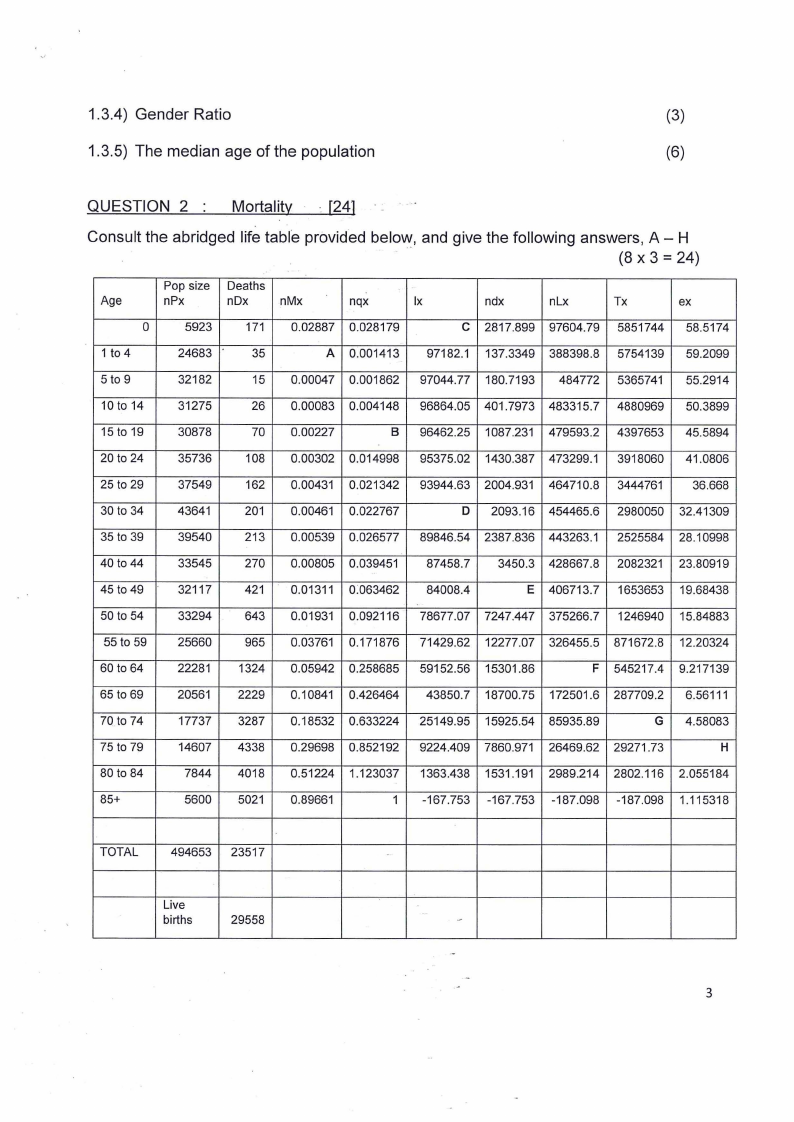
QUESTION 2 : Mortality
[241
Consult the abridged life table provided below., and give the following answers, A - H
(8 X 3 = 24)
Pop size Deaths
Age
nPx
nDx
nMx
nqx
Ix
ndx
nLx
Tx
ex
0
5923
171 0.02887 0.028179
C 2817.899 97604.79 5851744 58.5174
1 to 4
24683
35
A 0.001413
97182.1 137.3349 388398.8 5754139 59.2099
5 to 9
32182
15 0.00047 0.001862 97044.77 180.7193 484772 5365741 55.2914
10 to 14
31275
26 0.00083 0.004148 96864.05 401.7973 483315.7 4880969 50.3899
15 to 19
30878
70 0.00227
B 96462.25 1087.231 479593.2 4397653 45.5894
20 to 24
35736
108 0.00302 0.014998 95375.02 1430.387 473299.1 3918060 41.0806
25 to 29
37549
162 0.00431 0.021342 93944.63 2004.931 464710.8 3444761
36.668
30 to 34
43641
201 0.00461 0.022767
D 2093.16 454465.6 2980050 32.41309
35 to 39
39540
213 0.00539 0.026577 89846.54 2387.836 443263.1 2525584 28.10998
40 to 44
33545
270 0.00805 0.039451
87458.7
3450.3 428667.8 2082321 23.80919
45 to 49
32117
421 0.01311 0:063462
84008.4
E 406713.7 1653653 19.68438
50 to 54
33294
643 0.01931 0.092116 78677.07 7247.447 375266.7 1246940 15.84883
55 to 59
60 to 64
65 to 69
70 to 74
75 to 79
80 to 84
85+
25660
22281
20561
17737
14607
7844
5600
965
1324
2229
3287
4338
4018
5021
0.03761 0.171876
0.05942 0.258685
0.10841 0.426464
0.18532 0.633224
0.29698 0.852192
0.51224 1.123037
0.89661
1
71429.62 12277.07 326455.5 871672.8 12.20324
59152.56 15301.86
F 545217.4 9.217139
43850.7 18700.75 172501.6 287709.2 6.56111
25149.95 15925.54 85935.89
G 4.58083
9224.409 7860.971 26469.62 29271.73
H
1363.438 1531.191 2989.214 2802.116 2.055184
-167.753 -167.753 -187.098 -187.098 1.115318
TOTAL
494653 23517
Live
births
29558
-
3
|
|
4 Page 4 |
▲back to top |
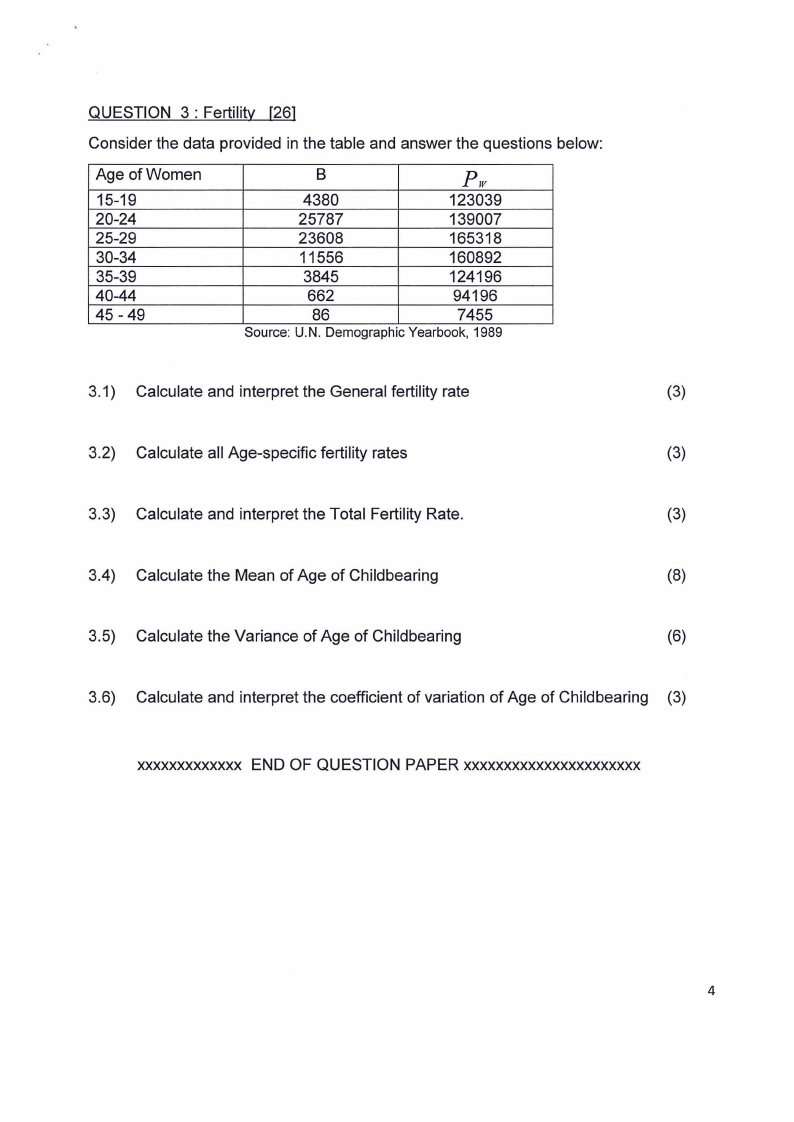
QUESTION 3 : Fertility [26]
Consider the data provided in the table and answer the questions below:
Age of Women
15-19
20-24
25-29
30-34
35-39
40-44
45 -49
B
Pw
4380
123039
25787
139007
23608
165318
11556
160892
3845
124196
662
94196
86
7455
Source: U.N. Demographic Yearbook, 1989
3.1) Calculate and interpret the General fertility rate
(3)
3.2) Calculate all Age-specific fertility rates
(3)
3.3) Calculate and interpret the Total Fertility Rate.
(3)
3.4) Calculate the Mean of Age of Childbearing
(8)
3.5) Calculate the Variance of Age of Childbearing
(6)
3.6) Calculate and interpret the coefficient of variation of Age of Childbearing (3)
xxxxxxxxxxxxx END OF QUESTION PAPER xxxxxxxxxxxxxxxxxxxxxx
4