


 |
DAE702S - DESIGN AND ANALSIS OF EXPERIMENTS - 2ND OPP - JANUARY 2025 |
|
|
1 Page 1 |
▲back to top |
nAml BIA un1VERSITY
OF SCIEnCEAnDTECHnOLOGY
FacultoyfHealthN, atural
ResourceasndApplied
Sciences
Schoool f NaturalandApplied
Sciences
Departmentof Mathematics,
StatisticsandActuarialScience
13JacksonKaujeuaStreet
Private Bag13388
Windhoek
NAMIBIA
T: +264612072913
E: msas@nust.na
W: www.nust.na
QUALIFICATION : Bachelor of Science in Applied Mathematics and Statistics
QUALIFICATION CODE: 07BSAM
LEVEL: 7
COURSE:DESIGN AND ANALYSIS OF EXPERIMENTS
COURSECODE: DAE702S
DATE: JANUARY 2025
SESSION: 1
DURATION: 3 HOURS
MARKS: 100
SECOND OPPORTUNITY/ SUPPLEMENTARY: EXAMINATION QUESTION PAPER
EXAMINER:
MODERATOR:
Dr D Ntirampeba, NUST
Dr P liyambo, UNAM
INSTRUCTIONS:
1. Answer all questions on the separate answer sheet.
2. Please write neatly and legibly.
3. Do not use the left side margin of the answer sheet. This must be allowed for the
examiner.
4. No books, notes and other additional aids are allowed.
5. Write all answers clearly with their respective question numbers.
PERMISSIBLE MATERIALS:
1. Non-Programmable Calculator
ATTACHEMENTS
1. F Table & t-Table
This paper consists of 4 pages excluding this front page
|
|
2 Page 2 |
▲back to top |
Question 1 (20 marks]
1.1 Briefly explain the following terminologies as they are applied to Experimental
Analysis of Variance.
(i) Confounded Factors
(ii) Replicate runs
(iii) Effect
Design and
[2]
[2]
[2]
1.2 Let the fixed effects model for one-way analysis of variance be
ih where Yi} is the observation under the it/' treatment, µ is the overall mean, Ti is the effect
of the ith treatment, and Eij ~ N(O, (/2 ) is random error component, i = 1, 2, ... , k and
j = l, 2, ... , nk. Show that I::~=Til= 0
[5]
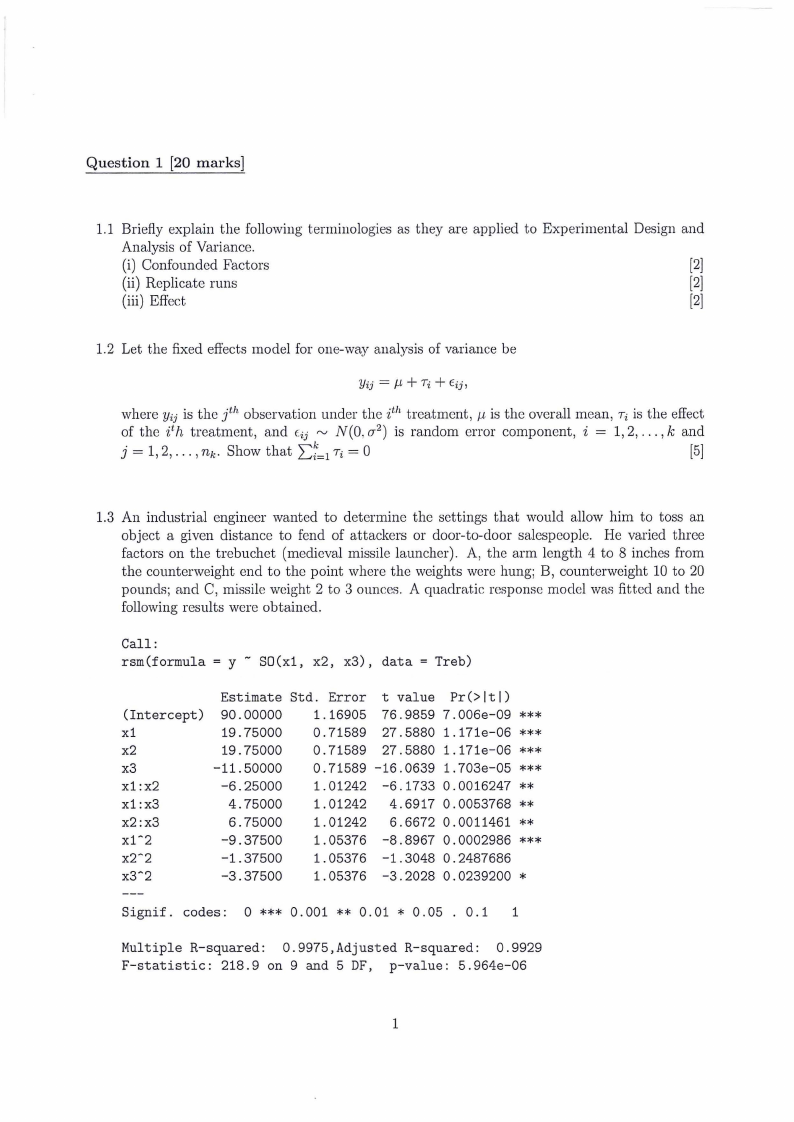
1.3 An industrial engineer wanted to determine the settings that would allow him to toss an
object a given distance to fend of attackers or door-to-door salespeople. He varied three
factors on the trebuchet (medieval missile launcher). A, the arm length 4 to 8 inches from
the counterweight end to the point where the weights were hung; B, counterweight 10 to 20
pounds; and C, missile weight 2 to 3 ounces. A quadratic response model was fitted and the
following results were obtained.
Call:
rsm(formula = y - S0(x1, x2, x3), data= Treb)
(Intercept)
xi
x2
x3
x1:x2
x1:x3
x2:x3
x1-2
xr2
x3-2
Estimate Std. Error t value Pr(>ltl)
90.00000
19.75000
19.75000
1.16905 76.9859 7.006e-09 ***
0.71589 27.5880 1.171e-06 ***
0.71589 27.5880 1.171e-06 ***
-11.50000
0.71589 -16.0639 1.703e-05 ***
-6.25000
1. 01242 -6.1733 0.0016247 **
4.75000
1. 01242 4.6917 0.0053768 **
6.75000
-9.37500
1.01242 6.6672 0.0011461 **
1.05376 -8.8967 0.0002986 ***
-1.37500
1.05376 -1.3048 0.2487686
-3.37500
1.05376 -3.2028 0.0239200 *
Signif. codes: 0 *** 0.001 ** 0.01 * 0.05 . 0.1 1
Multiple R-squared: 0.9975,Adjusted R-squared: 0.9929
F-statistic:
218.9 on 9 and 5 DF, p-value: 5.964e-06
1
|
|
3 Page 3 |
▲back to top |
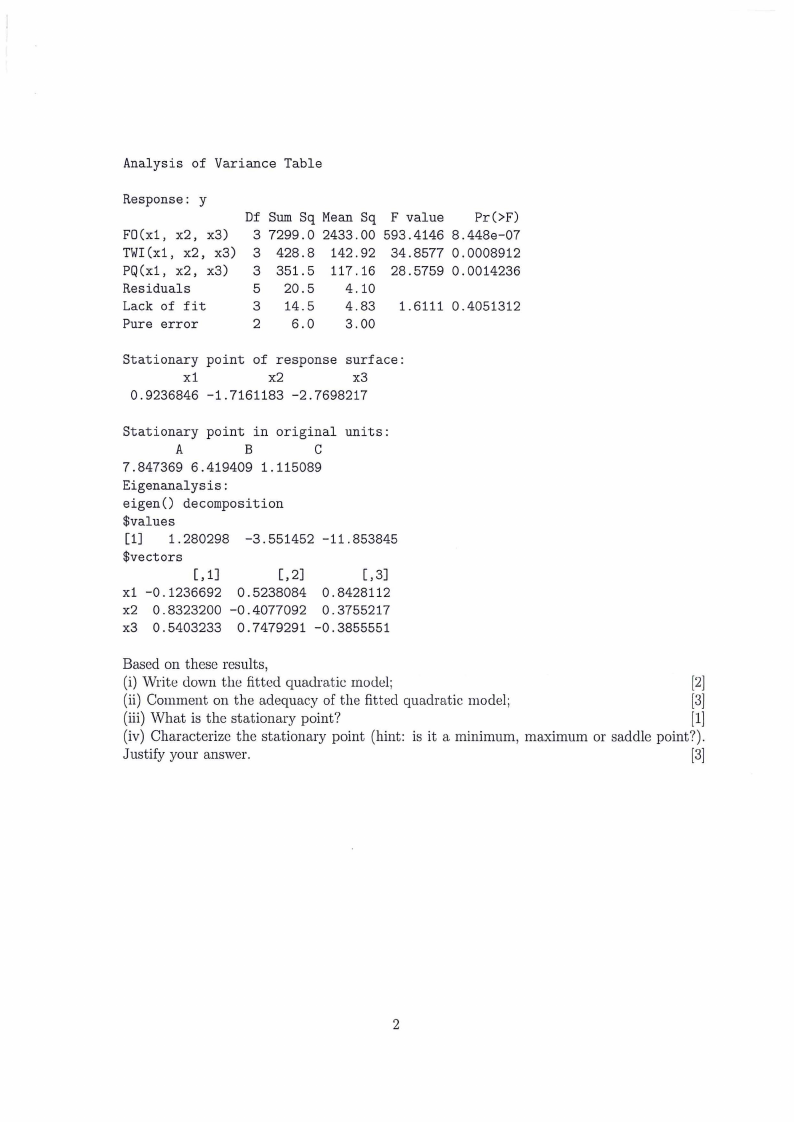
Analysis of Variance Table
Response: y
Df Sum Sq Mean Sq F value Pr(>F)
F0(x1, x2, x3) 3 7299.0 2433.00 593.4146 8.448e-07
TWI(x1, x2, x3) 3 428.8 142.92 34.8577 0.0008912
PQ(x1, x2, x3) 3 351.5 117 .16 28.5759 0.0014236
Residuals
5 20.5 4.10
Lack of fit
3 14.5 4.83 1.6111 0.4051312
Pure error
2 6.0 3.00
Stationary point of response surface:
xi
x2
x3
0.9236846 -1.7161183 -2.7698217
Stationary point in original units:
A
B
C
7.847369 6.419409 1.115089
Eigenanalysis:
eigen() decomposition
$values
[1] 1.280298 -3.551452 -11.853845
$vectors
[,1]
[, 2]
[ '3]
xi -0.1236692 0.5238084 0.8428112
x2 0.8323200 -0.4077092 0.3755217
x3 0.5403233 0.7479291 -0.3855551
Based on these results,
(i) Write down the fitted quadratic model;
[2]
(ii) Comment on the adequacy of the fitted quadratic model;
[3]
(iii) What is the stationary point?
[1]
(iv) Characterize the stationary point (hint: is it a minimum, maximum or saddle point?).
Justify your answer.
[3]
2
|
|
4 Page 4 |
▲back to top |
Question 2 [20 marks]
The yield of a chemical process was measured using five batches of raw material, five acid concen-
trations, five standing times (A, B, C, D, E), and five catalyst concentrations (a, /3,'Y,c5E, ). The
Graeco-Latin square that follows was used.
Batch
1
2
3
4
5
1
Aa = 26
B'Y = 18
CE= 20
D/3 = 15
Ec5= 10
2
B/3 = 16
CJ= 21
Da = 12
E'Y = 15
AE = 24
Acid concetration
3
C'Y = 19
DE= 18
E/3 = 16
Ac5= 22
Ba= 17
4
DS = 16
Ea= 11
A'Y = 25
Be= 14
C/3=17
5
Ee= 13
A/3 = 21
B'Y = 13
Ca= 17
Dc5= 14
2.1 Write down an appropriate effects model for this design.
[5]
2.2 Test the effects of standing times and catalyst concentrations on the yield of the chemical
process(use a= 0.05).
[15]
Question 3 [40 marks]
Consider a study performed to determine if there is a difference in the strength of monofilament
fibre produced by the three different machines. The data from this experiment are shown in the
table below.
Machine 1
y
X
36
20
41
25
39
24
42
25
49
32
Machine 2
y
X
40
22
48
28
39
22
45
30
44
28
Machine 3
y
X
35
21
37
23
42
26
34
21
32
15
3.1 Write down an appropriate model for this dataset.
[3]
3.2 Use the analysis of covariance to remove the effect of the thickness (x) on strength (y) when
testing for differences in strength between machines. Use 5% significance level. Clearly
outline all the steps.
[18]
3.3 Compute the estimate of the regression coefficient.
[2]
3.4 Compute a 95 percent confidence interval on the adjusted mean strength of fibers produced
by machine 1.
[5]
3
|
|
5 Page 5 |
▲back to top |
3.5 Test for the significance of the regression coefficient. Use 5% significance level. Clearly
outline all the steps.
[4]
3.6 At 5% significance level, test the validity of the assumption t.I-1atthe machines do not
affect the the thickness.
[8]
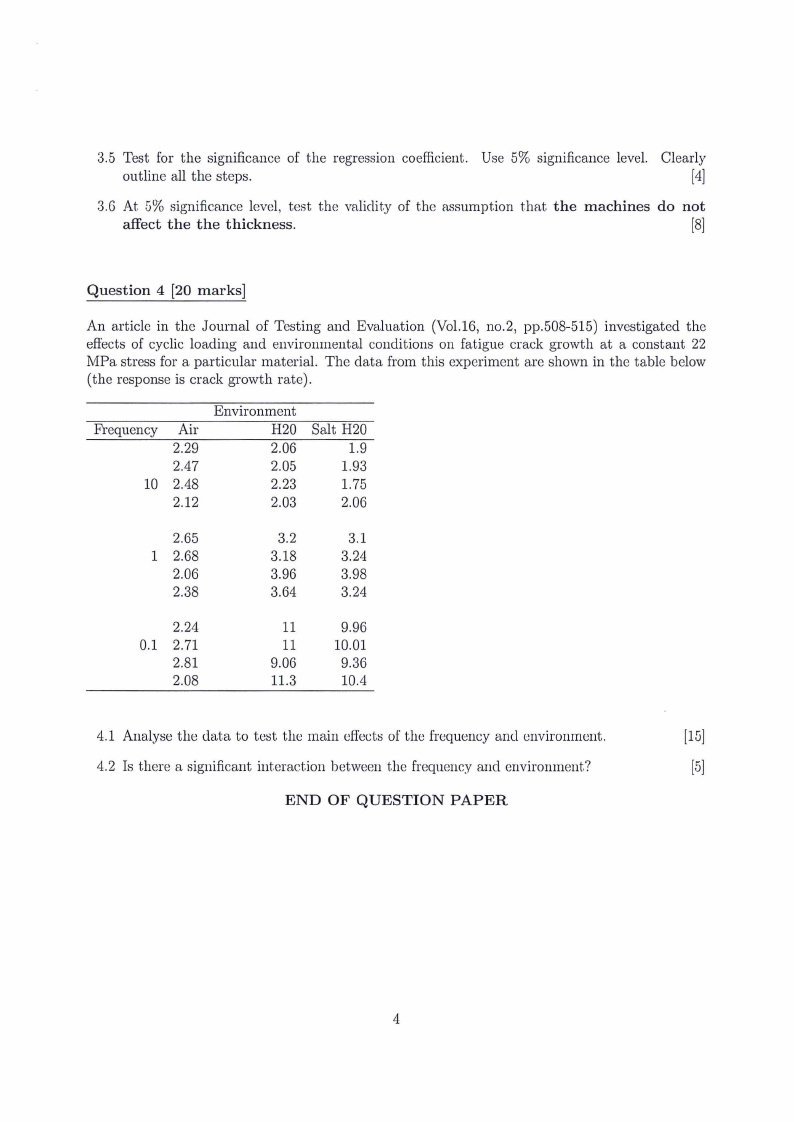
Question 4 [20 marks]
An article in the Journal of Testing and Evaluation (Vol.16, no.2, pp.508-515) investigated the
effects of cyclic loading and environmental conditions on fatigue crack growth at a constant 22
MPa stress for a particular material. The data from this experiment are shown in the table below
(the response is crack growth rate).
Environment
Frequency Air
H20 Salt H20
2.29
2.06
1.9
2.47
2.05
1.93
10 2.48
2.23
1.75
2.12
2.03
2.06
2.65
1 2.68
2.06
2.38
3.2
3.1
3.18
3.24
3.96
3.98
3.64
3.24
2.24
0.1 2.71
2.81
2.08
11
9.96
11 10.01
9.06
9.36
11.3
10.4
4.1 Analyse the data to test the main effects of the frequency and environment.
[15]
4.2 Is there a significant interaction between the frequency and environment?
[5]
END OF QUESTION PAPER
4
|
|
6 Page 6 |
▲back to top |
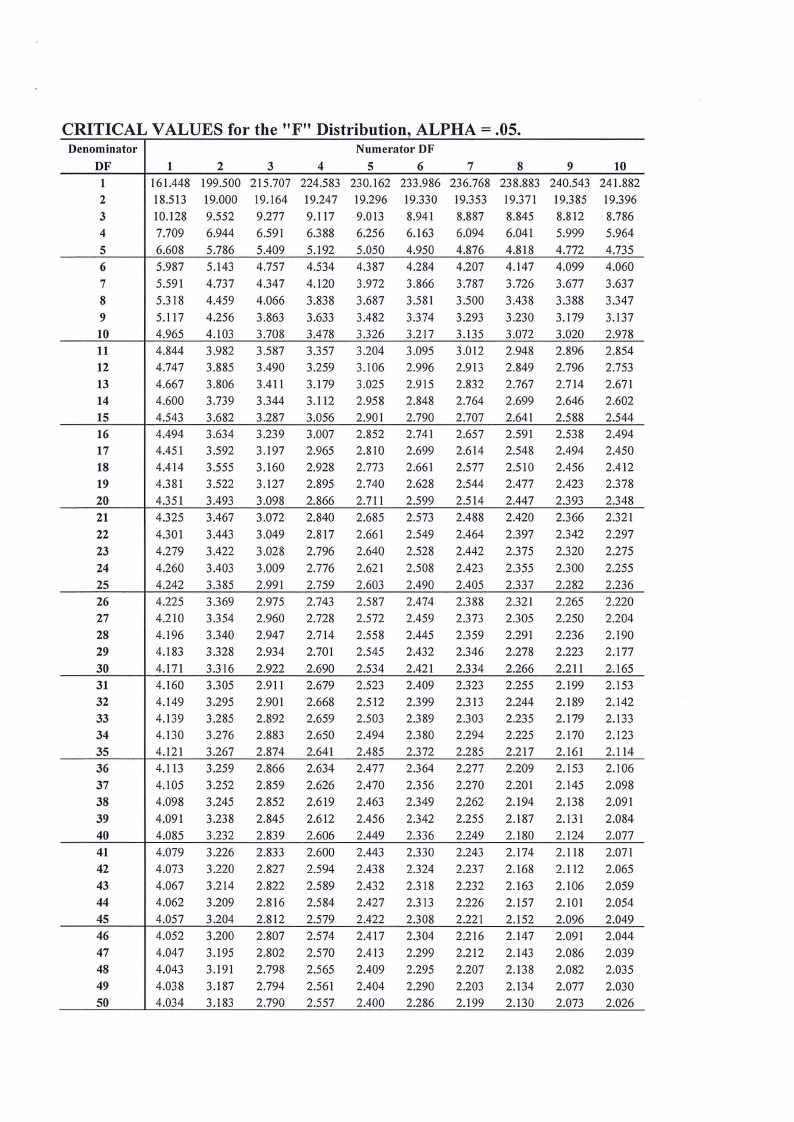
CRITICAL VALUES for the "F" Distribution, ALPHA = .05.
Denominator
Numerator DF
DF
1
2
3
4
5
6
7
8
1
161.448 199.500 215.707 224.583 230.162 233.986 236.768 238.883
2
I 8.513 19.000 19.164 19.247 19.296 19.330 19.353 19.371
3
10.128 9.552 9.277 9.117 9.013 8.941 8.887 8.845
4
7.709 6.944 6.591 6.388 6.256 6.163 6.094 6.041
5
6.608 5.786 5.409 5.192 5.050 4.950 4.876 4.818
6
5.987 5.143 4.757 4.534 4.387 4.284 4.207 4.147
7
5.591 4.737 4.347 4.120 3.972 3.866 3.787 3.726
8
5.318 4.459 4.066 3.838 3.687 3.581 3.500 3.438
9
5.117 4.256 3.863 3.633 3.482 3.374 3.293 3.230
10
4.965 4.103 3.708 3.478 3.326 3.217 3.135 3.072
11
4.844 3.982 3.587 3.357 3.204 3.095 3.012 2.948
12
4.747 3.885 3.490 3.259 3.106 2.996 2.913 2.849
13
4.667 3.806 3.411 3.179 3.025 2.915 2.832 2.767
14
4.600 3.739 3.344 3.112 2.958 2.848 2.764 2.699
15
4.543 3.682 3.287 3.056 2.901 2.790 2.707 2.641
16
4.494 3.634 3.239 3.007 2.852 2.741 2.657 2.591
17
4.451 3.592 3.197 2.965 2.810 2.699 2.614 2.548
18
4.414 3.555 3.160 2.928 2.773 2.661 2.577 2.510
19
4.381 3.522 3.127 2.895 2.740 2.628 2.544 2.477
20
4.351 3.493 3.098 2.866 2.711 2.599 2.514 2.447
21
4.325 3.467 3.072 2.840 2.685 2.573 2.488 2.420
22
4.301 3.443 3.049 2.817 2.661 2.549 2.464 2.397
23
4.279 3.422 3.028 2.796 2.640 2.528 2.442 2.375
24
4.260 3.403 3.009 2.776 2.621 2.508 2.423 2.355
25
4.242 3.385 2.991 2.759 2.603 2.490 2.405 2.337
26
4.225 3.369 2.975 2.743 2.587 2.474 2.388 2.321
27
4.210 3.354 2.960 2.728 2.572 2.459 2.373 2.305
28
4.196 3.340 2.947 2.714 2.558 2.445 2.359 2.291
29
4.183 3.328 2.934 2.701 2.545 2.432 2.346 2.278
30
4.171 3.316 2.922 2.690 2.534 2.421 2.334 2.266
31
4.160 3.305 2.911 2.679 2.523 2.409 2.323 2.255
32
4.149 3.295 2.901 2.668 2.512 2.399 2.313 2.244
33
4.139 3.285 2.892 2.659 2.503 2.389 2.303 2.235
34
4.130 3.276 2.883 2.650 2.494 2.380 2.294 2.225
35
4.121 3.267 2.874 2.641 2.485 2.372 2.285 2.217
36
4.113 3.259 2.866 2.634 2.477 2.364 2.277 2.209
37
4.105 3.252 2.859 2.626 2.470 2.356 2.270 2.201
38
4.098 3.245 2.852 2.619 2.463 2.349 2.262 2.194
39
4.091 3.238 2.845 2.612 2.456 2.342 2.255 2.187
40
4.085 3.232 2.839 2.606 2.449 2.336 2.249 2.180
41
4.079 3.226 2.833 2.600 2.443 2.330 2.243 2.174
42
4.073 3.220 2.827 2.594 2.438 2.324 2.237 2.168
43
4.067 3.214 2.822 2.589 2.432 2.318 2.232 2.163
44
4.062 3.209 2.816 2.584 2.427 2.313 2.226 2.157
45
4.057 3.204 2.812 2.579 2.422 2.308 2.221 2.152
46
4.052 3.200 2.807 2.574 2.417 2.304 2.216 2.147
47
4.047 3.195 2.802 2.570 2.413 2.299 2.212 2.143
48
4.043 3.191 2.798 2.565 2.409 2.295 2.207 2.138
49
4.038 3.187 2.794 2.561 2.404 2.290 2.203 2.134
50
4.034 3.183 2.790 2.557 2.400 2.286 2.199 2.130
9
240.543
19.385
8.812
5.999
4.772
4.099
3.677
3.388
3.179
3.020
2.896
2.796
2.714
2.646
2.588
2.538
2.494
2.456
2.423
2.393
2.366
2.342
2.320
2.300
2.282
2.265
2.250
2.236
2.223
2.211
2.199
2.189
2.179
2.170
2.161
2.153
2.145
2.138
2.131
2.124
2.118
2.112
2.106
2.101
2.096
2.091
2.086
2.082
2.077
2.073
10
241.882
19.396
8.786
5.964
4.735
4.060
3.637
3.347
3.137
2.978
2.854
2.753
2.671
2.602
2.544
2.494
2.450
2.412
2.378
2.348
2.321
2.297
2.275
2.255
2.236
2.220
2.204
2.190
2.177
2.165
2.153
2.142
2.133
2.123
2.114
2.106
2.098
2.091
2.084
2.077
2.071
2.065
2.059
2.054
2.049
2.044
2.039
2.035
2.030
2.026
|
|
7 Page 7 |
▲back to top |
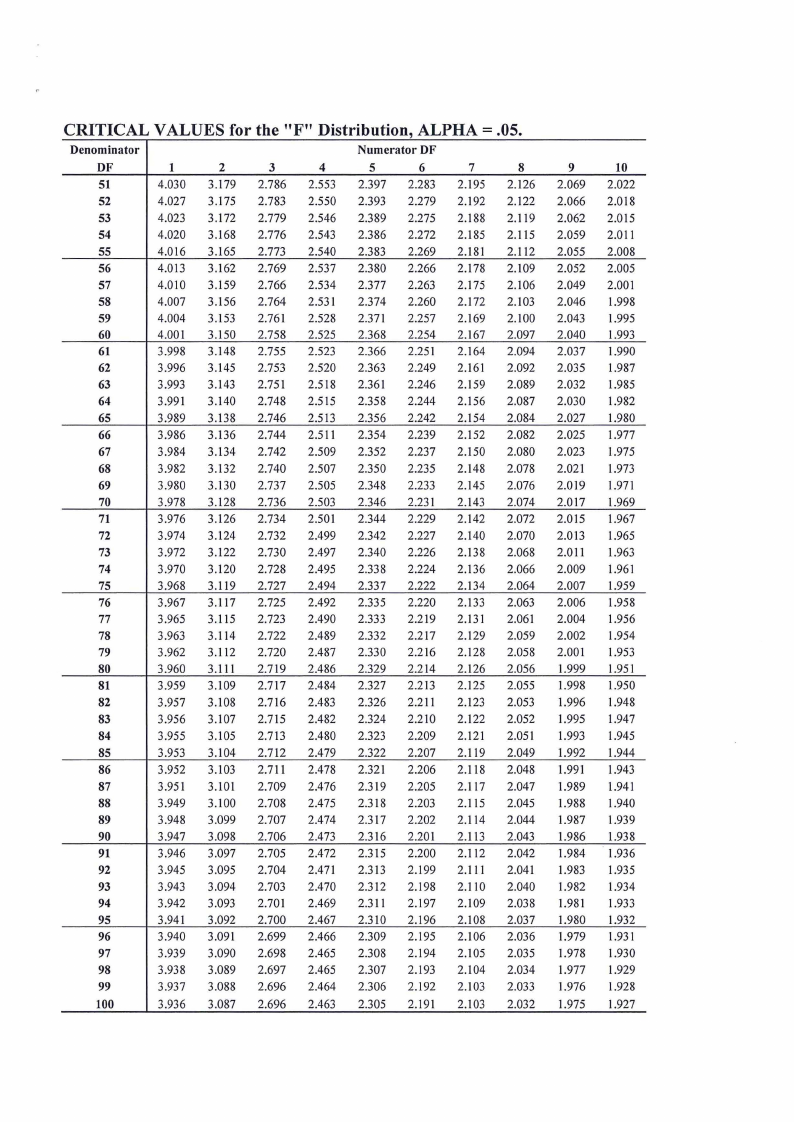
CRITICAL VALUES for the "F" Distribution, ALPHA= .05.
Denominator
Numerator DF
DF
1
2
3
4
5
6
7
8
51
4.030 3.179 2.786 2.553 2.397 2.283 2.195 2.126
52
4.027 3.175 2.783 2.550 2.393 2.279 2.192 2.122
53
4.023 3.172 2.779 2.546 2.389 2.275 2.188 2.119
54
4.020 3.168 2.776 2.543 2.386 2.272 2.185 2.115
55
4.016 3.165 2.773 2.540 2.383 2.269 2.181 2.112
56
4.013 3.162 2.769 2.537 2.380 2.266 2.178 2.109
57
4.010 3.159 2.766 2.534 2.377 2.263 2.175 2.106
58
4.007 3.156 2.764 2.531 2.374 2.260 2.172 2.103
59
4.004 3.153 2.761 2.528 2.371 2.257 2.169 2.100
60
4.001 3.150 2.758 2.525 2.368 2.254 2.167 2.097
61
3.998 3.148 2.755 2.523 2.366 2.251 2.164 2.094
62
3.996 3.145 2.753 2.520 2.363 2.249 2.161 2.092
63
3.993 3.143 2.751 2.518 2.361 2.246 2.159 2.089
64
3.991 3.140 2.748 2.515 2.358 2.244 2.156 2.087
65
3.989 3.138 2.746 2.513 2.356 2.242 2.154 2.084
66
3.986 3.136 2.744 2.511 2.354 2.239 2.152 2.082
67
3.984 3.134 2.742 2.509 2.352 2.237 2.150 2.080
68
3.982 3.132 2.740 2.507 2.350 2.235 2.148 2.078
69
3.980 3.130 2.737 2.505 2.348 2.233 2.145 2.076
70
3.978 3.128 2.736 2.503 2.346 2.231 2.143 2.074
71
3.976 3.126 2.734 2.501 2.344 2.229 2.142 2.072
72
3.974 3.124 2.732 2.499 2.342 2.227 2.140 2.070
73
3.972 3.122 2.730 2.497 2.340 2.226 2.138 2.068
74
3.970 3.120 2.728 2.495 2.338 2.224 2.136 2.066
75
3.968 3.119 2.727 2.494 2.337 2.222 2.134 2.064
76
3.967 3.117 2.725 2.492 2.335 2.220 2.133 2.063
77
3.965 3.115 2.723 2.490 2.333 2.219 2.131 2.061
78
3.963 3.114 2.722 2.489 2.332 2.217 2.129 2.059
79
3.962 3.112 2.720 2.487 2.330 2.216 2.128 2.058
80
3.960 3.111 2.719 2.486 2.329 2.214 2.126 2.056
81
3.959 3.109 2.717 2.484 2.327 2.213 2.125 2.055
82
3.957 3.108 2.716 2.483 2.326 2.211 2.123 2.053
83
3.956 3.107 2.715 2.482 2.324 2.210 2.122 2.052
84
3.955 3.105 2.713 2.480 2.323 2.209 2.121 2.051
85
3.953 3.104 2.712 2.479 2.322 2.207 2.119 2.049
86
3.952 3.103 2.711 2.478 2.321 2.206 2.118 2.048
87
3.951 3.101 2.709 2.476 2.319 2.205 2.117 2.047
88
3.949 3.100 2.708 2.475 2.318 2.203 2.115 2.045
89
3.948 3.099 2.707 2.474 2.317 2.202 2.114 2.044
90
3.947 3.098 2.706 2.473 2.316 2.201 2.113 2.043
91
3.946 3.097 2.705 2.472 2.315 2.200 2.112 2.042
92
3.945 3.095 2.704 2.471 2.313 2.199 2.111 2.041
93
3.943 3.094 2.703 2.470 2.312 2.198 2.110 2.040
94
3.942 3.093 2.701 2.469 2.311 2.197 2.109 2.038
95
3.941 3.092 2.700 2.467 2.310 2.196 2.108 2.037
96
3.940 3.091 2.699 2.466 2.309 2.195 2.106 2.036
97
3.939 3.090 2.698 2.465 2.308 2.194 2.105 2.035
98
3.938 3.089 2.697 2.465 2.307 2.193 2.104 2.034
99
3.937 3.088 2.696 2.464 2.306 2.192 2.103 2.033
100
3.936 3.087 2.696 2.463 2.305 2.191 2.103 2.032
9
2.069
2.066
2.062
2.059
2.055
2.052
2.049
2.046
2.043
2.040
2.037
2.035
2.032
2.030
2.027
2.025
2.023
2.021
2.019
2.017
2.015
2.013
2.011
2.009
2.007
2.006
2.004
2.002
2.001
1.999
1.998
1.996
1.995
1.993
1.992
1.991
1.989
1.988
1.987
1.986
1.984
1.983
1.982
1.981
1.980
1.979
1.978
1.977
1.976
1.975
10
2.022
2.018
2.015
2.011
2.008
2.005
2.001
1.998
1.995
1.993
1.990
1.987
1.985
1.982
1.980
1.977
1.975
1.973
1.971
1.969
1.967
1.965
1.963
1.961
1.959
1.958
1.956
1.954
1.953
1.951
1.950
1.948
1.947
1.945
1.944
1.943
1.941
1.940
1.939
1.938
1.936
1.935
1.934
1.933
1.932
1.931
1.930
1.929
1.928
1.927
|
|
8 Page 8 |
▲back to top |
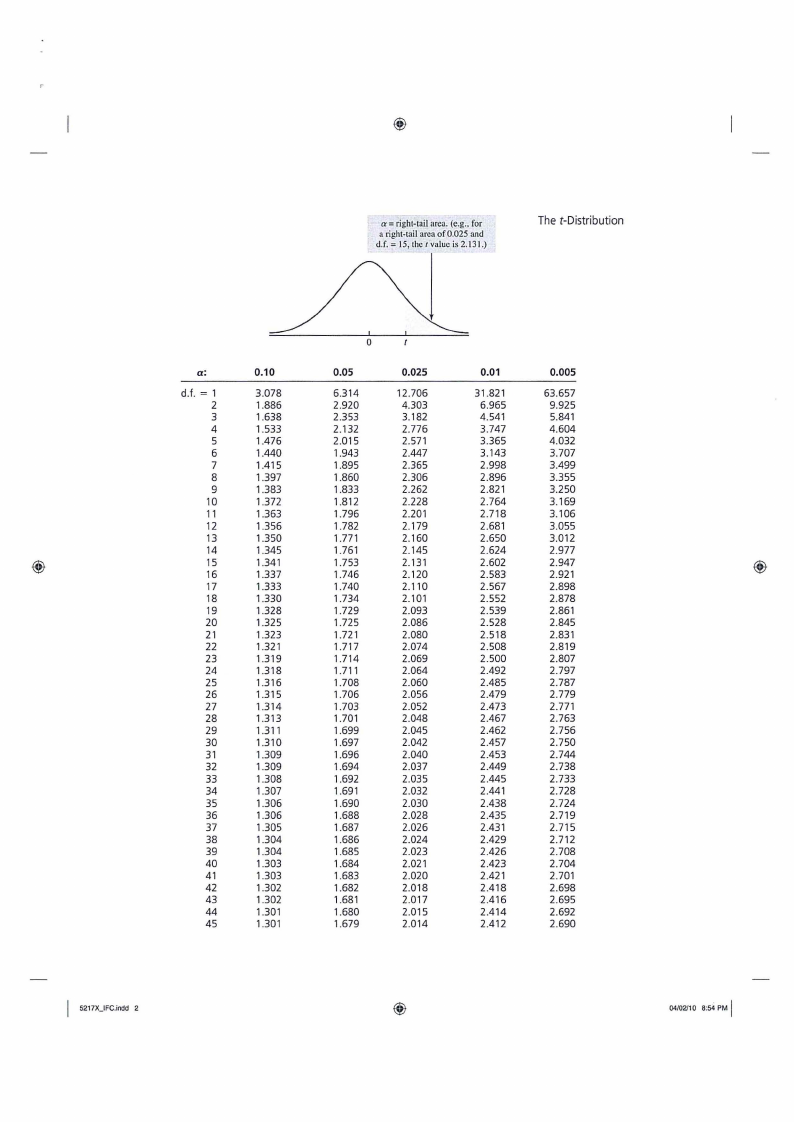
a= right-tail area. (e.g .. for
a right-tail area of0.025 and
d.f. = 15, the r value is 2.131.)
The t-Distribution
a:
d.f. = 1
2
3
4
5
6
7
8
9
10
11
12
13
14
15
16
17
18
19
20
21
22
23
24
25
26
27
28
29
30
31
32
33
34
35
36
37
38
39
40
41
42
43
44
45
0.10
3.078
1.886
1.638
1.533
1.476
1.440
1.415
1.397
1.383
1.372
1.363
1.356
1.350
1.345
1.341
1.337
1.333
1.330
1.328
1.325
1.323
1.321
1.319
1.318
1.316
1.315
1.314
1.313
1.311
1.310
1.309
1.309
1.308
1.307
1.306
1.306
1.305
1.304
1.304
1.303
1.303
1.302
1.302
1.301
1.301
0
0.05
6.314
2.920
2.353
2.132
2.015
1.943
1.895
1.860
1.833
1.812
1.796
1.782
1.771
1.761
1.753
1.746
1.740
1.734
1.729
1.725
1.721
1.717
1.714
1.711
1.708
1.706
1.703
1.701
1.699
1.697
1.696
1.694
1.692
1.691
1.690
1.688
1.687
1.686
1.685
1.684
1.683
1.682
1.681
1.680
1.679
0.025
12.706
4.303
3.182
2.776
2.571
2.447
2.365
2.306
2.262
2.228
2.201
2.179
2.160
2.145
2.131
2.120
2.110
2.101
2.093
2.086
2.080
2.074
2.069
2.064
2.060
2.056
2.052
2.048
2.045
2.042
2.040
2.037
2.035
2.032
2.030
2.028
2.026
2.024
2.023
2.021
2.020
2.018
2.017
2.015
2.014
0.01
31.821
6.965
4.541
3.747
3.365
3.143
2.998
2.896
2.821
2.764
2.718
2.681
2.650
2.624
2.602
2.583
2.567
2.552
2.539
2.528
2.518
2.508
2.500
2.492
2.485
2.479
2.473
2.467
2.462
2.457
2.453
2.449
2.445
2.441
2.438
2.435
2.431
2.429
2.426
2.423
2.421
2.418
2.416
2.414
2.412
0.005
63.657
9.925
5.841
4.604
4.032
3.707
3.499
3.355
3.250
3.169
3.106
3.055
3.012
2.977
2.947
2.921
2.898
2.878
2.861
2.845
2.831
2.819
2.807
2.797
2.787
2.779
2.771
2.763
2.756
2.750
2.744
2.738
2.733
2.728
2.724
2.719
2.715
2.712
2.708
2.704
2.701
2.698
2.695
2.692
2.690
5217X_IFC.indd 2
I 04/02/10 8:54 PM