


 |
BBS611C-BASIC BUSINESS STATISTICS-2ND OPP-DEC 2025 |
|
|
1 Page 1 |
▲back to top |
nAmlBIA
UnlVERSITY
OF SCIEnCE Ano
TECHnOLOGY
HP-GSB~
HAROLD PUPKEWITZ
Graduate School of Business
FACULTY OF COMMERCE; HUMAN SCIENCES AND EDUCATION
HAROLD PUPKEWITZ GRADUATE SCHOOL OF BUSINESS
QUALIFICATION: DIPLOMA IN BUSINESS PROCESS MANAGEMENT
QUALIFICATION CODE: 06DBPM LEVEL: 6
COURSE CODE: BBS611C
COURSE NAME: BASIC BUSINESS
STATISTICS
SESSION: DECEMBER 2025
DURATION: 3 HOURS
PAPER: PAPER I
MARKS:90
SECOND OPPORTUNITY/ SUPPLEMENTARY EXAMINATION -
QUESTION PAPER
EXAMINER(S) Mr.A.Roux
MODERATOR: Mr. J. Amunyela
INSTRUCTIONS
1. Answer ALL the questions.
2. Write clearly and neatly.
3. Number the answers clearly.
PERMISSIBLE MATERIALS
1. Examination paper
2. Examination script
3. Scientific calculator
ATTACHMENTS
I. Standard Normal Probability Distribution Table
2. I x A4 Graph Sheet
THIS QUESTION PAPER CONSISTS OF 4 PAGES (INCLUDING THIS FRONT
PAGE)
1
|
|
2 Page 2 |
▲back to top |
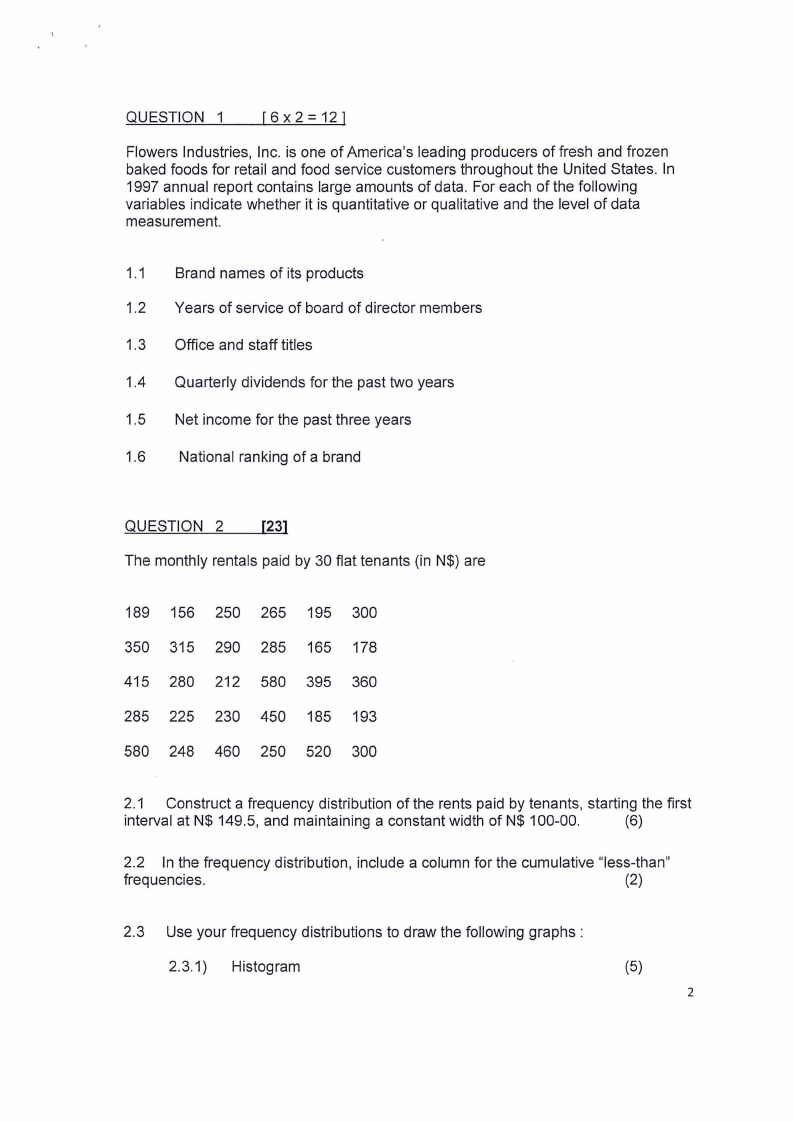
QUESTION 1 [6x2=121
Flowers Industries, Inc. is one of America's leading producers of fresh and frozen
baked foods for retail and food service customers throughout the United States. In
1997 annual report contains large amounts of data. For each of the following
variables indicate whether it is quantitative or qualitative and the level of data
measurement.
1.1 Brand names of its products
1.2 Years of service of board of director members
1.3 Office and staff titles
1.4 Quarterly dividends for the past two years
1.5 Net income for the past three years
1.6 National ranking of a brand
QUESTION 2 [23]
The monthly rentals paid by 30 flat tenants (in N$) are
189 156 250 265 195 300
350 315 290 285 165 178
415 280 212 580 395 360
285 225 230 450 185 193
580 248 460 250 520 300
2.1 Construct a frequency distribution of the rents paid by tenants, starting the first
interval at N$ 149.5, and maintaining a constant width of N$ 100-00.
(6)
2.2 In the frequency distribution , include a column for the cumulative "less-than "
frequencies .
(2)
2.3 Use your frequency distributions to draw the following graphs :
2.3.1) Histogram
(5)
2
|
|
3 Page 3 |
▲back to top |
2.3.2 Cumulative "less-than" ogive/polygon.
(6)
2.4 From your graphs drawn in Question 2.3 , read-off the following :
2.4.1) The modal rental paid.
(2)
2.4.2) The median rental paid.
(2)
QUESTION 3
(15]
The human resource department of a company analyzed the level of absenteeism of
530 employees who reported ill over the past year.
Absenteeism level
(days absent)
3 -< 7
7 - < 11
11-<15
15-<19
19 - < 23
Number of employees
104
138
121
95
72
Use the data provided to calculate the:
3.1 mean,
(5)
3.2 median,
(5)
3.3 and modal level of absenteeism.
(5)
QUESTION 4 (25]
4.1 A statistics professor believes that there is a relationship between the number
of missed classes and the grade on his mid-semester test. After examining his
records he produced the following table of joint probabilities.
Student fails the Student passes the
test
test
Student misses fewer than 5
classes
0.02
0.86
Student misses 5 or more classes
0.09
0.03
4.1 .1 What is the pass rate on the mid-semester test?
(3]
4.1.2 What proportion of students who miss 5 or more classes passes the test? (3]
3
|
|
4 Page 4 |
▲back to top |
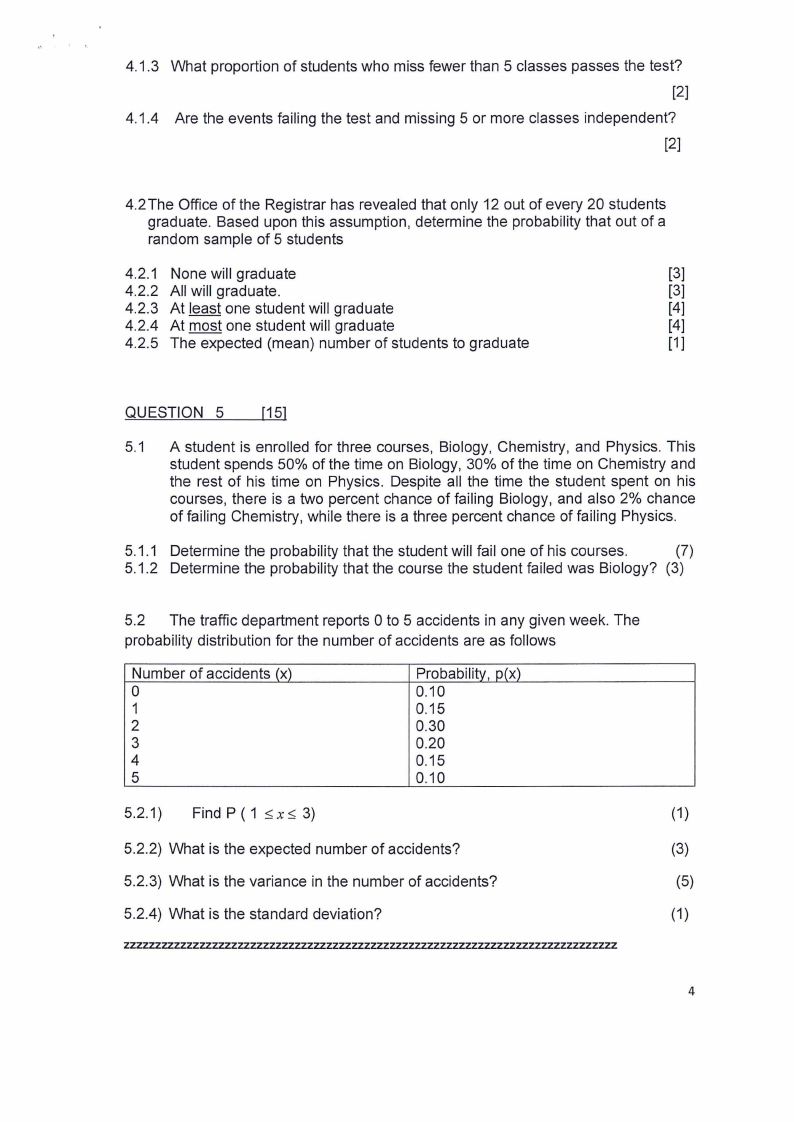
4.1.3 What proportion of students who miss fewer than 5 classes passes the test?
[2]
4.1.4 Are the events failing the test and missing 5 or more classes independent?
[2]
4.2The Office of the Registrar has revealed that only 12 out of every 20 students
graduate. Based upon this assumption, determine the probability that out of a
random sample of 5 students
4.2.1 None will graduate
[3]
4.2.2 All will graduate.
[3]
4.2.3 At least one student will graduate
[4]
4.2.4 At most one student will graduate
[4]
4.2.5 The expected (mean) number of students to graduate
[1]
QUESTION 5 [15]
5.1 A student is enrolled for three courses, Biology, Chemistry, and Physics. This
student spends 50% of the time on Biology, 30% of the time on Chemistry and
the rest of his time on Physics. Despite all the time the student spent on his
courses, there is a two percent chance of failing Biology, and also 2% chance
of failing Chemistry, while there is a three percent chance of failing Physics.
5.1 .1 Determine the probability that the student will fail one of his courses.
(7)
5.1.2 Determine the probability that the course the student failed was Biology? (3)
5.2 The traffic department reports Oto 5 accidents in any given week. The
probability distribution for the number of accidents are as follows
Number of accidents (x)
0
1
2
3
4
5
Probability, p(x)
0.10
0.15
0.30
0.20
0.15
0.10
5.2.1) Find P ( 1 ::,; x::,; 3)
(1)
5.2.2) What is the expected number of accidents?
(3)
5.2.3) What is the variance in the number of accidents?
(5)
5.2.4) What is the standard deviation?
(1)
zzzzzzzzzzzzzzzzzzzzzzzzzzzzzz:z:z.zzzz:z:z.zzzzzzzzzzzzzzzzzzzzzz:z:z.zzzzzzzzzzzzzzzz
4
|
|
5 Page 5 |
▲back to top |
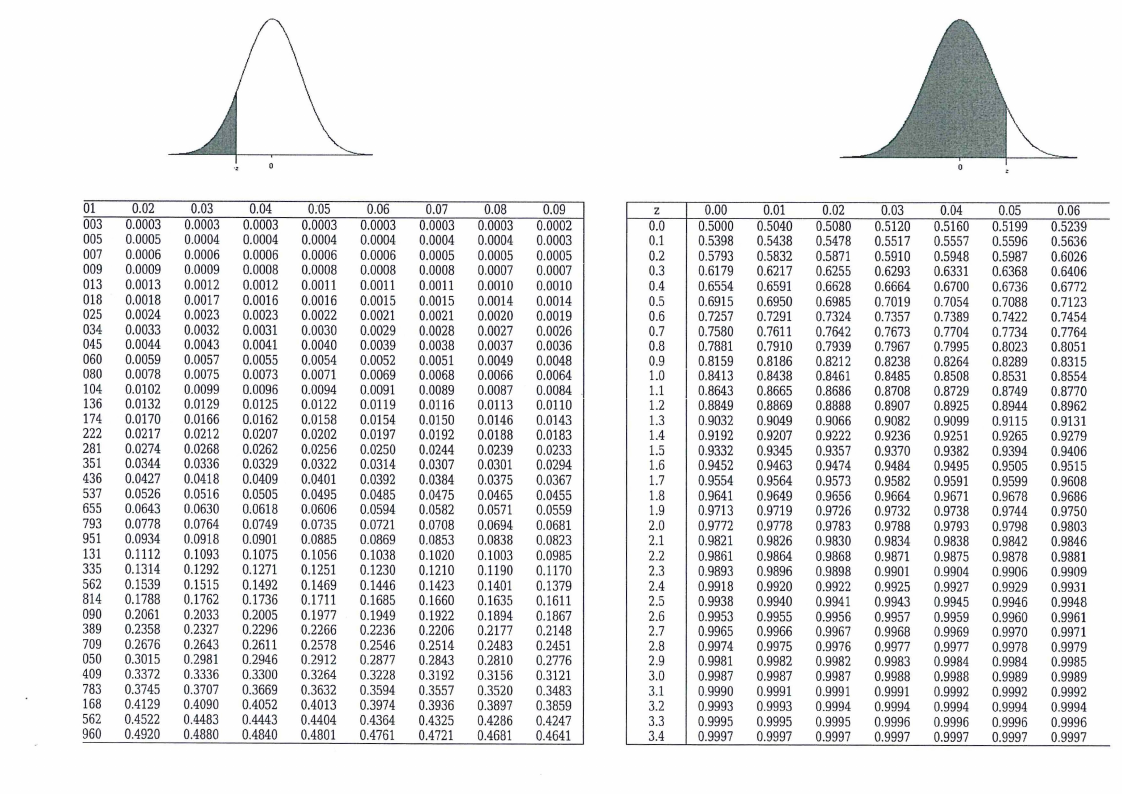
·:
0
01
0.02
0.03
0.04
0:05
0.06
0.07
0.08
0.09
003 0.0003 0.0003 0.0003 0.0003 0.0003 0.0003 0.0003 0.0002
005 0.0005 0.0004 0.0004 0.0004 0.0004 0.0004 0.0004 0.0003
007 0.0006 0.0006 0.0006 0.0006 0.0006 0.0005 0.0005 0.0005
009 0.0009 0.0009 0.0008 0.0008 0.0008 0.0008 0.0007 0.0007
013 0.0013 0.0012 0.0012 0.0011 0.0011 0.0011 0.0010 0.0010
018 0.0018 0.0017 0.0016 0.0016 0.0015 0.0015 0.0014 0.0014
025 0.0024 0.0023 0.0023 0.0022 0.0021 0.0021 0.0020 0.0019
034 0.0033 0.0032 0.0031 0.0030 0.0029 0.0028 0.0027 0.0026
045 0.0044 0.0043 0.0041 0.0040 0.0039 0.0038 0.0037 0.0036
060 0.0059 0.0057 0.0055 0.0054 0.0052 0.0051 0.0049 0.0048
080 0.0078 0.0075 0.0073 0.0071 0.0069 0.0068 0.0066 0.0064
104 0.0102 0.0099 0.0096 0.0094 0.0091 0.0089 0.0087 0.0084
136 0.0132 0.0129 0.0125 0.0122 0.0119 0.0116 0.0113 0.Qll0
174 0.0170 0.0166 0.0162 0.0158 0.0154 0.0150 0.0146 0.0143
222 0.0217 0.0212 0.0207 0.0202 0.0197 0.0192 0.0188 0.0183
281 0.0274 0.0268 0.0262 0.0256 0.0250 0.0244 0.0239 0.0233
351 0.0344 0.0336 0.0329 0.0322 0.0314 0.0307 0.0301 0.0294
436 0.0427 0.0418 0.0409 0.0401 0.0392 0.0384 0.0375 0.0367
537 0.0526 0.0516 0.0505 0.0495 0.0485 0.0475 0.0465 0.0455
655 0.0643 0.0630 0.0618 0.0606 0.0594 0.0582 0.0571 0.0559
793 0.0778 0.0764 0.0749 0.0735 0.0721 0.0708 0.0694 0.0681
951 0.0934 0.0918 0.0901 0.0885 0.0869 0.0853 0.0838 0.0823
131 0.1112 0.1093 0.1075 0.1056 0.1038 0.1020 0.1003 0.0985
335 0.1314 0.1292 0.1271 0.1251 0.1230 0.1210 0.1190 0.1170
562 0.1539 0.1515 0.1492 0.1469 0.1446 0.1423 0.1401 0.1379
814 0.1788 0.1762 0.1736 0.1711 0.1685 0.1660 0.1635 0.1611
090 0.2061 0.2033 0.2005 0.1977 0.1949 0.1922 0.1894 0.1867
389 0.2358 0.2327 0.2296 0.2266 0.2236 0.2206 0.2177 0.2148
709 0.2676 0.2643 0.2611 0.2578 0.2546 0.2514 0.2483 0.2451
050 0.3015 0.2981 0.2946 0.2912 0.2877 0.2843 0.2810 0.2776
409 0.3372 0.3336 0.3300 0.3264 0.3228 0.3192 0.3156 0.3121
783 0.3745 0.3707 0.3669 0.3632 0.3594 0.3557 0.3520 0.3483
168 0.4129 0.4090 0.4052 0.4013 0.3974 0.3936 0.3897 0.3859
562 0.4522 0.4483 0.4443 0.4404 0.4364 0.4325 0.4286 0.4247
960 0.4920 0.4880 0.4840 0.4801 0.4761 0.4721 0.4681 0.4641
0
z
0.00
0.Ql
0.02
0.03
0.04
0.05
0.06
0.0 0.5000 0.5040 0.5080 0.5120 0.5160 0.5199 0.5239
0.1 0.5398 0.5438 0.5478 0.5517 0.5557 0.5596 0.5636
0.2 0.5793 0.5832 0.5871 0.5910 0.5948 0.5987 0.6026
0.3 0.6179 0.6217 0.6255 0.6293 0.6331 0.6368 0.6406
0.4 0.6554 0.6591 0.6628 0.6664 0.6700 0.6736 0.6772
0.5 0.6915 0.6950 0.6985 0.7019 0.7054 0.7088 0.7123
0.6 0.7257 0.7291 0.7324 0.7357 0.7389 0.7422 0.7454
0.7 0.7580 0.7611 0.7642 0.7673 0.7704 0.7734 0.7764
0.8 0.7881 0.7910 0.7939 0.7967 0.7995 0.8023 0.8051
0.9 0.8159 0.8186 0.8212 0.8238 0.8264 0.8289 0.8315
1.0 0.8413 0.8438 0.8461 0.8485 0.8508 0.8531 0.8554
1.1 0.8643 0.8665 0.8686 0.8708 0.8729 0.8749 0.8770
1.2 0.8849 0.8869 0.8888 0.8907 0.8925 0.8944 0.8962
1.3 0.9032 0.9049 0.9066 0.9082 0.9099 0.9115 0.9131
1.4 0.9192 0.9207 0.9222 0.9236 0.9251 0.9265 0.9279
1.5 0.9332 0.9345 0.9357 0.9370 0.9382 0.9394 0.9406
1.6 0.9452 0.9463 0.9474 0.9484 0.9495 0.9505 0.9515
1.7 0.9554 0.9564 0.9573 0.9582 0.9591 0.9599 0.9608
1.8 0.9641 0.9649 0.9656 0.9664 0.9671 0.9678 0.9686
1.9 0.9713 0.9719 0.9726 0.9732 0.9738 0.9744 0.9750
2.0 0.9772 0.9778 0.9783 0.9788 0.9793 0.9798 0.9803
2.1 0.9821 0.9826 0.9830 0.9834 0.9838 0.9842 0.9846
2.2 0.9861 0.9864 0.9868 0.9871 0.9875 0.9878 0.9881
2.3 0.9893 0.9896 0.9898 0.9901 0.9904 0.9906 0.9909
2.4 0.9918 0.9920 0.9922 0.9925 0.9927 0.9929 0.9931
2.5 0.9938 0.9940 0.9941 0.9943 0.9945 0.9946 0.9948
2.6 0.9953 0.9955 0.9956 0.9957 0.9959 0.9960 0.9961
2.7 0.9965 0.9966 0.9967 0.9968 0.9969 0.9970 0.9971
2.8 0.9974 0.9975 0.9976 0.9977 0.9977 0.9978 0.9979
2.9 0.9981 0.9982 0.9982 0.9983 0.9984 0.9984 0.9985
3.0 0.9987 0.9987 0.9987 0.9988 0.9988 0.9989 0.9989
3.1 0.9990 0.9991 0.9991 0.9991 0.9992 0.9992 0.9992
3.2 0.9993 0.9993 0.9994 0.9994 0.9994 0.9994 0.9994
3.3 0.9995 0.9995 0.9995 0.9996 0.9996 0.9996 0.9996
3.4 0.9997 0.9997 0.9997 0.9997 0.9997 0.9997 0.9997
|
|
6 Page 6 |
▲back to top |

l
l
j•
l
Il
t
ll
1I
1
l
-
-
l---- I' - --
l
-
I
i•I•
- -,:I----t-- - - ,
I
,
t
i
I
j
jI
t fI ~ - -
I •-- - - - -
-•-ii.
:l
f
.
:I
I
I
'
l
I
lI,
I
I_ _ I
.III.I
I
.
l
l,
1['I ---,--1~-~
I
r
J'
I
---~r---1
.- ~ --
II
!
•
!
i
'
-------i +-·
I
!
---:ji-- ---
f
L~l
f
-
I
I
l
I
1; · - -- 1 -
·-~-- ----
A.•-•-"
i'•
.--'- - :''
I
I
;
l
----~--
I
1
:j
ll-· -·--:-
I
-
·j·- ---- i ·---· • - .. - ' -
Il •
1·
1
l
I;I
IJ l
... ...
.... . ., _.._.
~-F--·-· -
------ --- -- .:_______-l
:. i
~i _J
II
I
- -:. I ! !
lI ,
:i :i
I
jI
•r
I
I!
I
|
|
7 Page 7 |
▲back to top |
'
l
I
II
l ·---- ---···1-·
I
I
l
----- ___! ___
_ 1 _ ,.__
--- I--lI--------lI'
I
L1 ,
•i
i
- --- +-- --
• I•
· il
I
I~ !---~--------- !______
I
---l---- ·--·
l-
1
l
_____! _______
J