


 |
GRS811S-GIS AND REMOTE SENSING IN PRACTISE-2ND OPP-JULY 2025 |
|
|
1 Page 1 |
▲back to top |
nAmlBIA unlVERSITY
OF SCIEnCE Ano TECHnOLOGY
FACULTYOF HEALTH,NATURAL RESOURCESAND APPLIEDSCIENCES
SCHOOLOF AGRICULTUREAND NATURALRESOURCESCIENCES
DEPARTMENTOF NATURALRESOURCESSCIENCES
QUALIFICATION: BACHELOROF NATURALRESOURCESMANAGEMENT HONOURS
QUALIFICATION CODE: 08BNRH
COURSECODE: GRS811S
LEVEL: 8
COURSENAME: GISAND REMOTESENSINGIN
PRACTICE
DATE: JULY 2025
DURATION: -3 HOURS
MARKS: 100
SECOND OPPORTUNITY EXAMINATION QUESTION PAPER
EXAMINER(S) Prof. Vera De Cauwer
MODERATOR: Ms. Foibe Nelao Johannes
INSTRUCTIONS
1. Answer ALL the questions.
2. Write clearly and neatly.
3. Number the answers clearly.
PERMISSIBLEMATERIALS
1. Calculator
THIS QUESTION PAPERCONSISTSOF 2 PAGES{Excluding this front page)
|
|
2 Page 2 |
▲back to top |
Question 1
[15)
Convert the following coordinates to decimal format. Indicate clearly which coordinate is
latitude and which is longitude.
1. 46° 18.9' S, 20° 54.8' E
2. S 2° 45.12515', E 19° 29.25817'
3. 18° 59' 55" s, 23° 4' 22" w
Question 2
[4]
Point A is situated at 19°05' S, 18°22' E and point Bat 19°35' S, 18°22' E. What is the
distance in metric units between the two points? Explain in detail.
Question 3
[7)
In the practical exercises, you have visually identified and digitised vegetation types on
remote sensing images of Otjiningwa. What is the difference with identifying vegetation
types through supervised image classification of images?
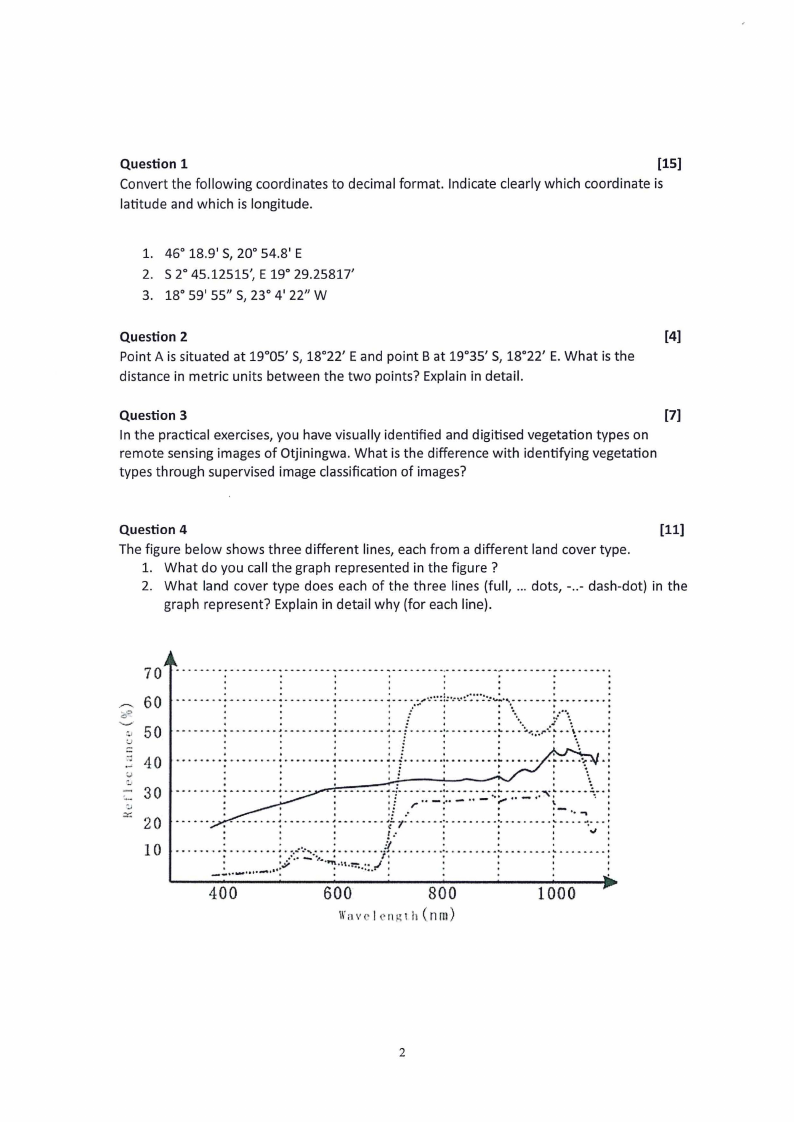
Question 4
[11)
The figure below shows three different lines, each from a different land cover type.
1. What do you call the graph represented in the figure ?
2. What land cover type does each of the three lines (full, ... dots,- ..- dash-dot) in the
graph represent? Explain in detail why (for each line).
70
_.c_,,o_..._._._.60
50 ~J
u
::
·u:;- 40
'-'
--
30
·J
-· 20
10
. -..--. -- . - -- ....- --. --- -- -...- -- - - . - -- - ..- --- - -..- -.---..- - ..- --...-.-..............-........
t
O
I
I
I
I
•
O
I
O
I
I
I
•
I
o
o
I
I
o
•
t
o
--------:---- ---( ------1------1---f:----- . . ..... ·. ............. : ...- .... - ....; - ......... - • ~-............ ~-- .....,•-•~•:!:•.-\\.•:.•:•:•:•...•-.v..:.,.,..• -~ • ••..• •• •;
:?~
•
-f-_\\,.,_/-\\- ---:
......................................................:......................................... ..
o
I
I
I:
•
•
...
:
.. - • - - - .... : - ... - ...... - : ..... - ..
:
: - .. - .........
:;
:
:
I
\\
:
: : .. -:,. - ...---:-- .. - ,.. t . : '"'!" .... - - ....... - .. - - - ...- ..... - ........
...... - - -.·. t
I
I
,:
,
•
•-
I
......-.. .. : ---...............................-..;/.1=..·.-...-.:-..-.....-.... ...---..-.. .. ·:- ---:
:
........... :• ........
:
:
! .·
:, ..:::·:,:.:,:. !t ........ '"!/i.~.......
_.:.-.-•··.·•:-..·v. ~•\\\\•¼.::./:
:
:
:
,J :
·•:· .... - .. ·:•·.. ....... I .......... :t
:
:
:
400
600
800
1000
ll'avclcng1h(nm)
2
|
|
3 Page 3 |
▲back to top |
Question 5
[24]
Indicate if following statements are True or False. If false, correct the statement.
1. Each image layer in a GIS has an attribute table.
2. The distance between two meridians of longitude is a constant.
3. A contour line is an isopleth.
4. The ID field in a GIS attribute layer is always an integer.
5. The vertical images taken during all UAV flights can be used to create a DEM.
6. Electromagnetic radiation with a long wavelength has a low frequency.
7. Longitude values always range between 0° and 90°.
8. Green plants absorb green light.
9. Terrain relief can be recorded by RADARsystems.
10. Satellite images record the light absorbed by objects.
11. Electromagnetic radiation travels at the speed of sound.
12. You can determine NDVI with data from a RGBcamera.
13. Thermal radiation from animals and humans is emitted in the visible light range.
14. The red band of MODIS is suitable to detect fires.
Question 6
[9]
You are collecting samples at sampling stations placed every 10 kilometres along a transect.
The transect runs along a meridian of longitude, starting at latitude -20° and ending at
latitude -22°.
a) What is a transect?
b) Are you performing a random or a systematic sampling?
c) How many sampling stations do you have? Explain our answer.
Question 7
[S]
What is a GIS metadata file? Give three types of information that can be stored in such a file.
Question 8
[6]
Describe the difference between active and passive remote sensing sensors. Give one example
of each type of sensor.
Question 9
Describe the different methods to create GISdata in raster and vector format.
Question 10
What is cartography? Why is it such an important discipline?
[13]
[6]
3
|
|
4 Page 4 |
▲back to top |
