


 |
BBS611C- BASIC BUSINESS STATISTICS- 2ND OPP- NOV 2023 |
|
|
1 Page 1 |
▲back to top |
nAmtBIA
UnlVERSITY
OF SCIEnCEAno
TECHnOLOGY
HAROLDPUPKEWITZ
GraduateSchoolof Business
FACULTY OF COMMERCE; HUMAN SCIENCES AND EDUCATION
HAROLD PUPKEWITZ GRADUATE SCHOOL OF BUSINESS
QUALIFICATION: DIPLOMA IN BUSINESS PROCESS MANAGEMENT
QUALIFICATION CODE: 06DBPM LEVEL: 6
COURSE CODE: BBS611C
COURSE NAME: BASIC BUSINESS
STATISTICS
SESSION: JANUARY 2024
DURATION: 3 HOURS
PAPER: PAPER 1
MARKS: 90
SECOND OPPORTUNITY/ SUPPLEMENTARY EXAMINATION -
QUESTION PAPER
EXAMINER(S) Mr. A. Roux
MODERATOR: Mr. J. Amunyela
INSTRUCTIONS
1. Answer ALL the questions.
2. Write clearly and neatly.
3. Number the answers clearly.
PERMISSIBLE MATERIALS
1. Examination paper
2. Examination script
3. Scientific calculator
ATTACHMENTS
1. Standard Normal Probability Distribution Table
THIS QUESTION PAPER CONSISTS OF 4 PAGES (INCLUDING THIS FRONT
PAGE)
1
|
|
2 Page 2 |
▲back to top |
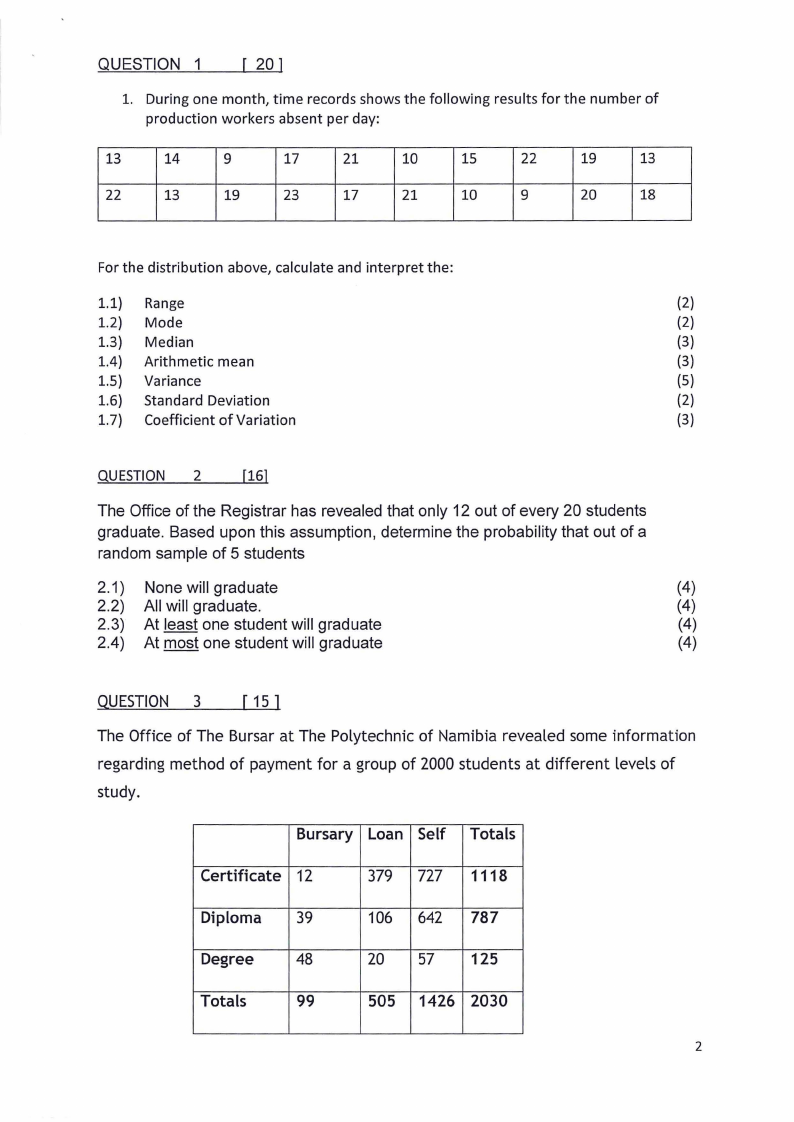
QUESTION 1
r 20 J
1. During one month, time records shows the following results for the number of
production workers absent per day:
13
14
9
17
21
10
15
22
19
13
22
13
19
23
17
21
10
9
20
18
For the distribution above, calculate and interpret the:
1.1} Range
(2)
1.2) Mode
(2)
1.3) Median
(3)
1.4} Arithmetic mean
(3)
1.5} Variance
(5)
1.6} Standard Deviation
(2)
1.7) Coefficient of Variation
(3)
QUESTION 2
[16]
The Office of the Registrar has revealed that only 12 out of every 20 students
graduate. Based upon this assumption, determine the probability that out of a
random sample of 5 students
2.1) None will graduate
(4)
2.2) All will graduate.
(4)
2.3) At least one student will graduate
(4)
2.4) At most one student will graduate
(4)
QUESTION 3
r 15 l
The Office of The Bursar at The Polytechnic of Namibia revealed some information
regarding method of payment for a group of 2000 students at different levels of
study.
Bursary Loan Self Totals
Certificate 12
379 727 1118
Diploma 39
106 642 787
Degree
48
20 57 125
Totals
99
505 1426 2030
2
|
|
3 Page 3 |
▲back to top |
3.1) Find the probability of randomly selecting one student from this group who
pays for him/herself?
(2)
3.2) Find the probability of randomly selecting one student from this group who
has a Diploma or a Degree?
(4)
3.3 Find the probability of randomly selecting one student from this group who
has a Bursary or Degree?
(4)
3.4 What is the chance of randomly selecting one student with a degree, given
that this student has a loan?
(5)
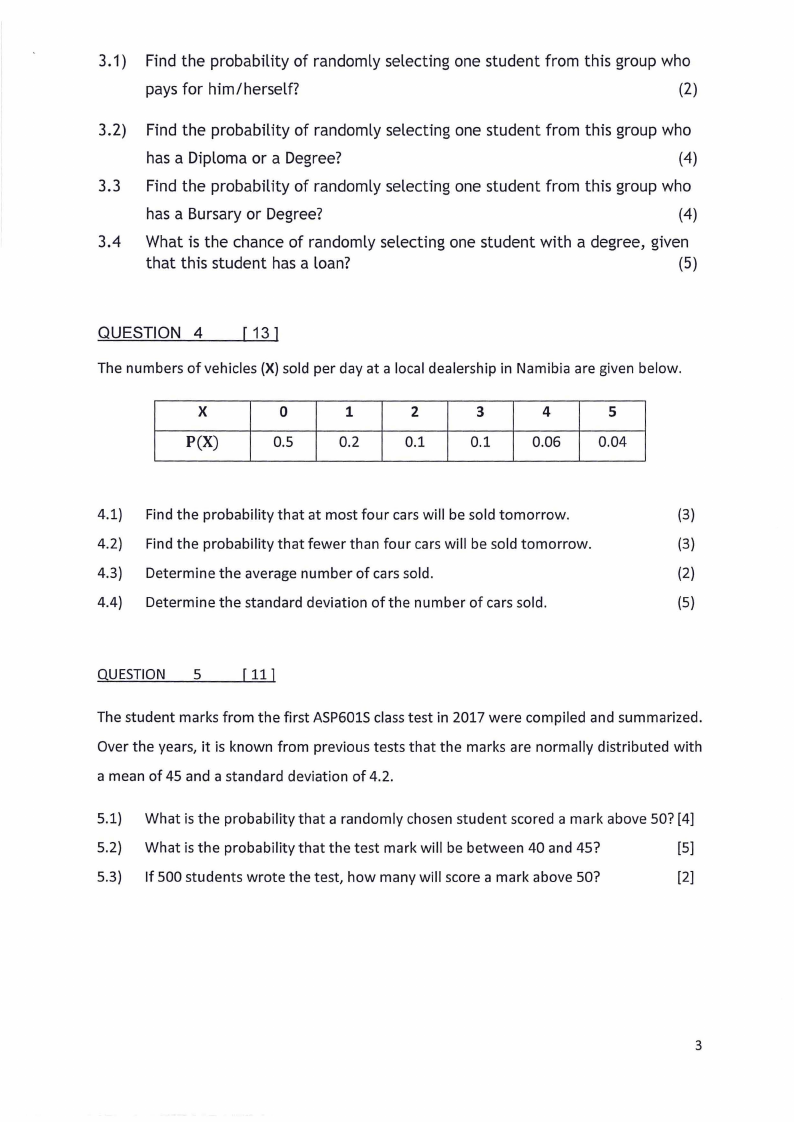
QUESTION 4
r 13 l
The numbers of vehicles (X) sold per day at a local dealership in Namibia are given below.
X
P(X)
0
1
2
3
4
5
0.5
0.2
0.1
0.1
0.06
0.04
4.1) Find the probability that at most four cars will be sold tomorrow.
(3)
4.2) Find the probability that fewer than four cars will be sold tomorrow.
(3)
4.3) Determine the average number of cars sold.
(2)
4.4) Determine the standard deviation of the number of cars sold.
(5)
QUESTION 5
The student marks from the first ASP601S class test in 2017 were compiled and summarized.
Over the years, it is known from previous tests that the marks are normally distributed with
a mean of 45 and a standard deviation of 4.2.
5.1) What is the probability that a randomly chosen student scored a mark above 50? [4]
5.2) What is the probability that the test mark will be between 40 and 45?
[5]
5.3) If 500 students wrote the test, how many will score a mark above 50?
[2]
3
|
|
4 Page 4 |
▲back to top |
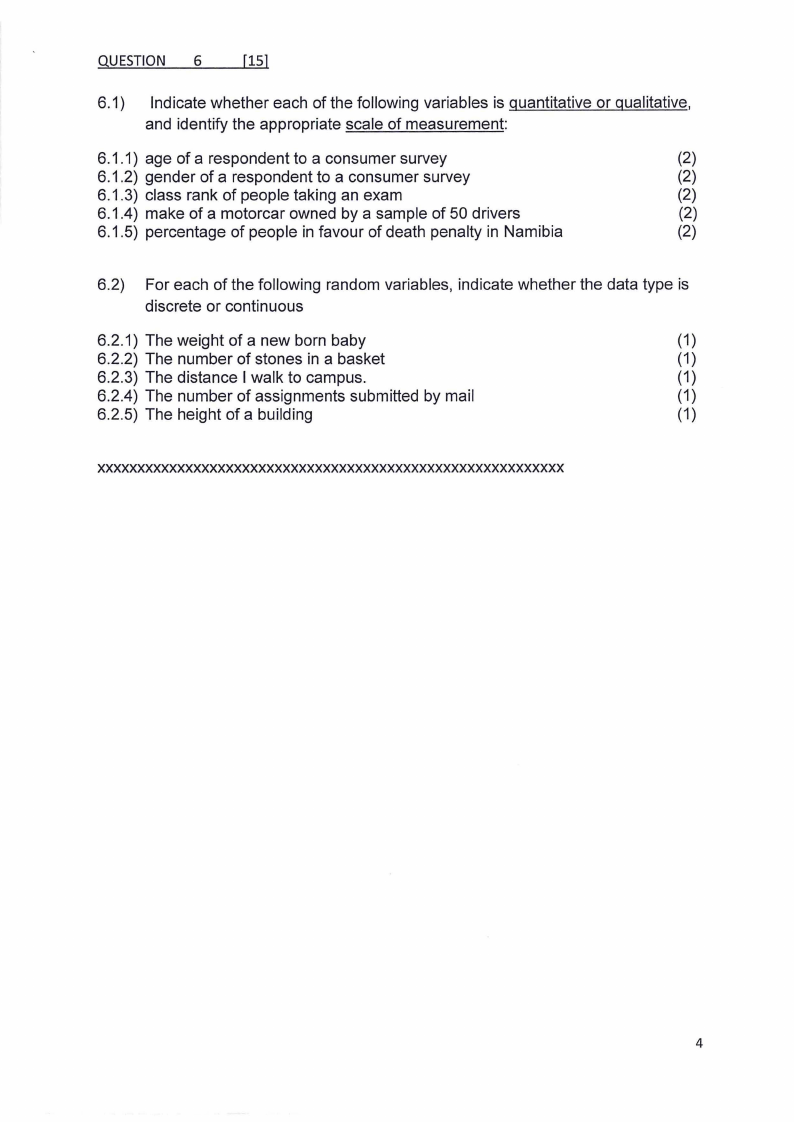
QUESTION 6
[15]
6.1) Indicate whether each of the following variables is quantitative or qualitative,
and identify the appropriate scale of measurement:
6.1.1) age of a respondent to a consumer survey
(2)
6.1.2) gender of a respondent to a consumer survey
(2)
6.1.3) class rank of people taking an exam
(2)
6.1.4) make of a motorcar owned by a sample of 50 drivers
(2)
6.1.5) percentage of people in favour of death penalty in Namibia
(2)
6.2) For each of the following random variables, indicate whether the data type is
discrete or continuous
6.2.1) The weight of a new born baby
(1)
6.2.2) The number of stones in a basket
(1)
6.2.3) The distance I walk to campus.
(1)
6.2.4) The number of assignments submitted by mail
(1)
6.2.5) The height of a building
(1)
xxxxxxxxxxxxxxxxxxxxxxxxxxxxxxxxxxxxxxxxxxxxxxxxxxxxxxxxxx
4
|
|
5 Page 5 |
▲back to top |
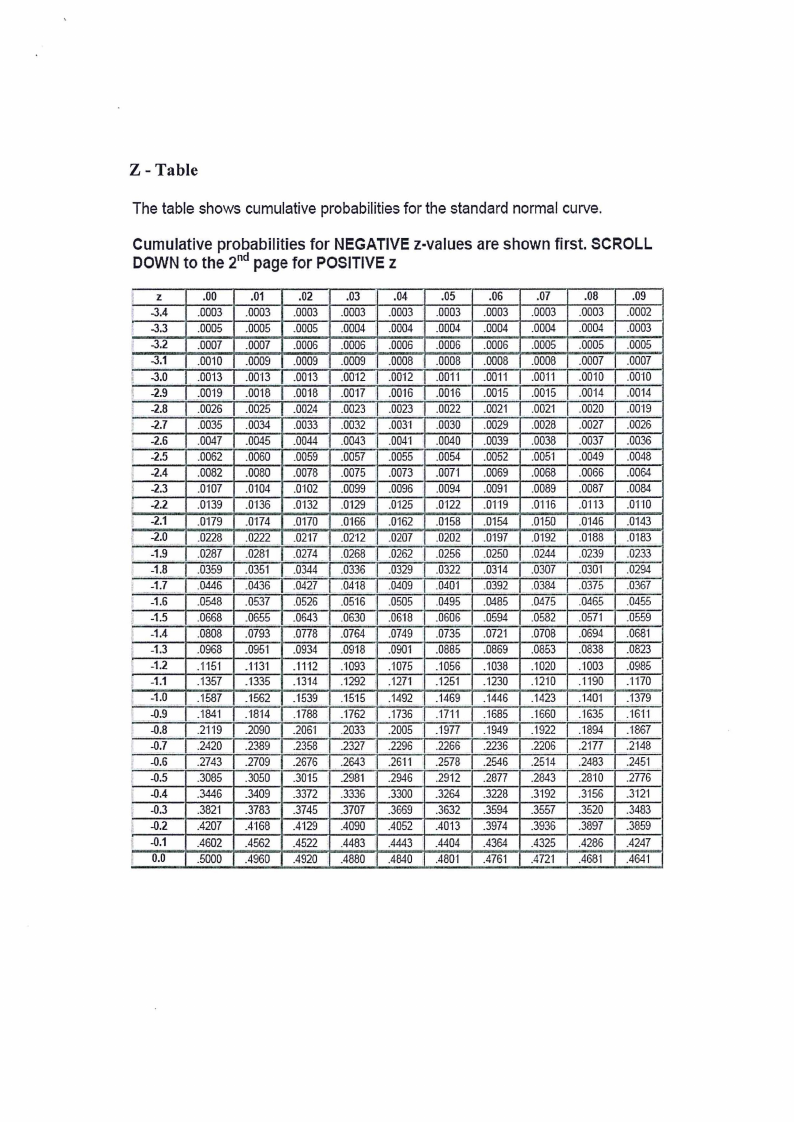
Z-Table
The table showscumulativeprobabilitiesfor the standardnormalcurve.
Cumulative probabilities for NEGATIVEz-values are shown first. SCROLL
DOWNto the 2nd pagefor POSITIVEz
Iz
. --3.4
--3.3
--3.2
I --3.1
1 --3.0
I, -2.9
I -2.8
I, -2.7
-2.6
! -2.5
-2.4
,l -2.3
-2.2
j -2.1
I -2.0
-1.9
-1.8 -
; -1.7
-1.6
'! -1.5
' -1.4
i -1.3
-1.2
I -1.1
.:J.O...
-0.9
-0.8
-0.7
-0.6
l -0.5
-0.4
l -0.3
l -0.2
l -0.1
i 0.0
.00
.01
.02
.0003 .0003 .0003
.0005 .0005 .0005
.0007 .0007 .0006
.0010 .0009 .0009
.0013 .0013 .0013
.0019 .0018 .0018
.0026 .0025 .0·0·-2··4
.0035 .0034 .0033
.0047 .0045 .0044
.0062 .0060 .0059
.0082 .0080 .0078
.0107 .0104 .0·102
.0139 .0136 .0132
.0179 .0"174 .0170
.0228 .0222 .02'17
.0287
.0359
.0446
.0548
.0281
- ..0351
·-.0436
.0537
.02..74-
.. .0..34-4-
.0427
.0526
.0668 .0655 -.0643
.0808 .0793 .0778
.0968 .0951 .0934
."1151 .1"131 .11"12
.1357 .1335 .13"14
."1587 .-1562 ."1.5.3-9·
.184"1 ."1814 .1788
.2119 .2090 .206"I
.2420 .2389 .2358
.2743 .2709 .2676
.3085 .3050 .3015
.3446 .3409 .3372
.3821 .3783 .3745
.4207 .4168 .4·129
.4602 .4562 .4522
.5000 .4960 .4920
.03
.04
.0003 .0003
.0004 .0004
.0006 .0006
.0_009 .0008
.0012 .0012
.OOH .0016
.0023 .0023
.0032 .OOJl
.0043 .004·1
.0057 .0055
.0075 .0073
.0099 .0096
.0129 .0125
.0'166 .0162
.0212 .0207
.0268 .0262
.0336 .0329
.0418 .0409
_05·15 .0505
.0630 .0618
.0764 .0749
.0918 .090'1
.-1093 .1075
."1292 .127"I
.-15·15 .1492
."1762 .1736
.2033 .2005
.2327 .2296
.2643 .2611
.298"1 .2946
.3336 .3300
.3707 !I .3669
.4090 .4052
.4483 .4443
.4880 .4840
.05
.0003
.0004
.0006
.0008
.0011
.0016
.0022
.0030
.0040
.0054
.0071
.0094
.0122
.0158
.0202
.0256
.0322
.0401
.0495
.0606
.0735
.0885
.1056
.1251
.1469
.1711
.1977
.2266
.2578
.2912
.3264
.3632
.4013
.4404
.480·1
.06
.0003
.0004
.0006
.0008
.0011
.0015
.0021
.0029
.0039
.0052
.0069
.0091
.0119
.0154
.0197
.0250
_03-14
.0392
.0485
.0594
.0721
.0869
.1038
.1230
.1446
.1685
.1949
.2236
.....:2546
.2877
.3228
.3594
.3974
.4364
.4761
.07
.0003
.0004
.0005
.0008
.0011
.0015
.0021
.0028
.0038
.0051
.0068
.0089
.0116
.0150
.0192
.0244
.0307
.0384
.0475
.0582
.0708
.0853
.1020
.1210
.1423
.1660
.1922
.2206
.2514
.2843
.3192
.3557
.3936
.4325
.4721
.08
.0003
.0004
.0005
.0007
.0010
.0014
.0020
.0027
.0037
.0049
.0066
.0087
.0113
.0·145
.0188
.0239
.030"1
.0375
.0465
.0571
.0694
.0838
.-1003
.1190
."1401
.1635-
.-1894
.2177
.2483
.28-JO
.3156
.3520
.3897
.4286
.4681
.09
.0002
.0003
.0005
.0007
.OO"IO
.0014
.00"-1··-9
.0026
.0036
.0048
.0064
.0084
.0110
.0143
.0183
.0233
.0294
.0367
.0455
.0559
.0681
.0823
.0985
.1170
.1379
.1611
.1867
.2148
.2451
.2776
.3121
.3483
.3859
.4247
.4641
|
|
6 Page 6 |
▲back to top |
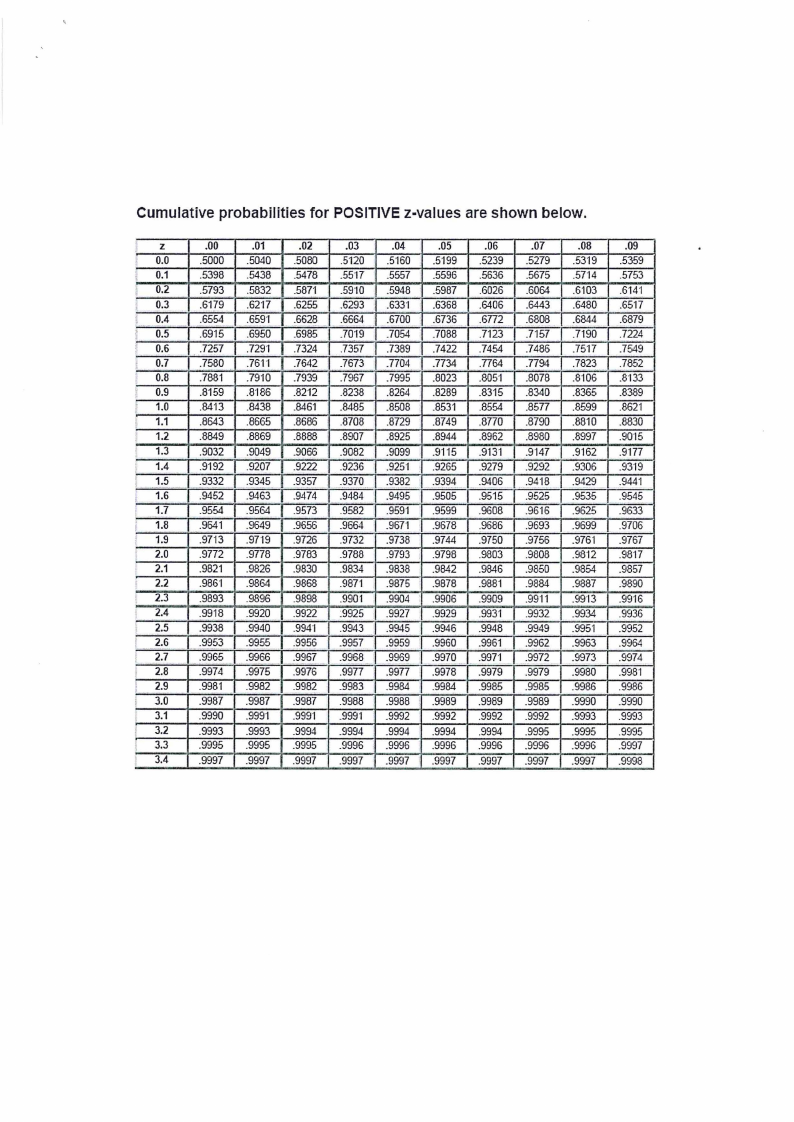
Cumulative probabilities for POSITIVE z-values are shown below.
I
z
0.0
I, 0.1
0.2
0.3
I Q.4
I 0.5
'I 0.6
l 0.7
0.8
I 0.9
I 1.0
' 1.1
1.2
1.3
.' 1.4
1.5
r 1.6
f 1.7
i 1.8
1.9
2.0
2.1
2.2
2.3
2.4
2.5
• 2.6
2.7
2.8
1 2.9
' 3.0
3.1
3.2
3.3
3.4
.00
.5000
.5398
.5793
.6179
.6554
.6915
.7257
.7580
.7881
.8159
.8413
.8643
.8849
.9032
.9192
.9332
.9452
.9554
.9641
.9713
.9772
.9821
.9861
.9893
.9918
.9938
.9953
.9965
.9974
.9981
.9987
.9990
.9993
.9995
.9997
.01
.5040
.5438
.5832
.62H
.6591
.6950
.7291
.7611
.7910
.8'186
.8438
.8665
.8869
.90. 49
.9207
.934...5
.9463
.9564
.9649
.9719
.9778
.9826
.9864
.9896
.9920
.9940
.9955
.9966
.9975
.9982
.9987
.9991
.9993
.9995
.9997
.02
.5080
.5478
.587·1
.6255
.6628
.6985
.7324
.7642
.7939
.8212
.8461
.8686
.8888
.9066
.9222
.9357
.9474
.9573
.9656
.9726
.9783
.9830
.9868
.9898
.9922
.9941
.9956
.9967
.9976
.9982
.9987
.9991
.9994
.9995
.9997
.03
.5120
.5517
.5910
.6293
.6664
.7019
.7357
.7673
.7967
.8238
.8485
.8708
.8907
.9082
.9236
.9370
.9484
.9582
.9664
.9732
.9788
.9834
.9871
.9901
:9925
.9943
.9957
.9968
.9977
.9983
.9988
.9991
.9994
.99~16
.9997
.04
.5160
.5557
.5948
.633'1
.6700
.7054
.7389
.7704
.7995
.8264
.8508
.8729
.8925
.9099
.925·1
.9382
.9495
.9591
.967'1
.9738
.9793
.9838
.9875
.9904
.9927
.9945
.9959
.9969
.9977
.9984
.9988
.9992
.9994
.9996
.9997
.05
.5199
.5596
.5987
.6368
.6736
.7088
.7422
.7734
.8023
.8289
.8531
.8749
.8944
.9115
.9265
.93--9-·4--
.9505
.9599
.9678
.9744
.9798
.9842
.9878
.9906
.9929
.9946
.9960
.9970
.9978
.9984
.9989
.9992
.9994
.9996
.9997
.06
.5239
.5636
.6026
.6406
.6772
.7123
.7454
.7764
.805·1
.8315
.8554
.8770
.8962
.9131
.9279
.9406
.9515
.9608
.9686
.9750
.9803
.9846
.9881
.9909
.9931
.9948
.9961
.9971
.9979
.9985
.9989
.9992
.9994
.9996
.9997
.07
.5279
.5675
.6064
.6443
.6808
.7157
.7486
.7794
.8078
.8340
.8577
.8790
.8980
.9147
.9292
.9418
.9525
.9616
.9693
.9756
.9808
.9850
.9884
.9911
.9932
.9949
.9962
.9972
.9979
.9985
.9989
.9992
.9995
.9996
.9997
.08
.5319
.5714
.6103
.6480
.6844
.7190
.7517
.7823
.8106
.8365
.8599
.8810
.8997
.9162
.9306
.9429
.9535
.9625
.9699
.9761
.9812
.9854
.9887
.9913
.9934
.9951
.9963
.9973
.9980
.9986
.9990
.9993
.9995
.9996
.9997
.09
.5359
.5753
.614'1
.6517
.6879
.7224
.7549
.7852
.8133
.8389
.8621
.8830
.9015
.9177
.9319
.9441
.9545
.9633
.9706
.9767
.9817
.9857
.9890
.9916
.9936
.9952
.9964
.9974
.9981
.9986
.9990
.9993
.9995
.9997
.9998