


 |
MEF811S - Mineral Economics and Financial Valuation - 1st OPP - JUN 2023 |
|
|
1 Page 1 |
▲back to top |
" n Am I BIA u n IVER s ITY
OF SCIEn CE Ano TECHn OLOGY
FACULTY OF ENGINEERING AND THE BUILT ENVIRONMENT
DEPARTMENT OF Civil, Mining and Process Engineering
QUALIFICATION : Bachelors of Engineering in Mining Engineering
QUALIFICATION CODE: O8MEG
LEVEL: 7
COURSE CODE: MEF811S
COURSE NAME: MINERAL ECONOMICS AND
FINANCIAL VALUATION
SESSION: JUNE 2023
DURATION: 3 HOURS
PAPER: THEORY
MARKS: 100
EXAMINER(S)
MODERATOR:
FIRST OPPORTUNITY QUESTION PAPER
Dr Lawrence Madziwa
Dr Victor Mutambo
INSTRUCTIONS
1. Answer all questions.
2. Read all the questions carefully before answering.
3. Marks for each questions are indicated at the end of each question.
4. Please ensure that your writing is legible, neat and presentable.
PERMISSIBLEMATERIALS
1. Examination paper.
THIS QUESTION PAPER CONSISTS OF 4 PAGES (Including this front page)
|
|
2 Page 2 |
▲back to top |
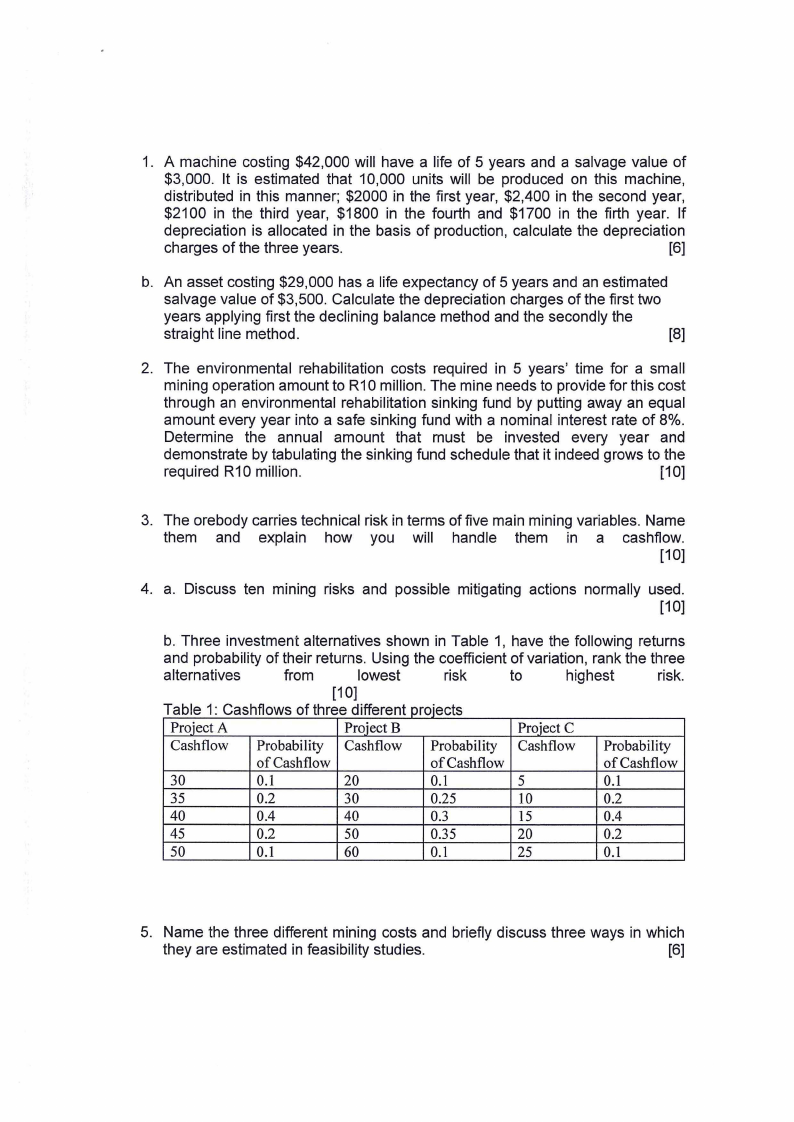
1. A machine costing $42,000 will have a life of 5 years and a salvage value of
$3,000. It is estimated that 10,000 units will be produced on this machine,
distributed in this manner; $2000 in the first year, $2,400 in the second year,
$2100 in the third year, $1800 in the fourth and $1700 in the firth year. If
depreciation is allocated in the basis of production, calculate the depreciation
charges of the three years.
[6]
b. An asset costing $29,000 has a life expectancy of 5 years and an estimated
salvage value of $3,500. Calculate the depreciation charges of the first two
years applying first the declining balance method and the secondly the
straight line method.
[8]
2. The environmental rehabilitation costs required in 5 years' time for a small
mining operation amount to R10 million. The mine needs to provide for this cost
through an environmental rehabilitation sinking fund by putting away an equal
amount every year into a safe sinking fund with a nominal interest rate of 8%.
Determine the annual amount that must be invested every year and
demonstrate by tabulating the sinking fund schedule that it indeed grows to the
required R 10 million.
[1 0]
3. The orebody carries technical risk in terms of five main mining variables. Name
them and explain how you will handle them in a cashflow.
[10]
4. a. Discuss ten mining risks and possible mitigating actions normally used.
[10]
b. Three investment alternatives shown in Table 1, have the following returns
and probability of their returns. Using the coefficient of variation, rank the three
alternatives
from
lowest
risk
to
highest
risk.
[10]
Table 1 Cashflows 0 f three d"1fferen t oroIects
Project A
Project B
Proiect C
Cashflow Probability Cashflow Probability Cashflow Probability
of Cash flow
ofCashflow
ofCashflow
30
0.1
20
0.1
5
0.1
35
0.2
30
0.25
10
0.2
40
0.4
40
0.3
15
0.4
45
0.2
50
0.35
20
0.2
50
0.1
60
0.1
25
0.1
5. Name the three different mining costs and briefly discuss three ways in which
they are estimated in feasibility studies.
[6]
|
|
3 Page 3 |
▲back to top |
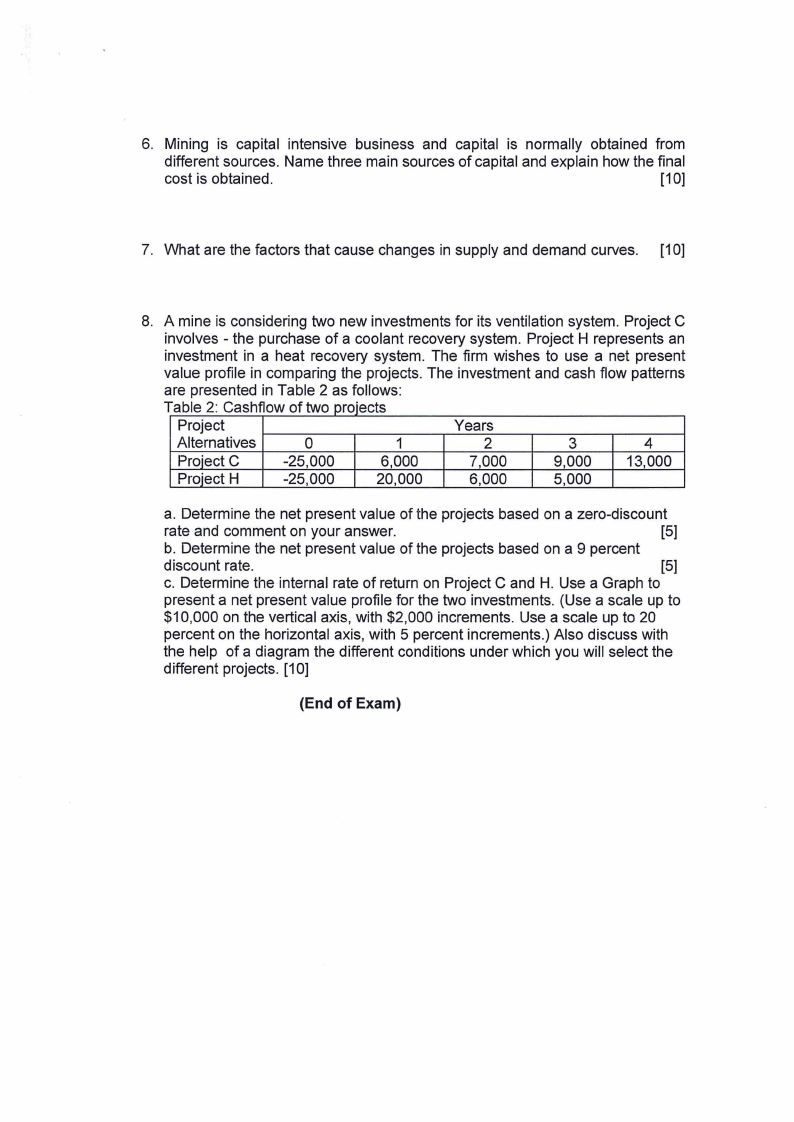
6. Mining is capital intensive business and capital is normally obtained from
different sources. Name three main sources of capital and explain how the final
cost is obtained.
[1O]
7. What are the factors that cause changes in supply and demand curves. [10]
8. A mine is considering two new investments for its ventilation system. Project C
involves - the purchase of a coolant recovery system. Project H represents an
investment in a heat recovery system. The firm wishes to use a net present
value profile in comparing the projects. The investment and cash flow patterns
are presented in Table 2 as follows:
Table 2 Cashflowo f two proi.ects
Project
Years
Alternatives
0
1
2
3
4
Project C
-25,000
6,000
7,000
9,000
13,000
Project H
-25,000
20,000
6,000
5,000
a. Determine the net present value of the projects based on a zero-discount
rate and comment on your answer.
[5]
b. Determine the net present value of the projects based on a 9 percent
discount rate.
[5]
c. Determine the internal rate of return on Project C and H. Use a Graph to
present a net present value profile for the two investments. (Use a scale up to
$10,000 on the vertical axis, with $2,000 increments. Use a scale up to 20
percent on the horizontal axis, with 5 percent increments.) Also discuss with
the help of a diagram the different conditions under which you will select the
different projects. [10]
(End of Exam)
|
|
4 Page 4 |
▲back to top |
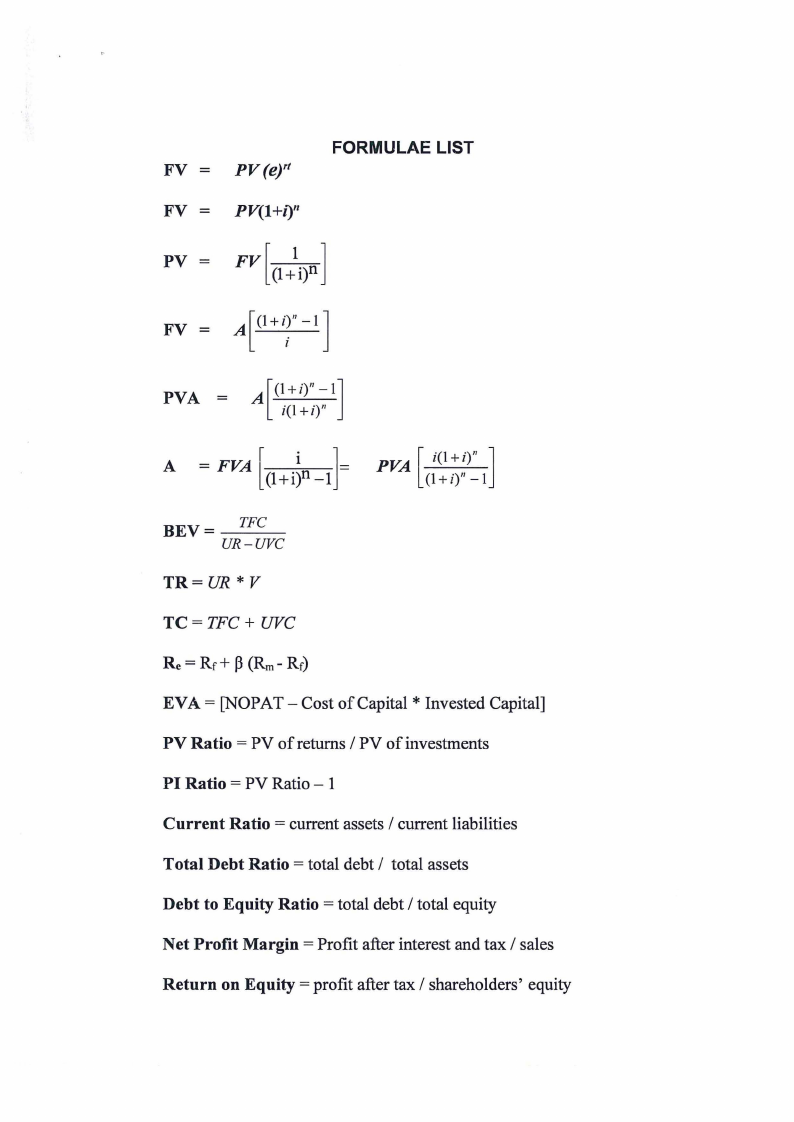
FV = PV(e)''
FORMULAE LIST
FV = PV(l+1) 11
Fv[ PV =
1
(l+i)n ]
FV =
[(I+ lJ PVA = A i)" -
i(l +i)"
]= A = FVA [(1+i)1n - 1
PVA [ i(l+i)" ]
(1 + i)" -1
BEV= TFC
UR-UVC
TR=UR*V
TC=TFC+ UVC
EVA= [NOPAT-Cost of Capital* Invested Capital]
PV Ratio = PV of returns / PV of investments
PI Ratio = PV Ratio - 1
Current Ratio = current assets / current liabilities
Total Debt Ratio= total debt/ total assets
Debt to Equity Ratio = total debt/ total equity
Net Profit Margin = Profit after interest and tax / sales
Return on Equity= profit after tax/ shareholders' equity