


 |
AMS602S-APPLIED MATHEMATICAL AND STATISTICAL COMPUTING - JAN 2020 |
|
|
1 Page 1 |
▲back to top |
p
NAMIBIA UNIVERSITY
OF SCIENCE AND TECHNOLOGY
FACULTY OF HEALTH AND APPLIED SCIENCES
DEPARTMENT OF MATHEMATICS AND STATISTICS
QUALIFICATION: BACHELOR OF SCIENCES APPLIED MATHEMATICS AND STATISTICS
QUALIFICATION CODE:
07BAMS
LEVEL: 6
COURSE CODE: AMS602S
SESSION: JANUARY 2020
COURSE: APPLIED MATHEMATICAL AND STATISTICAL
COMPUTING
PAP: E THERORY
DURATION: 3 Hours
MARKS: 100
SUPPLEMENTARY/SECOND OPPORTUNITY EXAMINATION QUESTION PAPER
EXAMINER
Mr. J. J. SWARTZ
MODERATOR:
Dr. D. B. GEMECHU
INSTRUCTIONS
1.
Answer all the questions using MATLAB R2007b and IBM SPSS Statistics 25
software on your computer
2.
Create a folder with your student number and your name on the desktop, e.g.
2001349 _jjswartz
3.
Copy your results from MATLAB R2007b and IBM SPSS Statistics 25 in a MS
Word document and save the word file in your folder containing your student
number and your name, e.g. 2001349_jjswartz.
4.
Copy your folder with its content into the z-drive.
PERMISSIBLE MATERIALS
1.
Computer with MATLAB R2007b, IBM SPSS Statistics 25 and MS Office
software
THIS QUESTION PAPER CONSISTS OF 4 PAGES (Including this front page)
|
|
2 Page 2 |
▲back to top |
QUESTION 1 [25 MARKS]
Use MATLAB R2007b, installed in your computer, to answer the following questions.
1.1. Create a 4x4 matrix, called A, that has 1’s in the first row, 2’s in the second row, 3’s in the third
row and 4’s in the fourth row.
[2]
1.2. Produce a 4x4 matrices of Zero’s and call it B, and ones and call it C. Produce a matrix of the
product of C and A in (1.1) above and call it D. Provide the square root of D.
[5]
1.3. Create a magic square matrix E of size 6, find the sum and the transpose of the matrix of E. [4]
1.4. Plot, on the same figure, the two functions below:
f=30 +2r-05
g =2tcos(f)
where the variable t varies from 0 to 10 with step 0.5. Draw the function f in blue 0 and the
function g in red *. Give a title to your graph and label the axes.
[7]
1.5. Let
[7]
11 -2 3
1
[4 19 0
i5 ]
e=[0]1.
C=
—-5
|3
12
-6
4
|
;
D=
5
Fs
-—2
7
0
s|
;
E=(13 576809 42]
1.5.1. Multiply matrix C and D [Hadamard product].
1.5.2. Arrange the elements of the vector E in ascending order.
1.5.3. Return the smallest element of vector E.
1.5.4. Delete 2"! column from matrix C.
1.5.5. Use Left division to solve Y = 47'B
QUESTION 2 [25 MARKS]
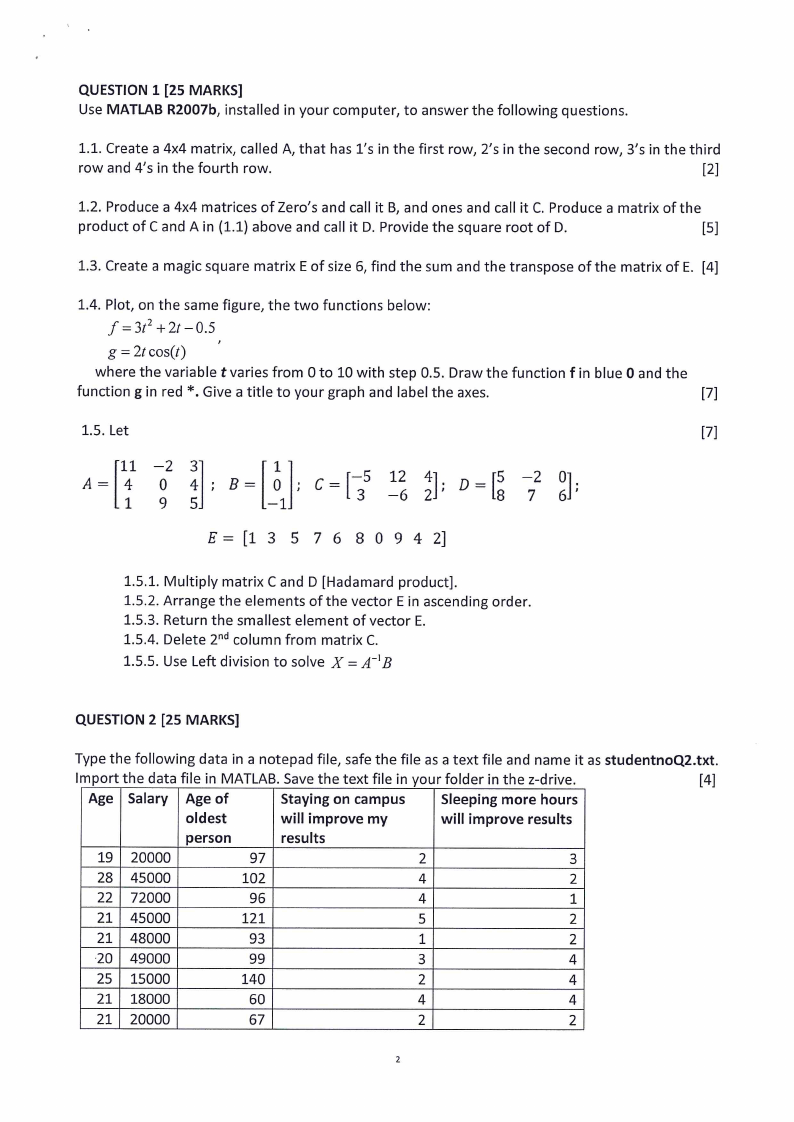
Type the following data in a notepad file, safe the file as a text file and name it as studentnoQ2.txt.
Import the data file in MATLAB. Save the text file in your folder in the z-drive.
[4]
Age | Salary | Age of
Staying on campus
Sleeping more hours
oldest
will improve my
will improve results
person
results
19 | 20000
S7
2
3
28 | 45000
102
4
2
22 | 72000
96
4
1
21 | 45000
121
5
2
21 | 48000
93
1
2
‘20 | 49000
99
3
4
25 | 15000
140
2
4
21 | 18000
60
4
4
21 | 20000
67
2
2
|
|
3 Page 3 |
▲back to top |
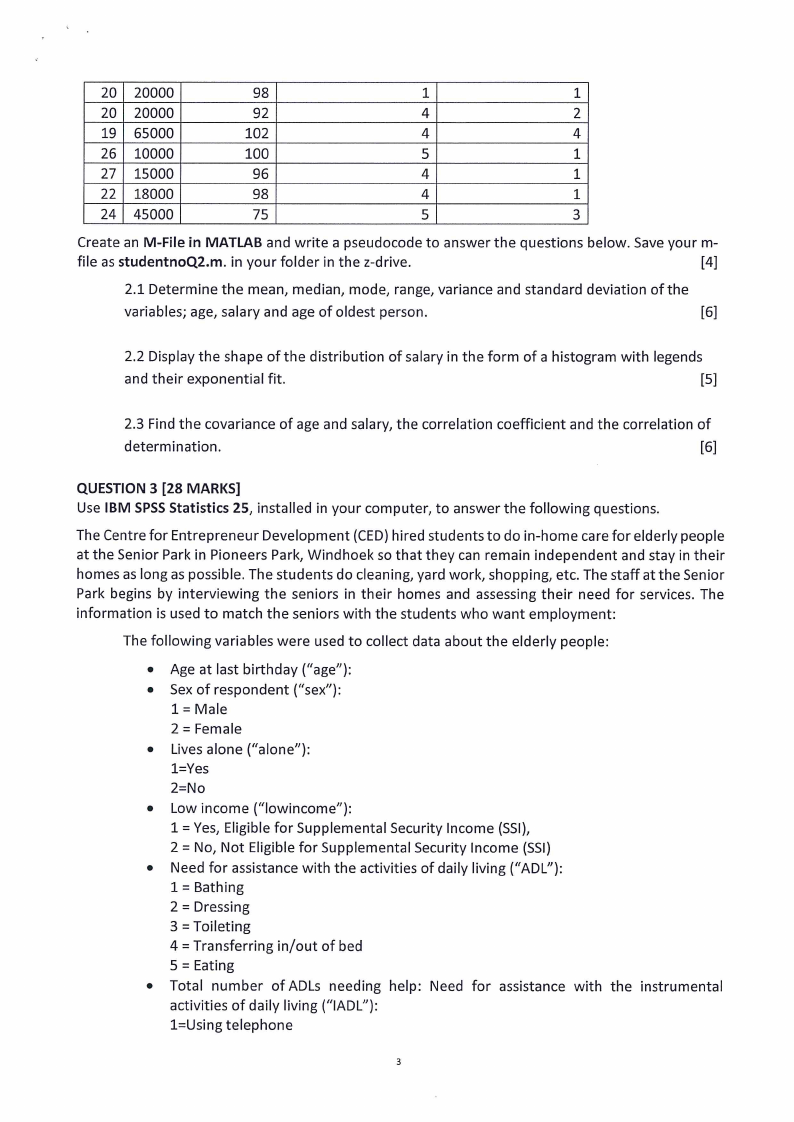
20 | 20000
98
20 | 20000
92
19 | 65000
102
26 | 10000
100
27 | 15000
96
22 | 18000
98
24 | 45000
75
1
1
a
2
a
4
5
1
4
1
4
1
5
3
Create an M-File in MATLAB and write a pseudocode to answer the questions below. Save your m-
file as studentnoQ2.m. in your folder in the z-drive.
[4]
2.1 Determine the mean, median, mode, range, variance and standard deviation of the
variables; age, salary and age of oldest person.
[6]
2.2 Display the shape of the distribution of salary in the form of a histogram with legends
and their exponential fit.
[5]
2.3 Find the covariance of age and salary, the correlation coefficient and the correlation of
determination.
[6]
QUESTION 3 [28 MARKS]
Use IBM SPSS Statistics 25, installed in your computer, to answer the following questions.
The Centre for Entrepreneur Development (CED) hired students to do in-home care for elderly people
at the Senior Park in Pioneers Park, Windhoek so that they can remain independent and stay in their
homes as long as possible. The students do cleaning, yard work, shopping, etc. The staff at the Senior
Park begins by interviewing the seniors in their homes and assessing their need for services. The
information is used to match the seniors with the students who want employment:
The following variables were used to collect data about the elderly people:
e Age at last birthday (“age”):
e Sex of respondent (“sex”):
1= Male
2 = Female
e Lives alone (“alone”):
1=Yes
2=No
e Low income (“lowincome”):
1 = Yes, Eligible for Supplemental Security Income (SSI),
2 = No, Not Eligible for Supplemental Security Income (SSI)
e Need for assistance with the activities of daily living (“ADL”):
1 = Bathing
2 = Dressing
3 = Toileting
4 = Transferring in/out of bed
5 = Eating
e Total number of ADLs needing help: Need for assistance with the instrumental
activities of daily living (“IADL”):
1=Using telephone
|
|
4 Page 4 |
▲back to top |
2=Shopping
3=Preparing food
4=Light housework
5=Heavy housework
6=Finances
e Systolic Blood Pressure (SBP)
To keep track of the needs of potential clients, the program created a data file from one month’s
new applications. Use the data file, called Jan_exam_data, saved on the desktop of your
computer and answer the following questions.
3.1 Import the data from your Excel file, Jan_exam_data into SPSS and define all the variables in
SPSS. Save your SPSS data file using your initials and student number, eg. studentnoQ3.
[10]
3.2 Recode the variable “age” into “agegroup” using the following categories:
1 = 60-69 yrs
2 = 70-79 yrs
3 = 80+ yrs
Define the variable with labels and produce a frequency of the variable “agegroup” and
interpret your results.
[6]
3.3 Produce a table of frequencies and percentages and a bar chart of the variable “sex”. Write
up a short narrative explaining your results.
[6]
3.4. Find the correlation coefficient between Systolic Blood Pressure (SBP) and Age at last
birthday (“age”). Interpret your results.
[6]
QUESTION 4 (22 MARKS)
4.1 What is the mean age and mean SBP of the 30 people?
[2]
4.2 Carry out a simple linear regression of SBP as the dependent variable and age as the
independent variable and show the results?
[7]
4.3 State the regression equation and interpret the equation in terms of age and systolic blood
pressure.
[5]
4.4 How much of the variation in systolic blood pressure is explained by the differences in age?
[3]
4.5 Use One-Way Analysis of Variance to compare the mean age of females and males?
[5]
HEKKKKKKAKAEKAAA KARA AKA KAKA KEE ENP) OF EXAMINATION #* #4 % # % #4 2 2 2 2 2 2 OB Oe ER RE