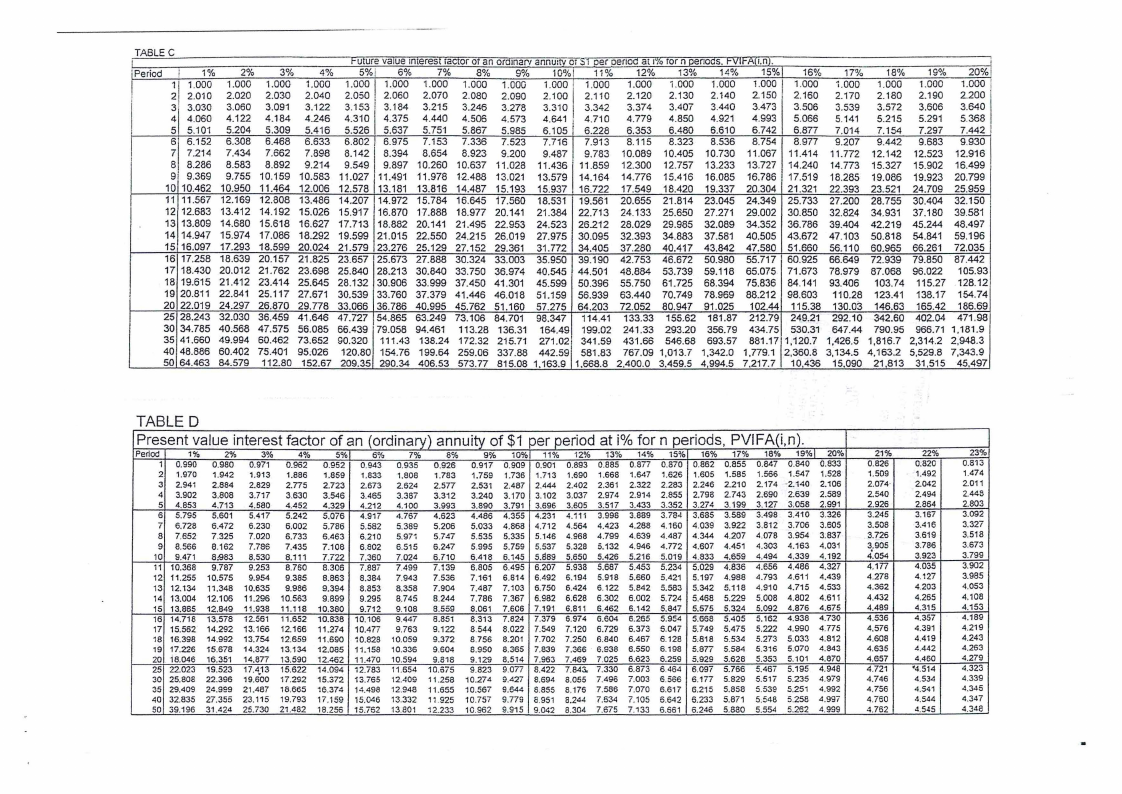
GMA711S-MANAGEMENT ACCOUNTING 310-2ND OPP-JULY 2022


GMA711S-MANAGEMENT ACCOUNTING 310-2ND OPP-JULY 2022


1 Page 1

▲back to top


nAmlBIA unlVERSITY
OF SCIEnCE Ano TECHnOLOGY
FACULTY OF COMMERCE, HUMAN SCIENCES AND EDUCATION
DEPARTMENT OF ACCOUNTING, ECONOMICS AND FINANCE
QUALIFICATION: BACHELOR OF ACCOUNTING
QUALIFICATION CODE: 07BOAC LEVEL:?
COURSE CODE: GMA711 S
COURSE NAME: MANAGEMENT ACCOUNTING 310
SESSION: JULY 2022
PAPER: THEORY AND CALCULATIONS
DURATION: 3 HOURS
MARKS: 100
SECOND OPPORTUNITY EXAMINATION QUESTION PAPER
EXAMINERS S. Lishokomosi and L. Odada
MODERATOR: A. Makosa
INSTRUCTIONS
1. Answer ALL the questions in blue or black ink only. NO PENCIL
2. Start each question on a new page, number the answers correctly and clearly.
3. Write clearly, neatly and show all your workings/assumptions.
4. Round off only final answers to two (2) decimal places
5. Questions relating to this examination may be raised in the initial 30 minutes after the start
of the examination. Thereafter, candidates must use their initiative to deal with any
perceived error or ambiguities and any assumptions made by the candidate should be
clearly stated.
PERMISSIBLE MATERIALS
1. Silent, non-programmable calculators
THIS QUESTION PAPER CONSISTS OF_ 4_ PAGES (excluding this front page and tables)

2 Page 2

▲back to top


QUESTION 1
[25 MARKS]
iTechArt has been the partner of choice for fast-growing start-ups and innovative companies
since 2002, providing fully dedicated engineering teams and custom software solutions.
Headquartered in New York, the company has over 200 active clients worldwide, with 90%
operating on the frontier of emerging technologies and markets. Their forte is agile dedicated
teams of engineers who leverage time-tested big data development services to help clients
manage data more effectively and efficiently. The company is divided into Divisions that
provide services to each other and also to external clients. The performance of the Divisional
Managers is measured against profit targets that are set by central management.
During May 2022, the Consulting Division undertook a project for HP Enterprise. The agreed
fee was N$15 500 and the costs excluding data processing were N$2 600. The data
processing, which needed 200 hours of processing time, was carried out by the Data
Processing (DP) division. An external agency could have been used to do the data processing,
but the DP division had 200 chargeable skilled hours available in May 2022. The DP division
provides data processing services to the other divisions and also to external customers. The
budgeted costs of the DP division for the year ending 31 December 2022, which is divided
into 12 equal monthly periods, are as follows:
Variable costs
Skilled labour (6000 hours worked)
Semi-skilled labour
Other processing costs
Fixed costs
N$
120 000
96 000
60 000
240 000
These costs are recovered on the basis of chargeable skilled labour hours (data processing
hours) which are budgeted to be 90% of skilled labour hours worked. The DP division's
external pricing policy is to add a 40% mark-up to its total budgeted cost per chargeable hour.
During May 2022, actual labour costs incurred by the DP division were 10% higher than
expected, but other costs were 5% lower than expected.
REQUIRED
MARKS
Calculate the total transfer value that would have been charged by the DP 13
division to the Consulting division for the 200 hours on its HP Enterprise
project, using the following bases:
a)
i. Actual variable cost.
ii. Standard variable cost + 40% mark-up.
iii. Market price
1

3 Page 3

▲back to top


Prepare statements to show how the alternative values calculated in 12
b) answer to requirement (a) above would reflect in the performance
measurement of the DP division and the Consulting division.
QUESTION 2
[25 MARKS]
Northern Atlantic fishing is considering the acquisition of a vessel to boost its vessel fleet for
its coastal operations in Namibia during 2022. A Dutch ship manufacturer has quoted a price
equivalent to N$11 million to manufacture and deliver the vessel to the company's
specification. The company contracted a Dutch lawyer and Architect to draft the Agreement
and design the specification of the ship to the tune of N$1.5 million.
Profitability projections for the first three years of operations on the Namibian cost is as follows:
2023
2024
2025
Profit before tax (in millions)
5
6.5
8
Depreciation of the vessel in profit before tax is calculated on straight-line at 10% per annum
and the Tax Authority grants wear and tear tax allowances on straight-line method for a three-
year period (i.e., 33.3% per annum). Tax payment: half payable in the year incurred and
balance in the following year. Northern Atlantic fishing also holds rights to a quota to be
harvested at the coast in West Africa valued at N$8 million, which will require the use of a
vessel. Due to the economic crunch its credit rating has deteriorated thus it is unable to borrow
sufficient funds to acquire two different vessels for both operations. The finance team has
determined that the West Africa fishing operation was going to yield cash profit after tax
equivalent of N$2 million in the first year, increasing to N$2.8 million in the third year of
operation. Absorbed/allocated overheads in the 2024 profit before tax amounts to N$100 000.
Corporate tax in Namibia is 32% and the cost of capital of the company is 15%.
REQUIRED
a) Calculate the Net Present Value (NPV) of the vessel
b) Calculate the Payback Period of the project
MARKS
20
3
Highlight to the management of North Atlantic Fishing any TWO (2)
2
c)
disadvantages of Payback Period
2

4 Page 4

▲back to top


QUESTION 3
[25 MARKS]
SWZ is a manufacturing company that has many trading divisions. Return on Investment (ROI)
is the main measure of each division's performance. Each divisional Manager's salary is linked
only to their division's ROI. The following information relating to S division summarises the
financial performance of the three years including the projected figures for 2023.
2021
2022
2023
N$000
N$000
N$000
Turnover
Cost of sales
Gross profit
400
400
400
240
240
240
160
160
160
Other operating costs
Operating profit
120
104
98
40
56
62
Capital invested as at the end of the year
400
320
256
Other operating costs include asset depreciation calculated at the rate of 20% per annum on
a reducing balance basis. The figures shown in the above table for the capital invested as at
the end of the year is the net book value of the division's fixed assets. At the beginning of
2023, the Manager of the S division is considering investing in an additional machine to boost
production capacity. The new machine will cost N$100 000 with an expected life of five years
depreciated using the same depreciation rate as the existing machinery on straight line
method. The new machine will increase sales by 10% and costs by 3%. The divisional cost
· of capital is 8% per annum. The company has evaluated the investment and correctly
determined that it has a positive Net Present Value (NPV) of N$24 536.
REQUIRED
MARKS
Calculate the return on investment (ROI) for three-year period (i.e., without
3
a)
the new investment).
Calculate ROI for 2023 after considering the new investment and comment
11
b) on whether Management of S Division will still go ahead with the new
investment
Using Residual Income (RI) comment on whether Management of S 11
c)
Division will go ahead with the new investment
3

5 Page 5

▲back to top


QUESTION 4
(25 MARKS]
Edward Co assembles and sells many types of radio. It is considering extending its product
range to include digital radios. These radios produce a better sound quality than traditional
radios and have a large number of potential additional features not possible with the previous
technologies (station scanning, more choice, one touch tuning, station identification text and
song identification. Edward Co is considering a target costing approach for its new digital radio
product.
A selling price of N$44 has been set in order to compete with a similar radio on the market
that has comparable features to Edward Co's intended product. The board have agreed that
the acceptable margin (after allowing for all production costs) should be 25%.
Cost information for the new radio is as follows:
Component 1 (Circuit board) - these are bought in and cost N$4.10 each. They are bought
in batches of 4 000 and additional delivery costs are N$2 400 per batch.
Component 2 (Wiring) - in an ideal situation 25cm of wiring is needed for each completed
radio. Wire costs N$0.50 per metre to buy.
Other material - other materials cost N$8.10 per radio.
Assembly labour - these are skilled people who are difficult to recruit and retain. Edward Co
has more staff of this type than needed but is prepared to carry this extra cost in return for the
security it gives the business. It takes 30 minutes to assemble a radio and the assembly
workers are paid N$12.60 per hour.
Overheads - variable overheads are absorbed on assembly hours totalling 228 000 per year.
Total cost amount to N$7 440 000 and total fixed costs is N$2 880 000. Fixed production
overheads are absorbed on an assembly hour basis based on normal annual activity levels.
In a typical year 240 000 assembly hours will be worked by Edward Co.
REQUIRED
MARKS
Briefly describe the target costing process that Edward Co should
4
a)
undertake
Explain any four (4) benefits of adopting a target costing approach at such
8
b)
an early stage in the product development process to Edward Co
c) Calculate the expected target cost gap per unit
13
END OF EXAMINATION PAPER
4

6 Page 6

▲back to top


7 Page 7

▲back to top


TABLE A
Future value interest factor of $1 per period at io/ofor n periods, FVIF(i,n).
Period
1% 2%
1 1.010 1.020
2 1.020 1.040
3 1.030 1.061
4 1.041 1.082
5 1.051 1.104
6 1.062 1.126
7 1.072 1.149
8 1.083 1.172
9 1.094 1.195
10 1.105 1.219
11 1.116 1.243
12 1.127 1.268
13 1.138 1.294
14 1.149 1.319
15 1.161 1.346
16 1.173 1.373
17 1.184 1.400
18 1.196 1.428
19 1.208 1.457
20 1.220 1.486
25 1.282 1.641
30 1.348 1.811
35 1.417 2.000
40 1.489 2.208
50 1.645 2.692
3%
1.030
1.061
1.093
1.126
1.159
1.194
1.230
1.267
1.305
1.344
1.384
1.426
1.469
1.513
1.558
1.605
1.653
1.702
1.754
1.806
2.094
2.427
2.814
3.262
4.384
4%
1.040
1.082
1.125
1.170
1.217
1.265
1.316
1.369
1.423
1.480
1.539
1.601
1.665
1.732
1.801
1.873
1.948
2.026
2.107
2.191
2.666
3.243
3.946
4.801
7.107
5%
1.050
1.103
1.158
1.216
1.276
1.340
1.407
1.477
1.551
1.629
1.710
1.796
1.886
1.980
2.079
2.183
2.292
2.407
2.527
2.653
3.386
4.322
5.516
7.040
11.467
6%
1.060
1.124
1.191
1.262
1.336
1.419
1.504
1.594
1.689
1.791
1.898
2.012
2.133
2.261
2.397
2.540
2.693
2.854
3.026
3.207
4.292
5.743
7.686
10.286
18.420
7%
1.070
1.145
1.225
1.311
1.403
1.501
1.506
1.718
1.838-
1.967
2:105
2.252
2.410
2.579
2.759
2.952
3.159
3.380
3.617
3.870
5.427
7.612
10.677
14.974
29.457
8%
1.080
1.166
i.260
1.360
1.469
1.587
1.714
1.851
1.999
2.159
2.332
2.518
2.720
2.937
3.172
3.426
3.700
3.996
4.316
4.661
6.848
10.063
14.785
21.725
46.902
9%
1.090
1.188
1.295
1.412
1.539
1.677
1.828
1.993
2.172
2.367
2.580
2.813
3.066
3.342
3.642
3.970
4.328
4.717
5.142
5.604
8.623
13.268
20.414
31.409
74.358
10%
1.100
1.210
1.331
1.464
1.611
1.772
1.949
2.144
2.358
2.594
2.853
3.138
3.452
3.797
4.177
4.595
5,054
5.560
6.116
6.727
10.835
17.449
28.102
45.259
117.391
11%
1.i 10
1.232
1.368
1.518
1.685
1.870
2.075
2.305
2.558
2.839
3.152
3.498
3.883
4.310
4.785
5.311
5.895
6.544
7.263
8.062
13.585
22.892
38.575
65.001
184.565
12%
13%
1.120 1.130
1.254 1.277
1.405 1.443
1.574 1.630
i.762
1.842
1.974 2.082
2.211 2.353
2.476 2.658
2.773 3.004
3.106 3.395
3.479 3.836
3.896 4.335
4.363 4.898
4.887 5.535
5.474 6.254
6.130 7.067
6.866 7.986
7.690 9.024
8.613 10.197
9.646 11.523
17.000 21.231
29.960 39.116
52.800 72.069
93.051 132.782
289.002 450.736
i4%
1.140
1.300
1.482
1.689
1.925
2.195
2.502
2.853
3.252
3.707
4.226
4.818
5.492
6.261
7.138
8.137
9.276
10.575
12.056
13.743
26.462
50.950
98.100
188.884
700.233
153/o
16%
17%
18%
19%
20%
1.150
1.160
1.170
1.180
1.190
1.200
1.323
i.346
1.369
1.392
1.416
1.440
1.521
1.561
1.602
1.643
1.685
1.728
1.749
1.811
1.874
1.939
2.005
2.074
2.011
2.100
2.192
2.288
2.386
2.488
2.313
2.436
2.565
2.700
2.840
2.986
2.660
2.826
3.001
3.185
3.379
3.583
3.059
3.278
3.511
3.759
4.021
4.300
3.518
3.803
4.108
4.435
4.785
5.160
4.046
4.411
4.807
5.234
5.695
6.192
4.652
5.117
5.624
6.176
6.777
7.430
5.350
5.936
6.580
7.288
8.064
8.916
6.153
6.886
7.699
8.599
9.596
10.699
7.076
7.988
9.007
10.147
11.420
12.839
8.137
9.266
10.539
11.974
13.590
15.407
9.358
10.748
12.330
14.129
16.172
18.488
10.761
12.468
14.426
16.672
19.244
22.186
12.375
14.463
16.879
19.673
22.901
26.623
14.232
16.777
19.748
23.214
27.252
31.948
16.367
19.461
23.106
27.393
32.429
38.338
32.919
40.874
50.658
62.669
77.388
95.396
66.212
85.850 111.065 143.371 184.675 237.376
133.176 180.314 243.503 327.997 440.701 590.668
267.864 378.721 533.869 750.378 1,051.668 1.469.n2
1.083.657 1.670.704 2,566.215 3.927.357 5,988.914 9.100.438
TABLE B
Present value interest factor of $1 per period at i% for n periods, PVIF(i,n).
Period
1
2
3
4
5
6
7
8
9
10
11
12
13
14
15
16
17
18
19
20
25
30
35
40
so
1%
0.990
0.980
0.971
0.961
0.951
0.942
0.933
0.923
0.914
0.905
0.896
0.887
0.879
0.870
0.861
0.853
0.844
0.836
0.828
0.820
0.780
0.742
0.706
0.672
0.608
2%
0.980
0.961
0.942
0.924
0.906
0.888
0.871
0.853.
0.837
0.820
0.804
0.788
0.773
0.758
0.743
0.728
0.714
0.700
0.686
0.673
0.610
0.552
0.500
0.453
0.372
3%
0.971
0.943
0.915
0.888
0.863
0.837
0.813
0.789
0.766
0.744
0.722
0.701
0.681
0.661
0.642
0.623
0.605
0.587
0.570
0.554
0.478
0.412
0.355
0.307
0.228
4%
5%
0.962 0.952
0.925 0.907
0.889 0.864
0.855 0.823
0.822 0.784
0.790 0.746
0.760 0.711
0.731 0.677
0.703 0.645
0.676 0.614
0.650 0.585
0.625 0.557
0.601 0.530
0.577 0.505
0.555 0.481
0.534 0.458
0.513 0.436
0.494 · 0.416
0.475 0.396
0.456 0.377
0.375 0.295
0.308 0.231
0.253 0.181
0.208 0.142
0.141 0.087
6%
0.943
0.890
0.840
0.792
0.747
0.705
0.665
0.627
0.592
0.558
0.527
0.497
0.469
0.442
0.417
0.394
0.371
0.350
0.331
0.312
0.233
0.174
0130
0.097
0.054
7%
0.935
0.873
· 0.816
0.763
0.713
0.666
0.623
0.582
0.544
0.508
0.475
0.444
0.415
0.388
0.362
0.339
0.317
0.296
0.277
0.258
0.184
0.131
0.094
0.067
0.034
8%
0.926
0.857
0.794
0.735
0.681
0.630
0.583
0.540
0.500
0.463
0.429
0.397
0.368
0.340
0.315
0.292
0.270
0.250
0.232
0.215
0.146
0.099
0.068
0.046
0.021
9% 10% 11% 12% 13% 14% 15% 16% 17% 18% 19%1 20%
0.917 0.909 0.901 0.893 0.885 0.877 0.370 0.862 0.855 0.847 0.840 0.833
0.842 0.826 0.812 0.797 0.783 0.769 0.756 0.743 0.731 0.718 0.706 0.694
0.772· 0.751 0.731 0.712 0.693 0.675 0.658 0.641 0.624 0.609 0.593 0.579
0.708 0.683 0.659 0.636 0.613 0.592 0.572 0.552 0.534 0.516 0.499 0.482
0.650 0.621 0.593 0.567 0.543 0.519 0.497 0.476 0.456 0.437 0.419 0.402
0.596 0.564 0.535 0.507 0.480 0.456 0.432 0.410 0.390 0.370 0.352 0.335
0.547 0.513 0.482 0.452 0.425 0.400 0.376 0.354 0.333 0.314 0.296 0.279
0.502 0.467 0.434 0.404 0.376 0.351 0.327 0.305 0.285 0.266 0.249 0.233
0.460 0.424 0.391 0.361 0.333 0.308 0.284 0.263 0.243 0.225 0.209 0.194
0.422 0.386 0.352 0.322 0.295 0.270 0.247 0.227 0.208 0.191 0.176 0.162
0.388 0.350 0.317 0.287 0.261 0.237 0.215 0.195 0.178 0.162 0.148 0.135
0.356 0.319 0.286 0.257 0.231 0.208 0.187 0.168 0.152 0.137 0.124 0.112
0.326 0.290 0.258 0.229 0.204 0.182 0.163 0.145 0.130 0.116 0.104 0.093
0.299 0.263 0.232 0.205 0.181 0.160 0.141 0.125 0.111 0.099 0.088 0.078
0.275 0.239 0.209 0.183 0.160 0.140 0.123 0.108 0.095 0.084 0.074 0.065
0.252 0.218 0.188 0.163 0.141 0.123 0.107 0.093 0.081 0.071 0.062 0.054
0.231 0.198 0.170 0.146 0.125 0.108 0.093 0.080 0.069 0.060 0.052 0.045
0.212 0.180 0.153 0.130 0.111 0.095 0.081 0.069 0.059 0.051 0.044 0.038
0.194 0.164 0.138 0.116 0.098 0.083 0.070 0.060 0.051 0.043 0.037 0.031
0.178 0.149 0.124 0.104 0.087 0.073 0.061 0.051 0.043 0.037 0.031 0.026'
0.116 0.092 0.074 0.059 0.047 0.038 0.030 0.024 0.020 0.016 0.013 0.010
0.075 0.057 0.044 0.033 0.026 0.020 0.015 0.012 0.009 0.007 0.005 0.004
0.049 0.036 0.026 0.019 0.014 0.010 0.008 0.006 0.004 0.003 0.002 0.002
0.032 0.022 0.015 0.011 0.008 0.005 0.004 0.003 0.002 0.001 0.001 0.001
0.013 0.009 0.005 0.003 0.002 0.001 0.001 0.001 0.000 0.000 0.000 0.000

8 Page 8

▲back to top


9 Page 9

▲back to top


TABLE C
I
Fu!ure value ,meres! rador or an oromarv annu:tv or ::.1 oer oenoa at 1%ror n oenoas. F\\711-A11.nJ.
I
;Period I 1%
2%
3%
4%
5%! 6%
7%
8%
9% 10%1 11% 12% 13% 14% 15% 16% 17% 18% 19% 20%
1 1.000 1.000 1.000 1.000 1.000 1.000 1.000 1.000 1.000 1.000 1.000 1.000 i.000 1.000 1.000 1.000 1.000 1.000 1.000 1.000
2 2.010 2.020 2.030 2.040 2.050 2.060 2.070 2.080 2.090 2.100 2.110 2.120 2.130 2.140 2.150 2.160 2.170 2.180 2.190 2.200
3 3.030 3.060 3.091 3.122 3.153 3.184 3.215 3.246 3.278 3.310 3.342 3.374 3.407 3.440 3.473 3.506 3.539 3.572 3.606 3.640
4 4.060 4.122 4.184 4.246 4.310 4.375 4.440 4.506 4.573 4.641 4.710 4.779 4.850 4.921 4.993 5.066 5.141 5.215 5.291 5.368
5 5.101 5.204 5.309 5.416 5.526 5.637 5.751 5.867 5.985 6.105 6.228 6.353 6.480 6.610 6.742 6.877 7.014 7.154 7.297 7.442
6 6.152 6.308 6.468 6.633 6.802 6.975 7.153 7.336 7.523 7.716 7.913 8.115 8.323 8.536 8.754 8.977 9.207 9.442 9.683 9.930
7 7.214 7.434 7.662 7.898 8.142 8.394 8.654 8.923 9.200 9.487 9.783 10.089 10.405 10.730 11.067 11.414 11.772 12.142 12.523 12.916
8 8.286 8.583 8.892 9.214 9.549 9.897 10.260 10.637 11.028 11.436 11.859 12.300 12.757 13.233 13.727 14.240 14.773 15.327 15.902 16.499
9 9.369 9.755 10.159 10.583 11.027 11.491 11.978 12.488 13.021 13.579 14.164 14.776 15.416 16.085 16.786 17.519 18.285 19.086 19.923 20.799
10 10.462 10.950 11.464 12.006 12.578 13.181 13.816 14.487 15.193 15.937 16.722 17.549 18.420 19.337 20.304 21.321 22.393 23.521 24.709 25.959
11 11.567 12.169 12.808 13.486 14.207 14.972 15.784 16.645 17.560 18.531 19.561 20.655 21.814 23.045 24.349 25.733 27.200 28.755 30.404 32.150
12 12.683 13.412 14.192 15.026 15.917 16.870 17.888 18.977 20.141 21.384 22.713 24.133 25.650 27.271 29.002 30.850 32.824 34.931 37.180 39.581
13 13.809 14.680 15.618 16.627 17.713 18.882 20.141 21.495 22.953 24.523 26.212 28.029 29.985 32.089 34.352 36.786 39.404 42.219 45.244 48.497
14 14.947 15.974 17.086 18.292 19.599 21.015 22.550 24.215 26.019 27.975 30.095 32.393 34.883 37.581 40.505 43.672 47.103 50.818 54.841 59.196
15 16.097 17.293 18.599 20.024 21.579 23.276 25.129 27.152 29.361 31.772 34.405 37.280 40.417 43.842 47.580 51.660 56.110 60.965 66.261 72.035
16 17.258 18.639 20.157 21.825 23.657 25.673 27.888 30.324 33.003 35.950 39.190 42.753 46.672 50.980 55.717 60.925 66.649 72.939 79.850 87.442
17 18.430 20.012 21.762 23.698 25.840 28.213 30.840 33.750 36.974 40.545 44.501 48.884 53.739 59.118 65.075 71.673 78.979 87.068 96.022 105.93
18 19.615 21.412 23.414 25.645 28.132 30.906 33.999 37.450 41.301 45.599 50.396 55.750 61.725 68.394 75.836 84.141 93.406 103.74 115.27 128.12
19 20.811 22.841 25.117 27.671 30.539 33.760 37.379 41.446 46.018 51.159 56.939 63.440 70.749 78.969 88.212 98.603 110.28 123.41 138.17 154.74
20 22.019 24.297 26.870 29.778 33.066 36.786 40.995 45.762 51.160 57.275 64.203 72.052 80.947 91.025 102.44 115.38 130.03 146.63 165.42 186.69
25 28.243 32.030 36.459 41.646 47.727 54.865 63.249 73.106 84.701 98.347 114.41 133.33 155.62 181.87 212.79 249.21 292.10 342.60 402.04 471.98
30 34.785 40.568 47.575 56.085 66.439 79.058 94.461 113.28 136.31 164.49 199.02 241.33 293.20 356.79 434.75 530.31 647.44 790.95 966.71 1,181.9
35 41.660 49.994 60.462 73.652 90.320 111.43 138.24 172.32 215. 71 271.02 341.59 431.66 546.68 693.57 881.17 1,120.7 1,426.5 1,816.7 2,314.2 2,948.3
40 48.886 60.402 75.401 95,026 120.80 154.76 199.64 259.06 337.88 442.59 581.83 767.09 1,013.7 1,342.0 1,779.1 2,360.8 3,134.5 4,163.2 5,529.8 7,343.9
50 64.463 84.579 112.80 152.67 209.35 290.34 406.53 573.77 815.08 1,163.9 1,668.8 2.400.0 3.459.5 4,994.5 7,217.7 10 436 15.090 21,813 31,515 45,497
TABLED
Present value interest factor of an (ordinary) annuity of $1 per period at i% for n periods, PVIFA(i,n).
Period
1%
1 0.990
2 1.970
3 2.941
4 3.902
5 4.853
6 5.795
T 6.728
8 7.652
9 8.566
10 9.471
11 10.368
12 11.255
13 12.134
14 13.004
15 13.865
16 14.718
17 15.562
18 16.398
19 17.226
20 18.046
25 22.023
30 25.808
35 29.409
40 32.835
50 39.196
2%
0.980
1.942
2.884
3.808
4.713
5.601
6.472
7.325
8.162
8:983
9.787
10.575
11.346
12.106
12.849
13.578
14.292
14.992
15.678
16.351
19.523
22.396
24.999
27.355
31.424
3%
0.971
1.913
2.829
3.717
4.580
5.417
6.230
7.020
7.786
8.530
9.253
9.954
10.635
11.296
11.938
12.561
13.166
13.754
14.324
14.877
17.413
19.600
21.487
23.115
25.730
4%
0.962
1.886
2.n5
3.630
4.452
5.242
6.002
6.733
7.435
8.111
8.760
9.385
9.986
10.563
11.118
11.652
12.166
12.659
13.134
13.590
15,622
17.292
18.665
19.793
21.482
5%
0.952
1.859
2.723
3.546
4.329
5.076
5.786
6.463
7.108
7.722
8.306
8.863
9.394
9.899
10.380
10.838
11.274
11.690
12.085
12.462
14.094
15.372
16.374
17.159
18.256
6%
0.943
1.833
2.673
3.465
4.212
4.917
5.582
6.210
6.802
7.360
7.887
8.384
8.853
9.295
9.712
10.106
10.477
10.828
11.158
11.470
12.783
13.765
14.498
15.046
15.762
7%
0.935
1.808
2.624
3.387
4.100
4.767
5.389
5.971
6.515
7.024
7.499
7.943
8.358
8.745
9.108
9.447
9.763
10.059
10.336
10.594
11.654
12.409
12.948
13.332
13.801
8%
0.926
1.783
2.5n
3.312
3.993
4.623
5.206
5.747
6.247
6.710
7.139
7.536
7.904
8.244
8.559
8.851
9.122
9.372
9.604
9.818
10.675
11.258
11.655
11.925
12.233
9%
0.917
1.759
2.531
3.240
3.890
4.486
5.033
5.535
5.995
6.418
6.805
7.161
7.487
7.786
8.061
8.313
8.544
8.756
8.950
9.129
9.823
10.274
10.567
10.757
10.962
10%
0.909
1.736
2.487
3.170
3.791
4.355
4.868
5.335
5.759
6.145
6.495
6.814
7.103
7.367
7.606
7.824
8.022
8.201
8.365
8.514
9.0rr
9.427
9.644
9.779
9.915
11%
0.901
1.713
2.444
3.102
3.696
4.231
4.712
5.146
5.537
5.a89
6.207
6.492
6.750
6.982
7.191
7.379
7.549
7.702
7.839
7.963
8.422
8.694
6.855
8.951
9.042
12%
0.893
1.690
2.402
3.037
3.605
4.111
4.564
4.968
5.328
5.650
5.938
6.194
6.424
6.628
6.811
6.974
7.120
7.250
7.366
7.469
7.843,
8.055
8.176
8.244
a.304
13%
0.885
1.668
2.361
2.974
3.517
3.996
4.423
4.799
5.132
5.426
5.687
5.918
6.122
6.302
6.462
6.604
6.729
6.840
6.938
7.025
7.330
7.496
7.586
7.534
7.675
14%
0.877
1.647
2.322
2.914
3.433
3.889
4.288
4.639
4.946
5.216
5.453
5.660
5.842
6.002
6.142
6.265
6.373
6.467
6.550
6.623
6.873
7.003
7.070
7.105
7.133
15% 16%
0.870 0.862
1.626 1.605
2.283 2.246
2.855 2.798
3.352 3.274
3.784 3.685
4.160 4.039
4.487 4.344
4.772 4.607
5.019 4.833
5.234 5.029
5.421 5.197
5.583 5.342
5.724 5.468
5.847 5.575
5.954 5.668
5.047 5.749
6.128 5.818
6.198 5.877
6.259 5.929
6.464 6.097
6.566 6.177
6.617 6.215
6.642 5.233
6.661 6.246
17%
0.855
1.585
2.210
2.743
3.199
3.589
3.922
4.207
4.451
4.659
4.836
4.988
5.118
5.229
5.324
5.405
5.475
5.534
5.584
5.628
5.766
5.829
5.858
5.871
5.880
18% 19%1 20%
0.847 0.840 0.833
1.566 1.547 1.528
2.174 ·2.140 2.106
2.690 2.639 2.589
3.127 3.058 2.991
3.498 3.410 3.326
3.812 3.706 3.605
4.078 3.954 3.837
4.303 4.163 4.031
4.494 4.339 4.192
4.656 4.486 4.327
4.793 4.611 4.439
4.910 4.715 4.533
5.008 4.802 4.611
5.092 4.876 4.675
5.162 4.938 4.730
5.222 4.990 4.775
5.273 5.033 4.812
5.316 5.070 4.843
5.353 5.101 4.870
5.467 5.195 4.948
5.517 5.235 4.979
5.539 5.251 4.992
5.548 5.258 4.997
5.554 5.262 4.999
21%
0.826
1.509
2.074·
2.540
2.926
3.245
3.508
3.726
3.905
4.054
4.177
4.278
4.362
4.432
4.489
4.536
4.576
4.608
4.635
4.657
4.721
4.746
4.756
4.750
4.762
22%
0.820
1.492
2.042
2.494
2.864
3.167
3.416
3.619
3.786
3.923
4.035
4.127
4.203
4.265
4.315
4.357
4.391
4.419
4.442
4.460
'4.514
4.534
4.541
4.544
4.545
23%
0.813
1.474
2.011
2.448
2.803
3.092
3.327
3.518
3.673
3.799
3.902
3.985
4.053
4.108
4.153
4.189
4.219
4.243
4.263
4.279
4.323
4.339
4.345
4.347
4.348

10 Page 10

▲back to top


P/Bq13388
Windhoek
r,1..AN!BIA
HODA: CCOUNTING,
ECONOMIACNSDFINANCE