


 |
AAC811S - ADVANCED ANALYTICAL METHOD AND CHEMOMETRICS - 1ST OPP - JUNE 2023 |
|
|
1 Page 1 |
▲back to top |
n Am I BI A u n IVER s ITY
OF SCIEn CE Ano TECHn OLOGY
FACULTYOF HEALTH,NATURAL RESOURCESAND APPLIEDSCIENCES
SCHOOLOF NATURALAND APPLIEDSCIENCES
DEPARTMENTOF BIOLOGY,CHEMISTRYAND PHYSICS
QUALIFICATION: BACHELOROF SCIENCEHONOURS
QUALIFICATION CODE: 08BOSH
LEVEL: 8
COURSECODE: AAC811S
COURSENAME: ADVANCED ANALYTICAL METHOD
AND CHEMOMETRICS
SESSION:JUNE 2023
DURATION: 3 HOURS
PAPER:THEORY
MARKS: 100
FIRSTOPPORTUNITY EXAMINATION QUESTION PAPER
EXAMINER(S} DR JULIEN LUSILAO
MODERATOR: PROFJAMES ABAH
INSTRUCTIONS
1. Answer ALL the questions in the answer book provided.
2. Write and number your answers clearly.
3. All written works MUST be done in blue or black ink.
PERMISSIBLEMATERIALS
Non-programmable Calculators
ATTACHMENTS
List of Useful Tables and formulas
THIS QUESTION PAPERCONSISTSOF 7 PAGES{Including this front page and attachments}
|
|
2 Page 2 |
▲back to top |
Question 1
[30]
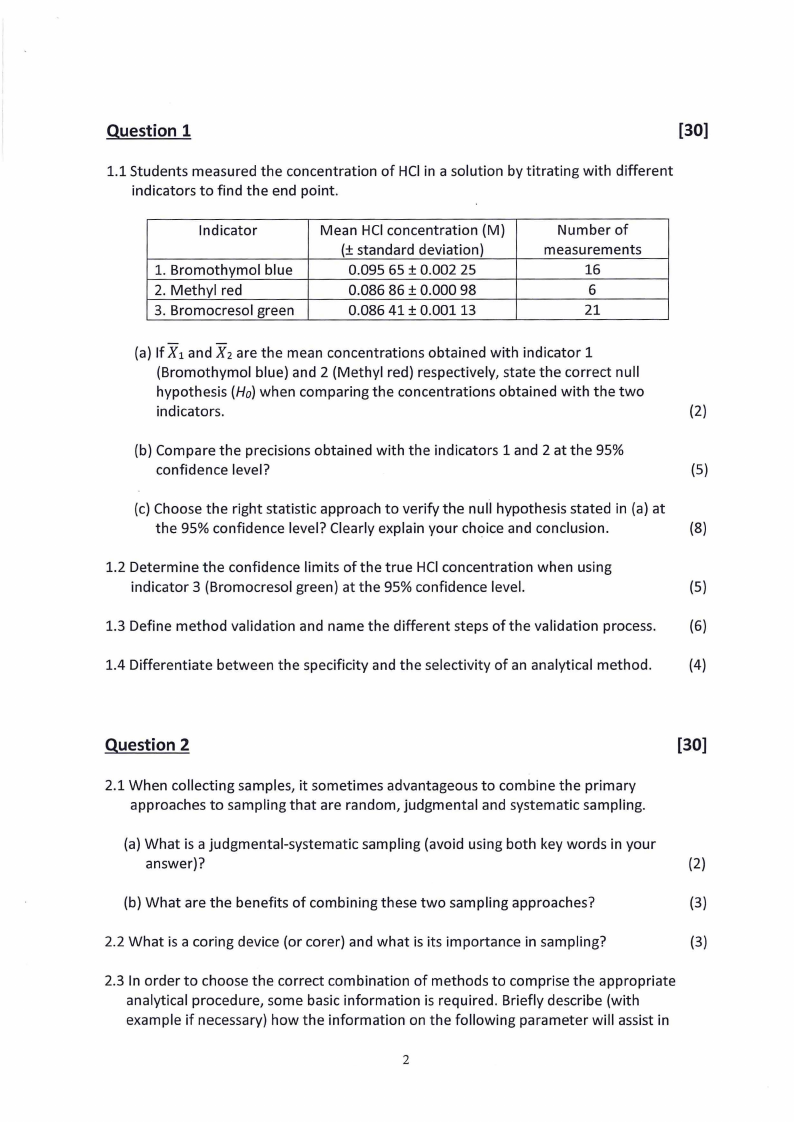
1.1 Students measured the concentration of HCI in a solution by titrating with different
indicators to find the end point.
Indicator
1. Bromothymol blue
2. Methyl red
3. Bromocresol green
Mean HCIconcentration {M)
(± standard deviation)
0.095 65 ± 0.002 25
0.086 86 ± 0.000 98
0.086 41 ± 0.00113
Number of
measurements
16
6
21
(a) If X 1 and X 2 are the mean concentrations obtained with indicator 1
{Bromothymol blue) and 2 (Methyl red) respectively, state the correct null
hypothesis (Ho)when comparing the concentrations obtained with the two
indicators.
(2)
(b) Compare the precisions obtained with the indicators 1 and 2 at the 95%
confidence level?
(5)
(c) Choose the right statistic approach to verify the null hypothesis stated in (a) at
the 95% confidence level? Clearly explain your choice and conclusion.
(8)
1.2 Determine the confidence limits of the true HCI concentration when using
indicator 3 (Bromocresol green) at the 95% confidence level.
(5)
1.3 Define method validation and name the different steps of the validation process. (6)
1.4 Differentiate between the specificity and the selectivity of an analytical method.
(4)
Question 2
[30]
2.1 When collecting samples, it sometimes advantageous to combine the primary
approaches to sampling that are random, judgmental and systematic sampling.
(a) What is a judgmental-systematic sampling (avoid using both key words in your
answer)?
(2)
(b) What are the benefits of combining these two sampling approaches?
(3)
2.2 What is a coring device (or corer) and what is its importance in sampling?
(3)
2.3 In order to choose the correct combination of methods to comprise the appropriate
analytical procedure, some basic information is required. Briefly describe (with
example if necessary) how the information on the following parameter will assist in
2
|
|
3 Page 3 |
▲back to top |
planning a sample preparation procedure
(a} Physical state(s} of sample
(2}
(b} Analytes
{2}
(c} Detection limit
{2}
2.4 Provide the different ways that are used for drying laboratory equipment.
(4)
2.5 The vessels that are used for microwave digestion/extraction are made in Teflon®
(or fluoropolymer} and fused silica. What is (are} the reason(s} behind the choice of
these materials?
(4)
2.6 Briefly discuss the key factors affecting the solid phase extraction (SPE}process.
(8}
Question 3
[20]
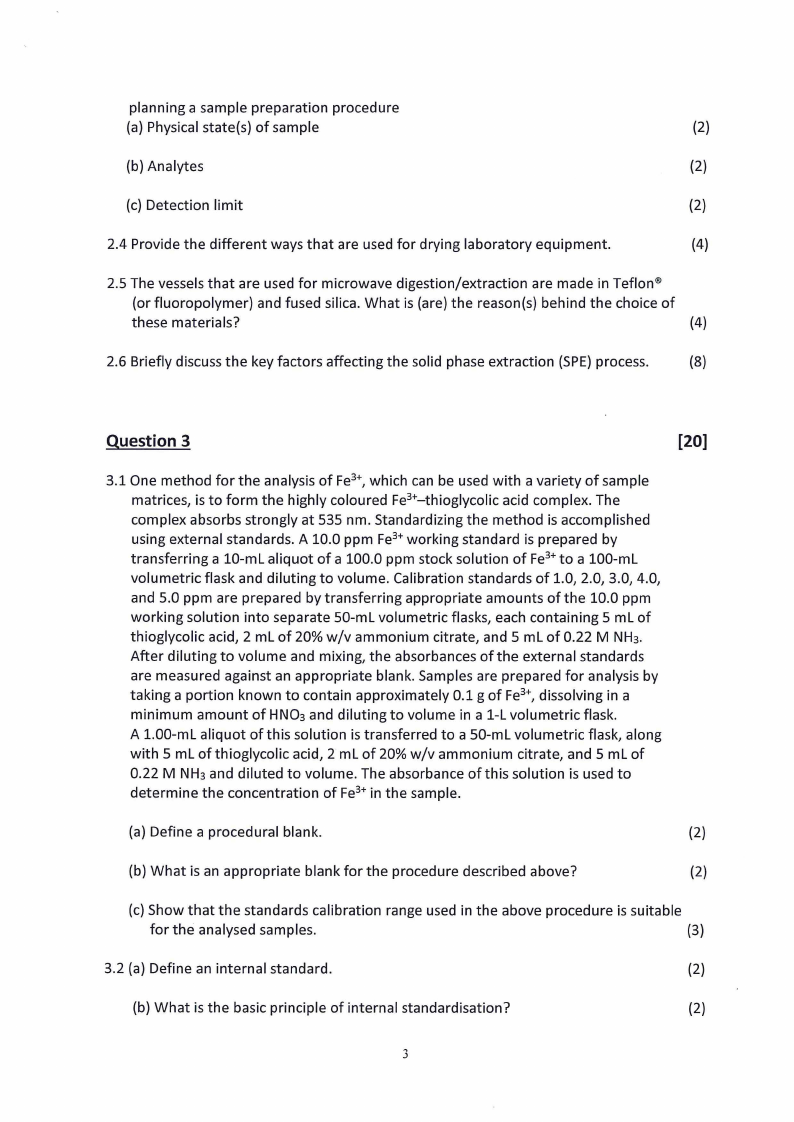
3.1 One method for the analysis of Fe3+,which can be used with a variety of sample
matrices, is to form the highly coloured Fe3+-thioglycolic acid complex. The
complex absorbs strongly at 535 nm. Standardizing the method is accomplished
using external standards. A 10.0 ppm Fe3+working standard is prepared by
transferring a 10-ml aliquot of a 100.0 ppm stock solution of Fe3+to a 100-ml
volumetric flask and diluting to volume. Calibration standards of 1.0, 2.0, 3.0, 4.0,
and 5.0 ppm are prepared by transferring appropriate amounts of the 10.0 ppm
working solution into separate 50-ml volumetric flasks, each containing 5 ml of
thioglycolic acid, 2 ml of 20% w/v ammonium citrate, and 5 ml of 0.22 M NH3.
After diluting to volume and mixing, the absorbances of the external standards
are measured against an appropriate blank. Samples are prepared for analysis by
taking a portion known to contain approximately 0.1 g of Fe3+, dissolving in a
minimum amount of HN03 and diluting to volume in a 1-l volumetric flask.
A 1.00-ml aliquot ofthis solution is transferred to a 50-ml volumetric flask, along
with 5 ml of thioglycolic acid, 2 ml of 20% w/v ammonium citrate, and 5 ml of
0.22 M NH3 and diluted to volume. The absorbance of this solution is used to
determine the concentration of Fe3+in the sample.
(a} Define a procedural blank.
(2)
(b} What is an appropriate blank for the procedure described above?
(2}
(c} Show that the standards calibration range used in the above procedure is suitable
for the analysed samples.
(3}
3.2 (a} Define an internal standard.
(2}
(b} What is the basic principle of internal standardisation?
(2}
3
|
|
4 Page 4 |
▲back to top |
(c) When do you use an internal standard?
(3)
3.3 Many of the analytical methods used to determine the concentration of fibrinogen
in plasma are based on light scattering following its precipitation. Light scattering
is measured nephelometrically at a wavelength of 340 nm. Analysis of a set of
external calibration standards gives the following calibration equation
Is= -4.66 + 9907.63 x C
where Is is the intensity of scattered light and C is the concentration of fibrinogen in
g/L. A 9.0-ml sample of plasma was collected from a patient and mixed with 1.0 ml
of an anticoagulating agent. A 1.0-ml aliquot of this solution was then diluted to
250 ml in a volumetric flask. Analysis of the resulting solution gave a scattering
intensity of 44.70. What is the concentration of fibrinogen, in gram per liter, in the
plasma sample?
(3)
3.4 Give three disadvantages of the isotope dilution method.
(3)
Question 4
[20]
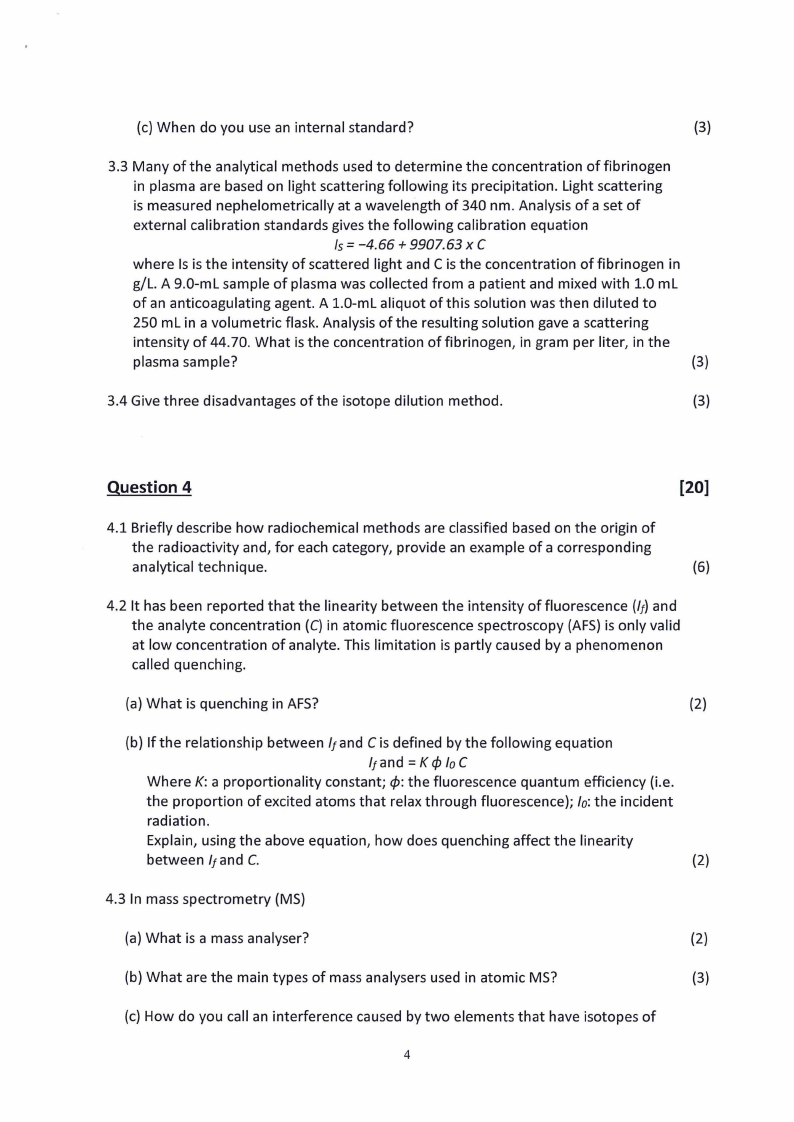
4.1 Briefly describe how radiochemical methods are classified based on the origin of
the radioactivity and, for each category, provide an example of a corresponding
analytical technique.
(6)
4.2 It has been reported that the linearity between the intensity of fluorescence (/j) and
the analyte concentration (C) in atomic fluorescence spectroscopy (AFS)is only valid
at low concentration of analyte. This limitation is partly caused by a phenomenon
called quenching.
(a) What is quenching in AFS?
(2)
(b) If the relationship between It and C is defined by the following equation
It and= K <Plo C
Where K: a proportionality constant; ¢: the fluorescence quantum efficiency (i.e.
the proportion of excited atoms that relax through fluorescence); lo:the incident
radiation.
Explain, using the above equation, how does quenching affect the linearity
between It and C.
(2)
4.3 In mass spectrometry (MS)
(a) What is a mass analyser?
(2)
(b) What are the main types of mass analysers used in atomic MS?
(3)
(c) How do you call an interference caused by two elements that have isotopes of
4
|
|
5 Page 5 |
▲back to top |
essentially the same mass?
(1)
4.4 Name the different classes of chemical speciation used in trace analysis of heavy
metals in the environment.
(4)
END
5
|
|
6 Page 6 |
▲back to top |
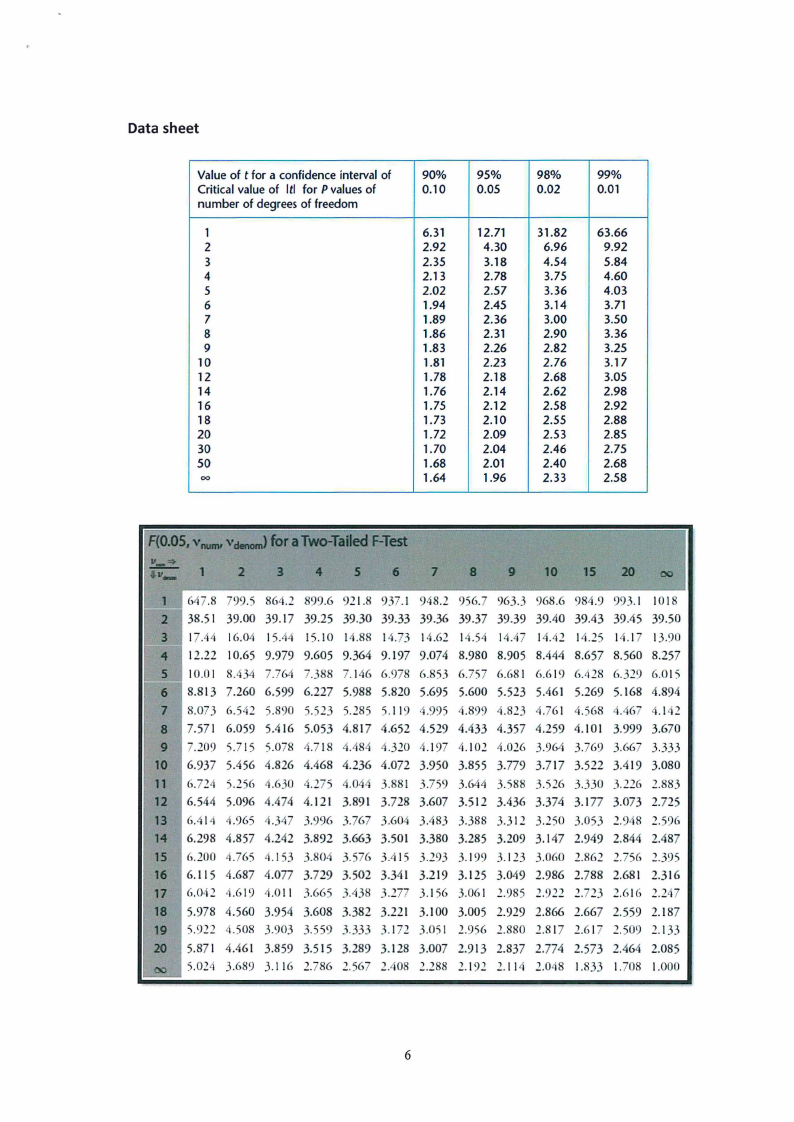
Data sheet
Value of t for a confidence interval of 90% 95%
98%
99%
Criticalvalue of ltl for Pvalues of
0.10
0.05
0.02
0.01
number of degrees of freedom
1
6.31
12.71
31.82
63.66
2
2.92
4.30
6.96
9.92
3
2.35
3.18
4.54
5.84
4
2.13
2.78
3.75
4.60
5
2.02
2.57
3.36
4.03
6
1.94
2.45
3.14
3.71
7
1.89
2.36
3.00
3.50
8
1.86
2.31
2.90
3.36
9
1.83
2.26
2.82
3.25
10
1.81
2.23
2.76
3.17
12
1.78
2.18
2.68
3.05
14
1.76
2.14
2.62
2.98
16
1.75
2.12
2.58
2.92
18
1.73
2.10
2.55
2.88
20
1.72
2.09
2.53
2.85
30
1.70
2.04
2.46
2.75
50
1.68
2.01
2.40
2.68
00
1.64
1.96
2.33
2.58
...... RO.OS, cianofonrJaTwo-Tailefd-Test
,.,_ !a.:!:. 1
2
3
4
5
6
7
8
g
10 15 20
11
11
I!
1 (,47.8 799.5 864.2 899.6 921.8 937.1 948.2 956.7 963.3 968.6 984.9 993.1 1018
2 38.51 39.00 39.17 39.25 39.30 39.33 39.36 39.37 39.39 39.40 39.43 39.45 39.50
3 17.44 16.04 15.44 15.10 14.88 14.73 14.62 14.54 14.47 14.42 14.25 14.17 13.90
4 12.22 10.65 9.979 9.605 9.364 9.197 9.074 8.980 8.905 8.444 8.657 8.560 8.257
5 10.01 8.434 7.764 7.388 7.146 6.978 6.853 6.757 6.681 6.619 6.428 6.329 6.015
6 8.813 7.260 6.599 6.227 5.988 5.820 5.695 5.600 5.523 5.461 5.269 5.168 4.894
7 8.073 6.542 5.890 5.523 5.285 5.119 4.995 4.899 4.823 4.761 4.568 4.467 4.142
8 7.571 6.059 5.416 5.053 4.817 4.652 4.529 4.433 4.357 4.259 4.101 3.999 3.670
9 7.209 5.715 5.078 4.718 4.484 4.320 4.197 4.102 4.026 3.964 3.769 3.667 3.333
10 6.937 5.456 4.826 4.468 4.236 4.072 3.950 3.855 3.779 3.717 3.522 3.419 3.080
11 6.724 5.256 4.630 4.275 .044 3.881 3.759 3.644 3.588 3.526 3.330 3.226 2.883
12 6.544 5.096 4.474 4.121 3.891 3.728 3.607 3.512 3.436 3.374 3.177 3.073 2.725
13 6.414 4.965 4.347 3.996 3.767 3.604 3.483 3.388 3.312 3.250 3.053 2.948 2.596
14 6.298 4.857 4.242 3.892 3.663 3.501 3.380 3.285 3.209 3.147 2.949 2.844 2.487
15 6.200 4.765 4.153 3.804 3.576 3.415 3.293 3.199 3.123 3.060 2.862 2.756 2.395
16 6.115 4.687 4.077 3.729 3.502 3.341 3.219 3.125 3.049 2.986 2.788 2.681 2.316
17 6.042 4.619 4.011 3.665 3.438 3.277 3.156 3.061 2.985 2.922 2.723 2.616 2.247
18 5.978 4.560 3.954 3.608 3.382 3.221 3.100 3.005 2.929 2.866 2.667 2.559 2.187
19 5.922 4.508 3.903 3.559 3.333 3.172 3.051 2.956 2.880 2.817 2.617 2.509 2.133
20 5.871 4.461 3.859 3.515 3.289 3.128 3.007 2.913 2.837 2.774 2.573 2.464 2.085
00 5.024 3.689 3.116 2.786 2.567 2.408 2.288 2.192 2.114 2.048 1.833 1.708 1.000
6
|
|
7 Page 7 |
▲back to top |
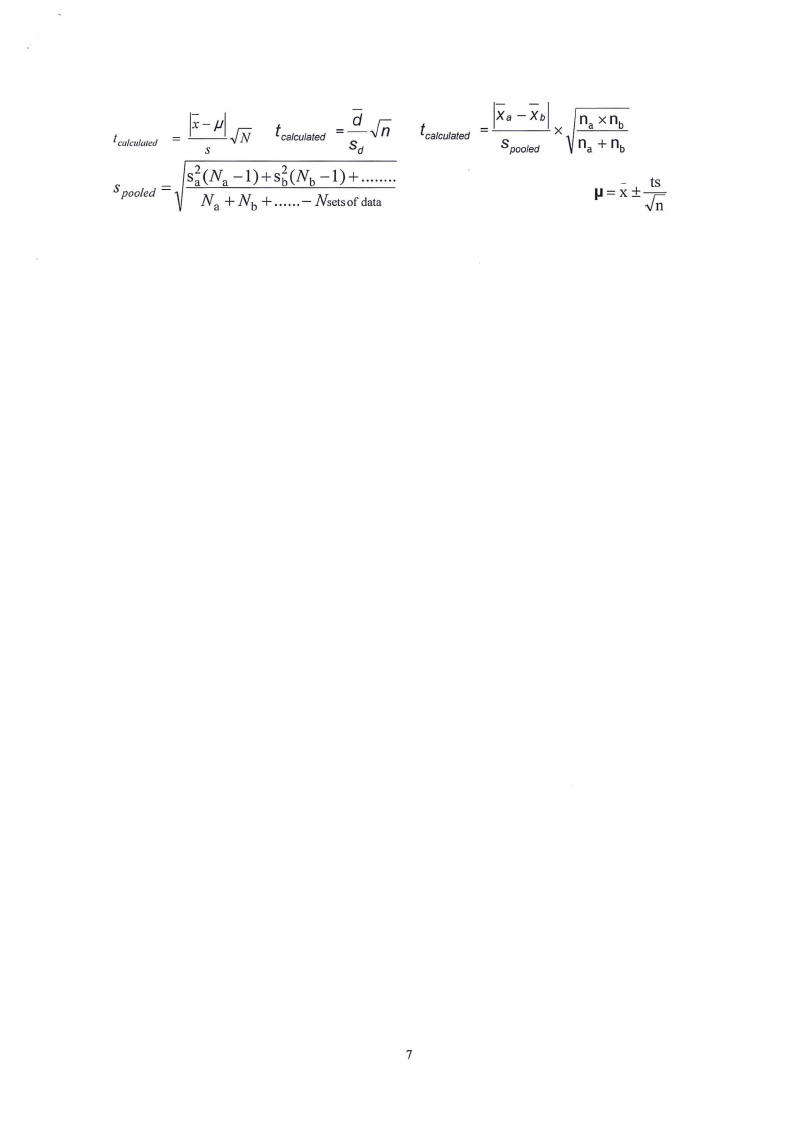
f calculated
Spooled=
tcalculated
Sd
s;(Na -l)+s~(Nb-1)+ ........
Na +Nb + ......-Nsetsofdata
lxa-Xbl
(calculated = ~---
X
Spooled
7