


 |
CAN811S- COMPUTER APPLICATIONS IN NUTRITION - 2ND Opp - JULY 2022 |
|
|
1 Page 1 |
▲back to top |
nAmIBIA unIVERsITY
OFSCIEnCERnD TECHnOLOGY
FACULTY OF HEALTH, APPLIED SCIENCES AND NATURAL RESOURCES
DEPARTMENT OF HEALTH SCIENCES
QUALIFICATION: BACHELOR OF HUMAN NUTRITION
QUALIFICATION CODE: 08BOHN
COURSE CODE: CAN 811S
LEVEL: 8
COURSE NAME: COMPUTER APPLICATIONS IN
NUTRITION
SESSION: JULY 2022
PAPER: THEORY
DURATION: 3 HOURS
MARKS: 100
SUPPLEMENTARY/SECOND OPPORTUNITY EXAMINATION PAPER
EXAMINER(S) MRS MARI-LOUISE JEFFERY
DR DIBABA GEMECHU
MODERATOR: MR ERICK UUKULE
INSTRUCTIONS
1. Answer ALL the questions.
2. Write clearly and neatly.
3. Number the answers clearly.
PERMISSIBLE MATERIALS
Nonprogrammable scientific calculator
THIS QUESTION PAPER CONSISTS OF 7 PAGES (Including this front page)
|
|
2 Page 2 |
▲back to top |
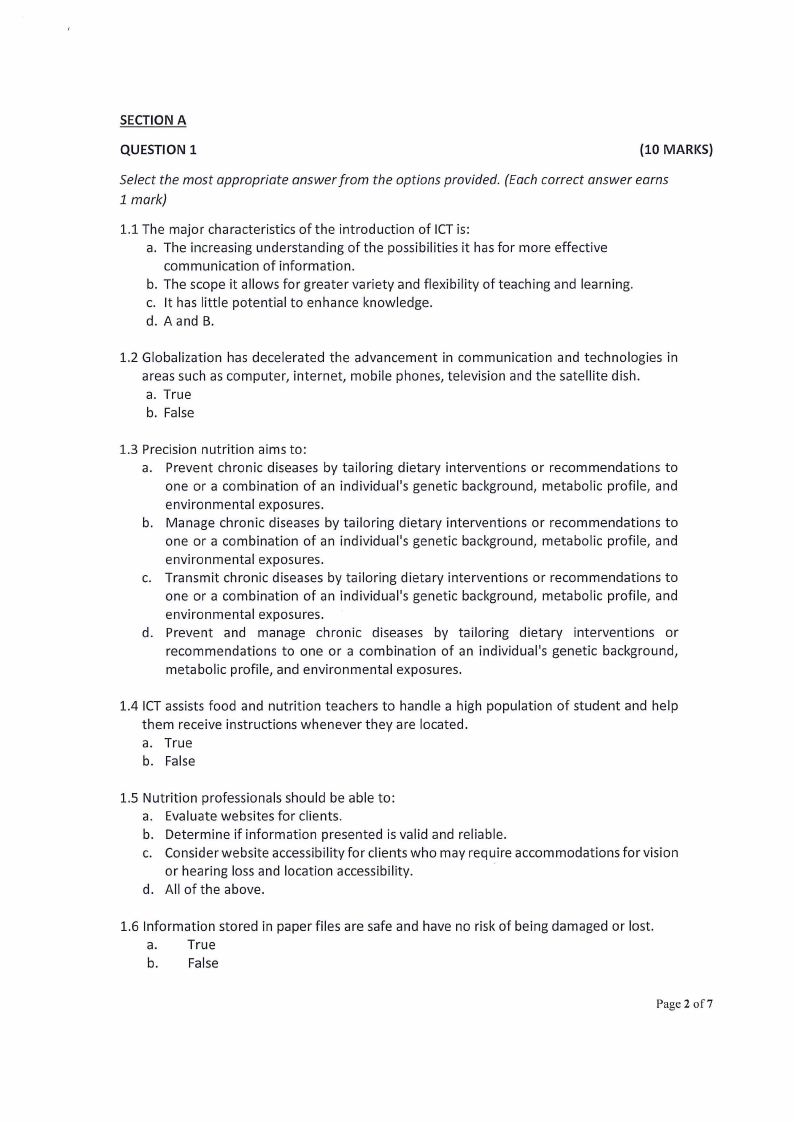
SECTION A
QUESTION 1
(10 MARKS}
Select the most appropriate answer from the options provided. (Each correct answer earns
1 mark)
1.1 The major characteristics of the introduction of ICTis:
a. The increasing understanding of the possibilities it has for more effective
communication of information.
b. The scope it allows for greater variety and flexibility of teaching and learning.
c. It has little potential to enhance knowledge.
d. A and B.
1.2 Globalization has decelerated the advancement in communication and technologies in
areas such as computer, internet, mobile phones, television and the satellite dish.
a. True
b. False
1.3 Precision nutrition aims to:
a. Prevent chronic diseases by tailoring dietary interventions or recommendations to
one or a combination of an individual's genetic background, metabolic profile, and
environmental exposures.
b. Manage chronic diseases by tailoring dietary interventions or recommendations to
one or a combination of an individual's genetic background, metabolic profile, and
environmental exposures.
c. Transmit chronic diseases by tailoring dietary interventions or recommendations to
one or a combination of an individual's genetic background, metabolic profile, and
environmental exposures.
d. Prevent and manage chronic diseases by tailoring dietary interventions or
recommendations to one or a combination of an individual's genetic background,
metabolic profile, and environmental exposures.
1.4 ICT assists food and nutrition teachers to handle a high population of student and help
them receive instructions whenever they are located.
a. True
b. False
1.5 Nutrition professionals should be able to:
a. Evaluate websites for clients.
b. Determine if information presented is valid and reliable.
c. Consider website accessibility for clients who may require accommodations for vision
or hearing loss and location accessibility.
d. All of the above.
1.6 Information stored in paper files are safe and have no risk of being damaged or lost.
a. True
b. False
Page 2 of7
|
|
3 Page 3 |
▲back to top |
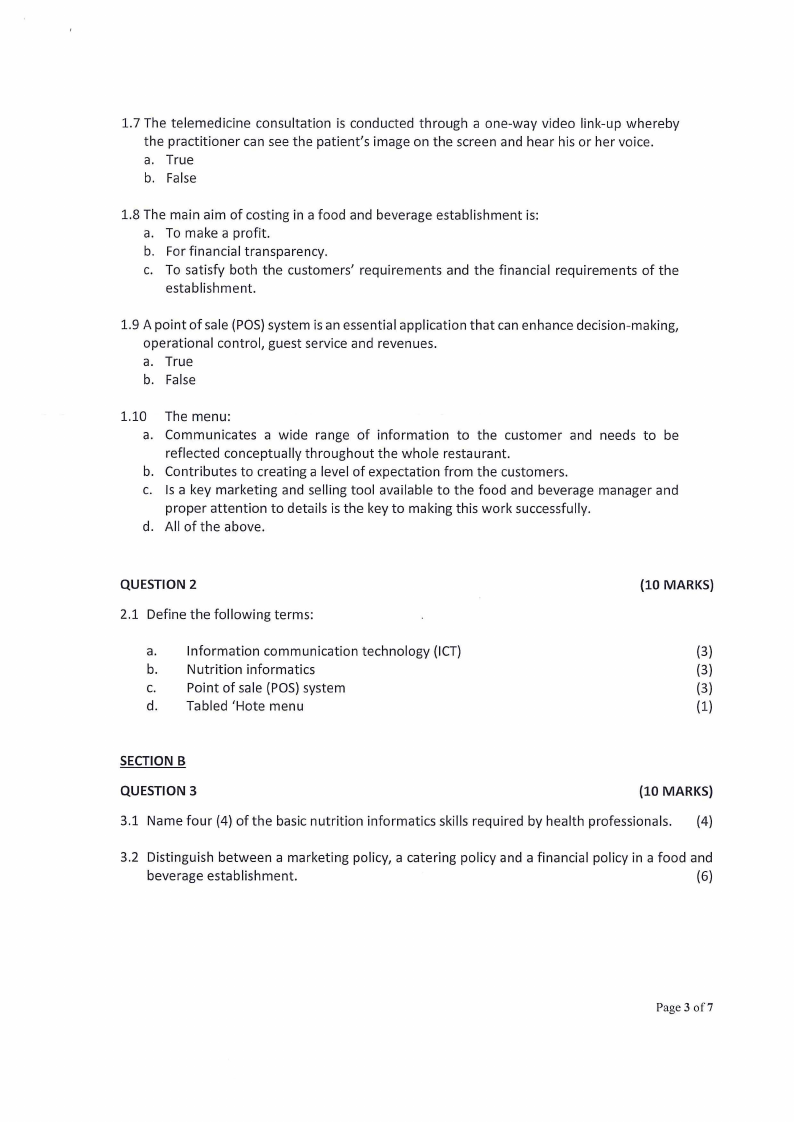
1.7 The telemedicine consultation is conducted through a one-way video link-up whereby
the practitioner can see the patient's image on the screen and hear his or her voice.
a. True
b. False
1.8 The main aim of costing in a food and beverage establishment is:
a. To make a profit.
b. For financial transparency.
c. To satisfy both the customers' requirements and the financial requirements of the
establishment.
1.9 A point of sale (POS)system is an essential application that can enhance decision-making,
operational control, guest service and revenues.
a. True
b. False
1.10 The menu:
a. Communicates a wide range of information to the customer and needs to be
reflected conceptually throughout the whole restaurant.
b. Contributes to creating a level of expectation from the customers.
c. Is a key marketing and selling tool available to the food and beverage manager and
proper attention to details is the key to making this work successfully.
d. All of the above.
QUESTION 2
2.1 Define the following terms:
a. Information communication technology (ICT)
b. Nutrition informatics
C. Point of sale (POS)system
d. Tabled 'Hote menu
(10 MARKS)
(3)
(3)
(3)
(1)
SECTION B
QUESTION 3
(10 MARKS)
3.1 Name four (4) of the basic nutrition informatics skills required by health professionals. (4)
3.2 Distinguish between a marketing policy, a catering policy and a financial policy in a food and
beverage establishment.
(6)
Page 3 of7
|
|
4 Page 4 |
▲back to top |
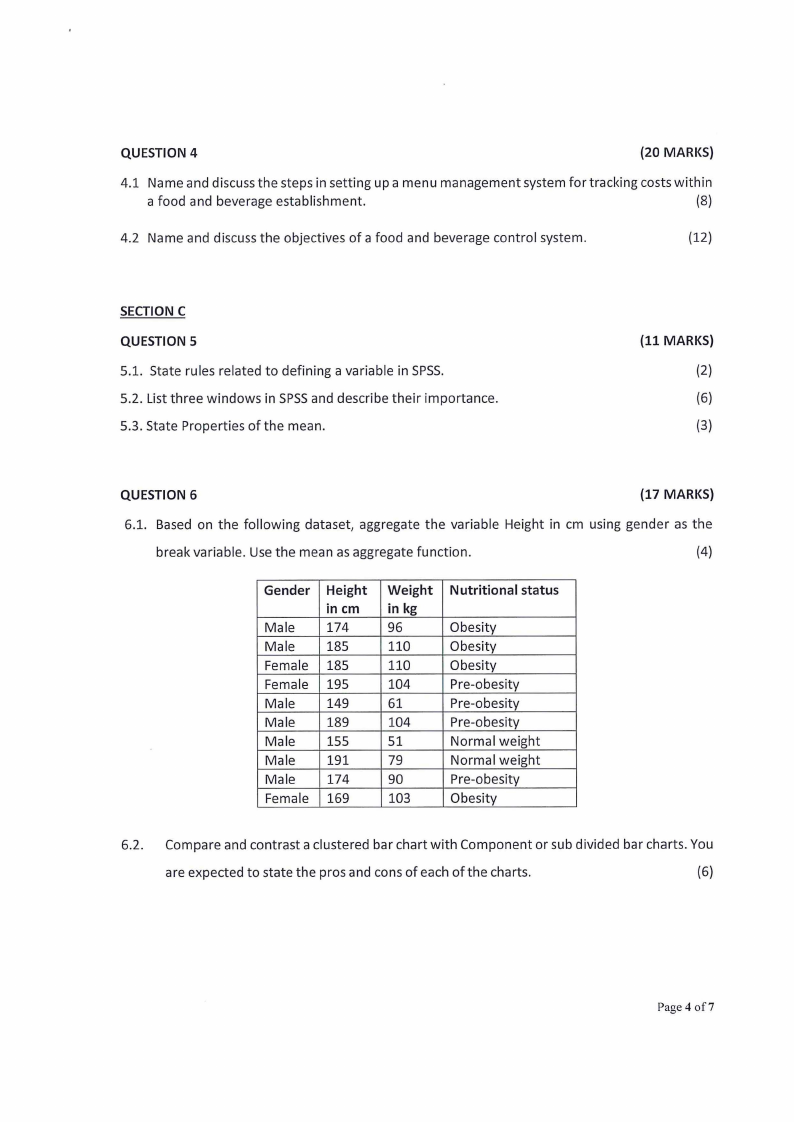
QUESTION 4
{20 MARKS)
4.1 Name and discuss the steps in setting up a menu management system for tracking costs within
a food and beverage establishment.
(8)
4.2 Name and discuss the objectives of a food and beverage control system.
(12)
SECTION C
QUESTION 5
5.1. State rules related to defining a variable in SPSS.
5.2. List three windows in SPSSand describe their importance.
5.3. State Properties of the mean.
{11 MARKS)
(2)
(6)
(3)
QUESTION 6
{17 MARKS)
6.1. Based on the following dataset, aggregate the variable Height in cm using gender as the
break variable. Use the mean as aggregate function.
(4)
Gender
Male
Male
Female
Female
Male
Male
Male
Male
Male
Female
Height
in cm
174
185
185
195
149
189
155
191
174
169
Weight
in kg
96
110
110
104
61
104
51
79
90
103
Nutritional status
Obesity
Obesity
Obesity
Pre-obesity
Pre-obesity
Pre-obesity
Normal weight
Normal weight
Pre-obesity
Obesity
6.2. Compare and contrast a clustered bar chart with Component or sub divided bar charts. You
are expected to state the pros and cons of each of the charts.
(6)
Page 4 of7
|
|
5 Page 5 |
▲back to top |
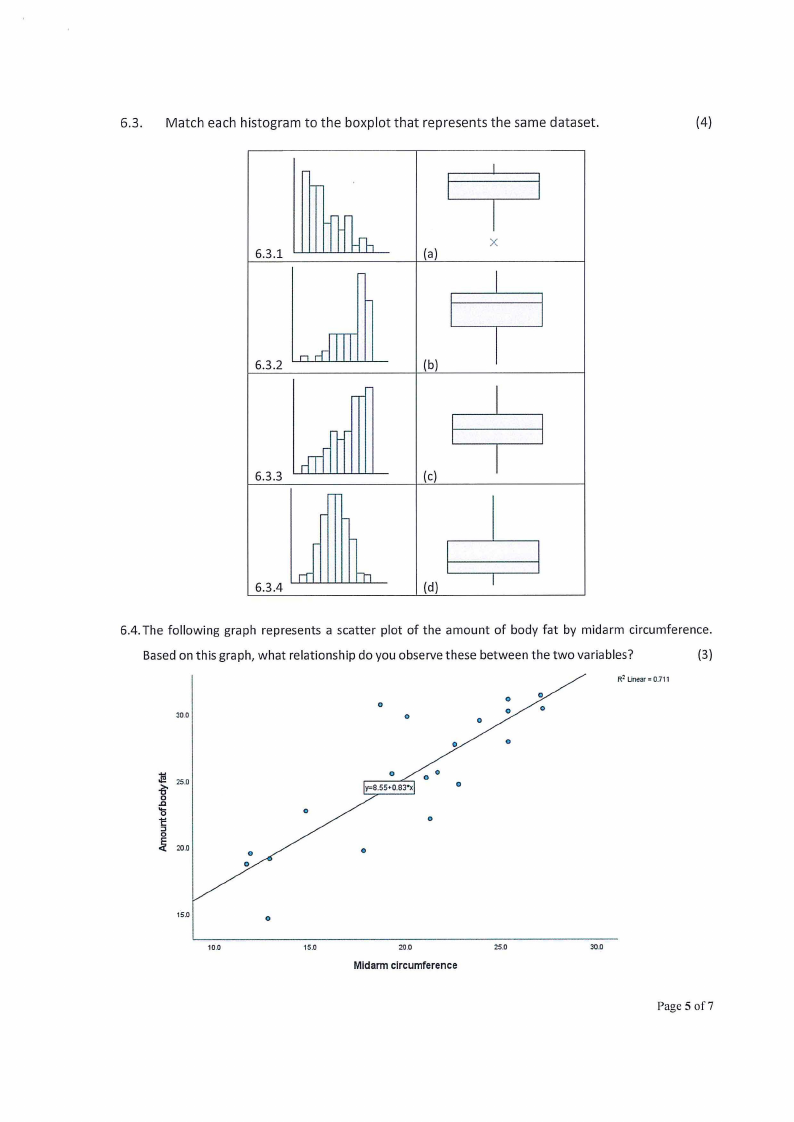
6.3. Match each histogram to the boxplot that represents the same dataset.
(4)
6.3.1
X
(a)
6.3.2
(b)
6.3.3
(c)
6.3.4
(d)
6.4. The following graph represents a scatter plot of the amount of body fat by midarm circumference.
Based on this graph, what relationship do you observe these between the two variables?
(3)
R2 Linear= 0.i11
0
0
30.0
0
0
0
0
0
0
0
i 25.0
.8
'c6
:::J
j 20.0
0
0
0
0
0
0
y=B.55+0.83-X
0
0
0
15.0
10.0
0
15.0
20.0
25.0
Midarm circumference
30.0
Page 5 of7
|
|
6 Page 6 |
▲back to top |
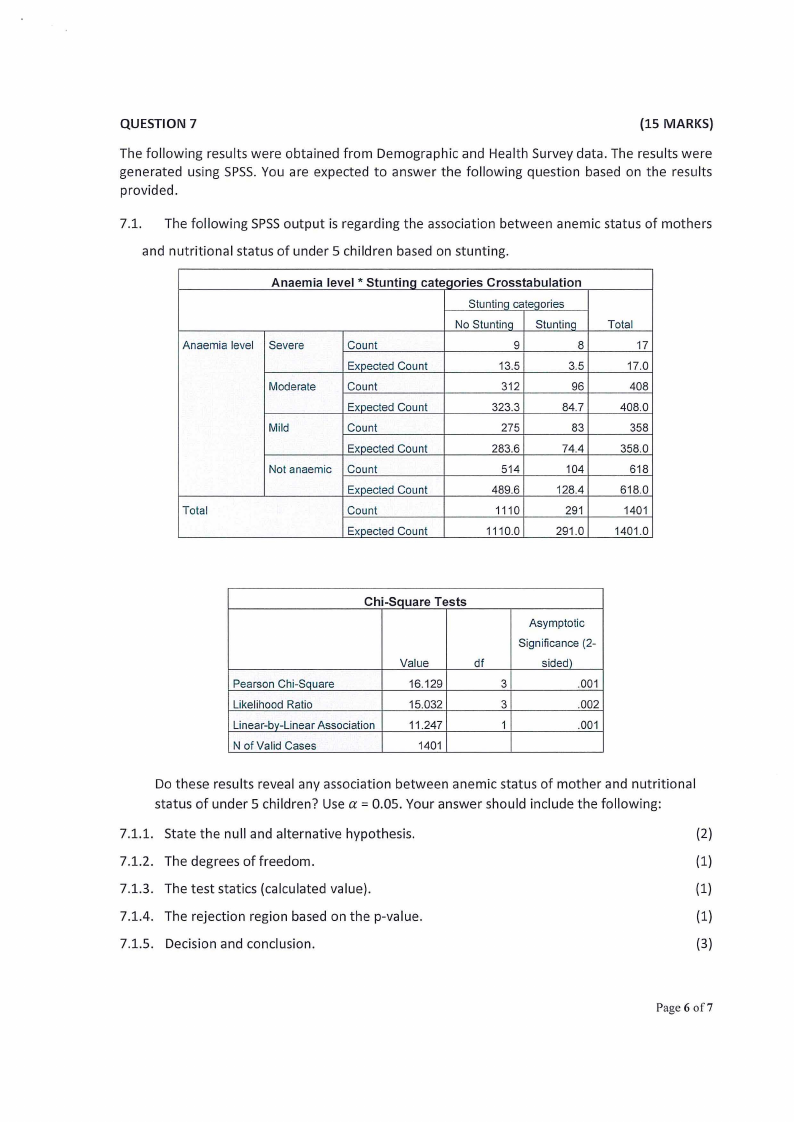
QUESTION 7
{15 MARKS)
The following results were obtained from Demographic and Health Survey data. The results were
generated using SPSS.You are expected to answer the following question based on the results
provided.
7.1. The following SPSSoutput is regarding the association between anemic status of mothers
and nutritional status of under 5 children based on stunting.
Anaemia level
Total
Anaemia level * Stunting categories Crosstabulation
Stuntinq cateqories
No Stuntinq Stuntinq
Severe
Count
9
8
Expected Count
13.5
3.5
Moderate
Count
312
96
Expected Count
323.3
84.7
Mild
Count
275
83
Expected Count
283.6
74.4
Not anaemic Count
514
104
Expected Count
489.6
128.4
Count
1110
291
Expected Count
1110.0
291.0
Total
17
17.0
408
408.0
358
358.0
618
618.0
1401
1401.0
Chi-Square Tests
Value
df
Pearson Chi-Square
16.129
Likelihood Ratio
15.032
Linear-by-Linear Association
11.247
N of Valid Cases
1401
Asymptotic
Significance (2-
sided)
3
.001
3
.002
1
.001
Do these results reveal any association between anemic status of mother and nutritional
status of under 5 children? Use a= 0.05. Your answer should include the following:
7.1.1. State the null and alternative hypothesis.
(2)
7.1.2. The degrees of freedom.
(1)
7.1.3. The test statics (calculated value).
(1)
7.1.4. The rejection region based on the p-value.
(1)
7.1.5. Decision and conclusion.
(3)
Page 6 of7
|
|
7 Page 7 |
▲back to top |
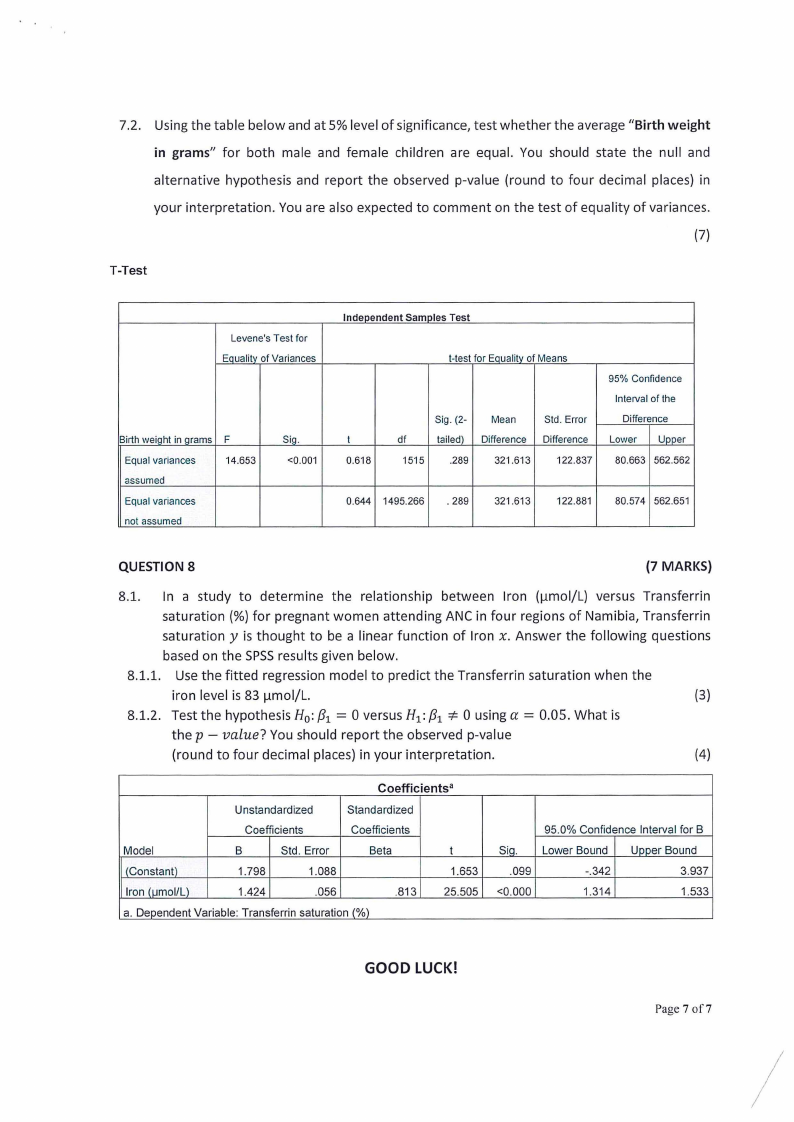
7.2. Using the table below and at 5% level of significance, test whether the average "Birth weight
in grams" for both male and female children are equal. You should state the null and
alternative hypothesis and report the observed p-value {round to four decimal places) in
your interpretation. You are also expected to comment on the test of equality of variances.
(7)
T-Test
Levene's Test for
Equality of Variances
Birth weiqht in qrams F
Equal variances
14.653
assumed
Equal variances
not assumed
Siq.
<0.001
Independent Samples Test
t
0.618
!-test for Equality of Means
Sig. (2-
Mean
Std. Error
df
tailed} Difference Difference
1515
.289
321.613
122.837
95% Confidence
Interval of the
Difference
Lower Uooer
80.663 562.562
0.644 1495.266
. 289
321.613
122.881
80.574 562.651
QUESTION 8
(7 MARKS)
8.1. In a study to determine the relationship between Iron {µmol/L) versus Transferrin
saturation (%) for pregnant women attending ANC in four regions of Namibia, Transferrin
saturation y is thought to be a linear function of Iron x. Answer the following questions
based on the SPSSresults given below.
8.1.1. Use the fitted regression model to predict the Transferrin saturation when the
* iron level is 83 µmol/L.
= 8.1.2. Test the hypothesis H0 : {31 0 versus H1 : {31 0 using a= 0.05. What is
(3)
the p - value? You should report the observed p-value
(round to four decimal places) in your interpretation.
(4)
Coefficients•
Unstandardized
Standardized
Coefficients
Coefficients
Model
B
Std. Error
Beta
t
(Constant)
1.798
1.088
1.653
Iron (umol/Ll
1.424
.056
.813 25.505
a. Deoendent Variable: Transferrin saturation (%)
95.0% Confidence Interval for B
Siq. Lower Bound Uooer Bound
.099
-.342
3.937
<0.000
1.314
1.533
GOOD LUCK!
Page 7 of7
I