


 |
DPS610S - DEMOGRAPHY AND POPULATION STUDIES - 1ST OPP - JUNE 2025 |
|
|
1 Page 1 |
▲back to top |

nAmlBIA UnlVERSITY
OF SCIEnCE Ano TECHnOLOGY
FACULTY OF ENGINEERING AND THE BUILT ENVIRONMENT
DEPARTMENT OF ARCHITECTURE, PLANNING AND CONSTRUCTION
QUALIFICATION: BACHELOROF TOWN AND REGIONAL PLANNING
QUALIFICATION CODE: 07BTAR
NQF LEVEL: 6
COURSE CODE: DPS610S
DATE: JUNE 2025
COURSE NAME: DEMOGRAPHY AND
POPULATION STUDIES
PAPER: THEORY
DURATION: 3 HOURS
MARKS: 100
EXAMINER
MODERATOR
FIRST OPPORTUNITY EXAMINATION QUESTION PAPER
Dr J. l<ohima
Prof E. Yankson
NOTES:
1. Read the entire question paper before answering the questions.
2. You must answer all questions.
3. Please number your answers correctly in an orderly manner.
4. Please write clearly and legibly.
5. Ensure your Student Number is on the Examination Book(s).
THIS QUESTION PAPER CONSISTS OF 4 PAGES (Including this front page)
|
|
2 Page 2 |
▲back to top |
Demography and Population Studies
DPS610S
Question 1
(a) A way of looking at changes in population composition is through population pyramids.
Differentiate between constrictive and expansive population pyramids.
(8)
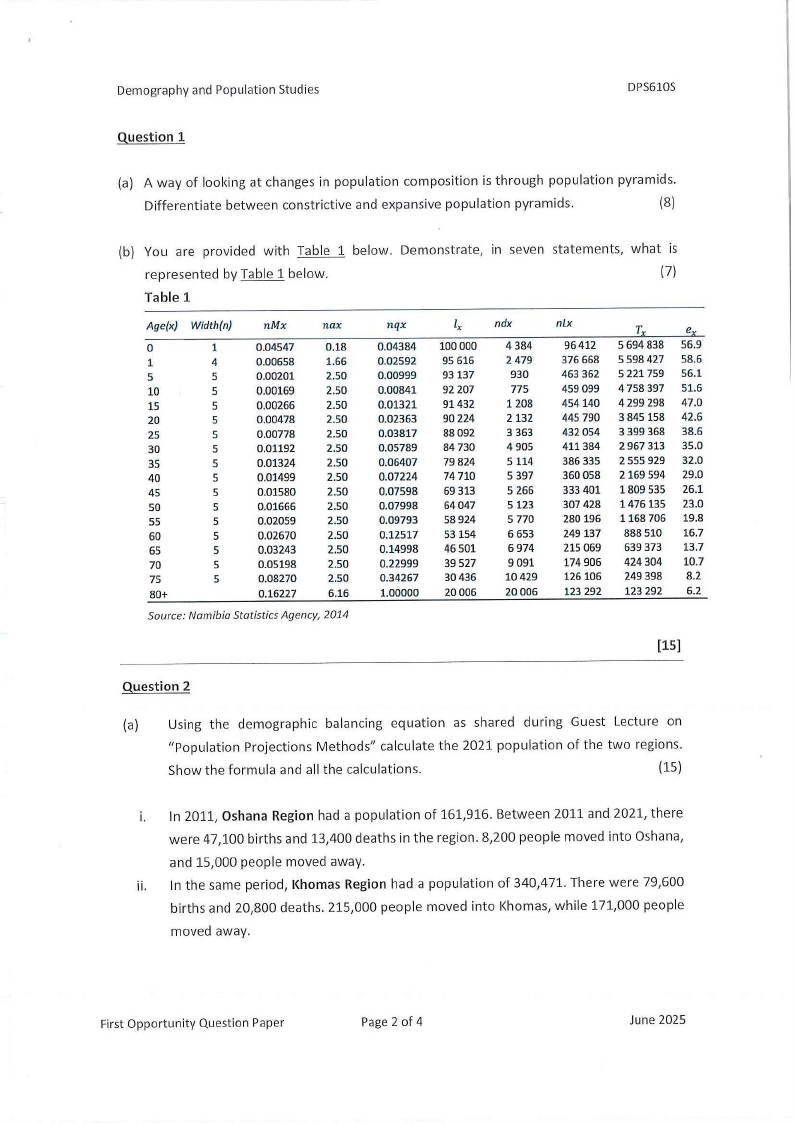
(b) You are provided with Table 1 below. Demonstrate, in seven statements, what is
represented by Table 1 below.
(7)
Table 1
Age(x) Width(n)
nMx
nax
0
1
0.04547
0.18
1
4
0.00658
1.66
5
5
0.00201
2.50
10
5
0.00169
2.50
15
5
0.00266
2.50
20
5
0.00478
2.50
25
5
0.00778
2.50
30
5
0.01192
2.50
35
5
0.01324
2.50
40
5
0.01499
2.50
45
5
0.01580
2.50
so
5
0.01666
2.50
55
5
0.02059
2.50
60
5
0.02670
2.50
65
5
0.03243
2.50
70
5
0.05198
2.50
75
5
0.08270
2.50
80+
0.16227
6.16
Source: Namibia Statistics Agency, 2014
nqx
0.04384
0.02592
0.00999
0.00841
0.01321
0.02363
0.03817
0.05789
0.06407
0.07224
0.07598
0.07998
0.09793
0.12517
0.14998
0.22999
0.34267
1.00000
lx
100 000
95 616
93137
92 207
91432
90224
88092
84 730
79 824
74 710
69 313
64047
58924
53154
46 501
39 527
30436
20006
ndx
4384
2 479
930
775
1208
2132
3 363
4905
5 114
5 397
5 266
5 123
5 770
6 653
6974
9091
10429
20006
nlx
96412
376 668
463 362
459 099
454140
445 790
432 054
411384
386 335
360 058
333 401
307 428
280 196
249137
215 069
174 906
126106
123 292
T
5 694 838
5 598 427
5 221 759
4 758 397
4 299 298
3 845 158
3 399 368
2 967 313
2 555 929
2169 594
1809 535
1476135
1168 706
888 510
639 373
424 304
249 398
123 292
e
56.9
58.6
56.l
51.6
47.0
42.6
38.6
35.0
32.0
29.0
26.1
23.0
19.8
16.7
13.7
10.7
8.2
6.2
[15]
Question 2
(a) Using the demographic balancing equation as shared during Guest Lecture on
"Population Projections Methods" calculate the 2021 population of the two regions.
Show the formula and all the calculations.
(15)
i. In 2011, Oshana Region had a population of 161,916. Between 2011 and 2021, there
were 47,100 births and 13,400 deaths in the region. 8,200 people moved into Oshana,
and 15,000 people moved away.
ii. In the same period, l{homas Region had a population of 340,471. There were 79,600
births and 20,800 deaths. 215,000 people moved into Khomas, while 171,000 people
moved away.
First Opportunity Question Paper
Page 2 of 4
June 2025
|
|
3 Page 3 |
▲back to top |
Demography and Population Studies
DPS610S
(b) Population projections can be classified into objective and subjective projections.
Distinguish between objective and subjective projections, by offering three facts about
each projection.
(6)
[21)
Question 3
(a) Population data can be analysed using various methods such as accessibility indexes.
Distinguish between the two accessibility indexes that are widely used, by providing two
facts about each index.
(6)
(b) Discuss the apartheid South African programme that resulted in the forceful resignation
of South Africa from the International Planned Parenthood Federation in 1987.
(7)
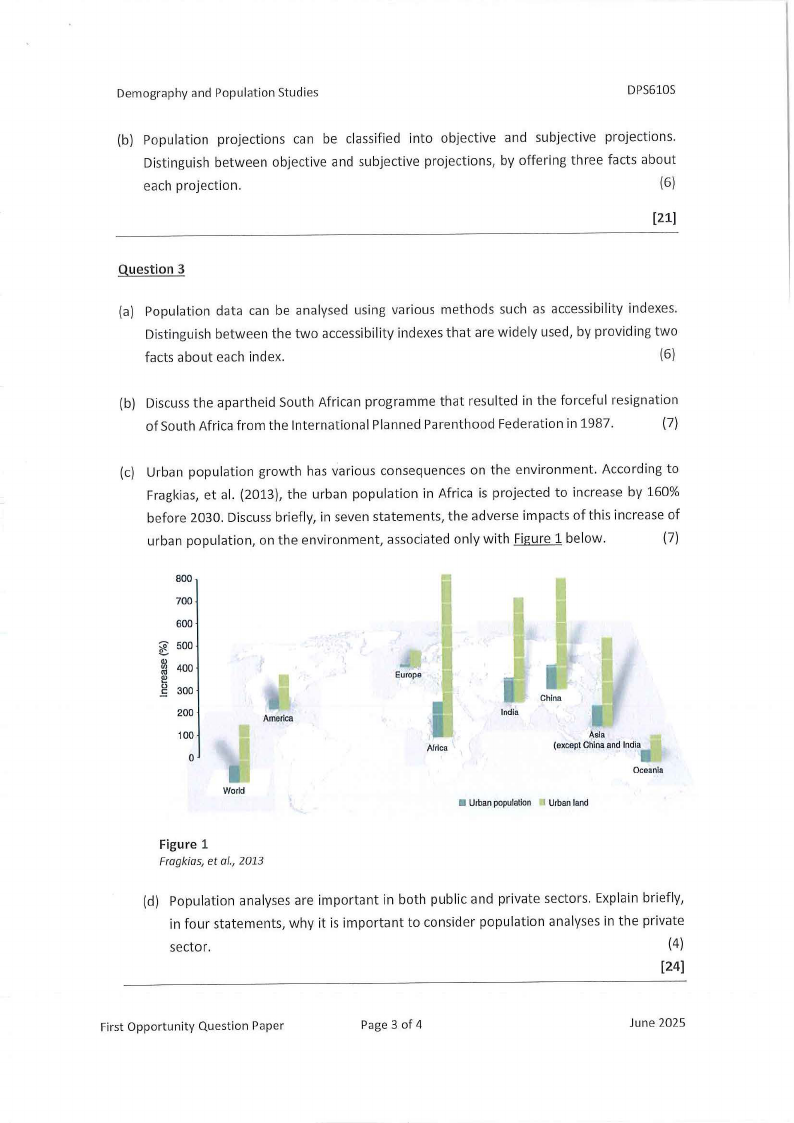
(c) Urban population growth has various consequences on the environment. According to
Fragkias, et al. (2013), the urban population in Africa is projected to increase by 160%
before 2030. Discuss briefly, in seven statements, the adverse impacts of this increase of
urban population, on the environment, associated only with Figure 1 below.
(7)
800
700
600
500
Q)
Ill
."Iu=!!'
400
300
200
100
0
America
World
Europe
Africa
India
China
Asia
(exceptChinaand India
Oceania
Urbanpopulation Urbanland
Figure 1
Fragkias, et al., 2013
(d) Population analyses are important in both public and private sectors. Explain briefly,
in four statements, why it is important to consider population analyses in the private
sector.
(4)
[24)
First Opportunity Question Paper
Page 3 of 4
June 2025
|
|
4 Page 4 |
▲back to top |
Demography and Population Studies
DPS610S
Question 4
(a) A certain population theorist stipulated that there are two possible checks that could
limit population growth. Compile a table distinguishing these two checks.
(10)
(b) One theorist analysed the prevailing situation in different countries, as part of his essay
titled "An Essayon the Principle of Populations as it affects the Future Improvement of
Society." Critique, in ten (10) statements, the theorist's perspectives on population. (10)
(c) An established population theory was criticised for not explaining the phenomenon of
"the baby boom" in Western countries after the Second World War. Based on the
critiques, the theory was reformulated, and subsequently reinterpreted as a set of
interrelated transitions. Determine the five interrelated transitions of the reformulated
theory.
(5)
(d) There are various population theories. Discuss, in five sentences, the prepositions of the
theory criticised for applying a law of diminishing returns to a period of time.
(5)
[30]
Question 5
(a) International migration can be explained through various theories. Identify two (2)
theories that explain international migration.
(2)
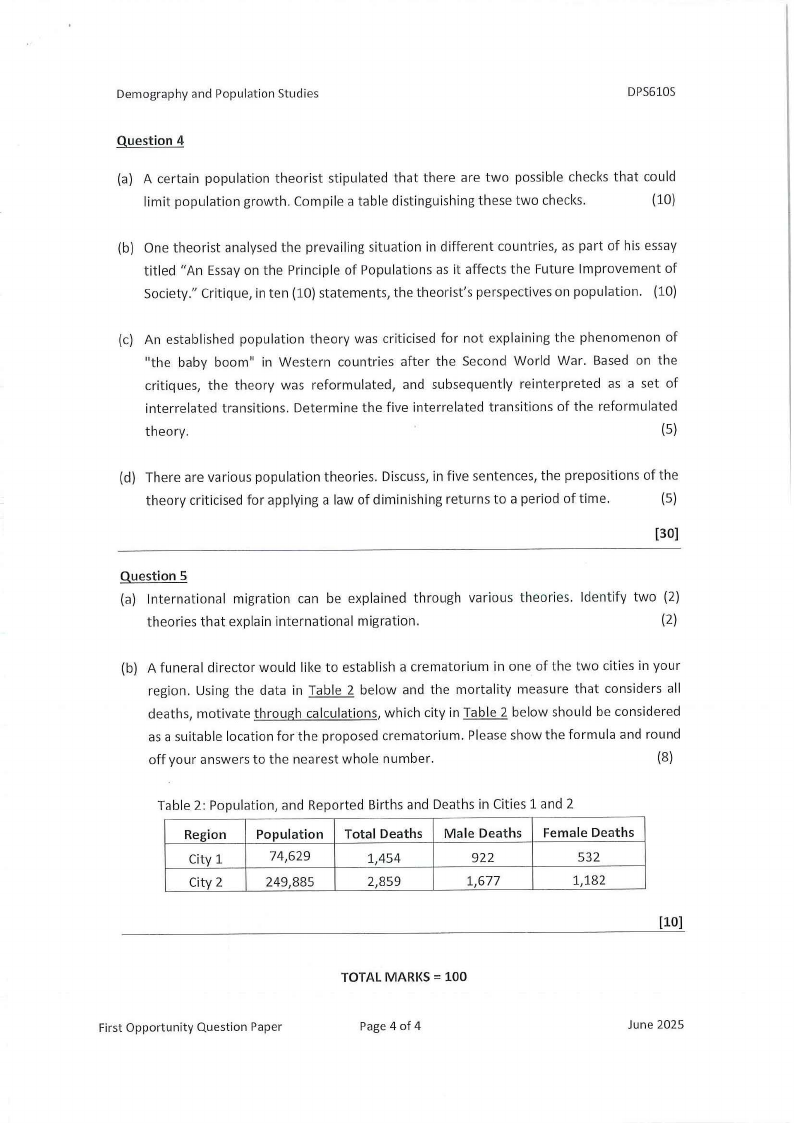
(b) A funeral director would like to establish a crematorium in one of the two cities in your
region. Using the data in Table 2 below and the mortality measure that considers all
deaths, motivate through calculations, which city in Table 2 below should be considered
as a suitable location for the proposed crematorium. Please show the formula and round
off your answers to the nearest whole number.
(8)
Table 2: Population, and Reported Births and Deaths in Cities 1 and 2
Region
City 1
City 2
Population
74,629
249,885
Total Deaths
1,454
2,859
Male Deaths
922
1,677
Female Deaths
532
1,182
[10]
First Opportunity Question Paper
TOTAL MARKS= 100
Page 4 of 4
June 2025