


 |
AAC811S - ADVANCED ANALYTICAL METHOD AND CHEMOMETRICS - 1ST OPP - JUNE 2022 |
|
|
1 Page 1 |
▲back to top |
o
NAMIBIA UNIVERSITY
OF SCIENCE AND TECHNOLOGY
FACULTY OF HEALTH, APPLIED SCIENCES AND NATURAL RESOURCES
DEPARTMENT OF NATURAL AND APPLIED SCIENCES
QUALIFICATION: BACHELOR OF SCIENCE HONOURS
QUALIFICATION CODE: 08BOSH
LEVEL: 8
COURSE CODE: AAC811S
COURSE NAME: ADVANCED ANALYTICAL METHOD
AND CHEMOMETRICS
SESSION: JUNE 2022
DURATION: 3 HOURS
PAPER: THEORY
MARKS: 100
FIRST OPPORTUNITY EXAMINATION QUESTION PAPER
EXAMINER(S) | DR JULIEN LUSILAO
MOpDERATOR;: | PROF JAMES ABAH
INSTRUCTIONS
1. Answer ALL the questions in the answer book provided.
2. Write and number your answers clearly.
3. All written works MUST be done in blue or black ink.
PERMISSIBLE MATERIALS
Non-programmable Calculators
ATTACHMENTS
List of Useful Tables and formulas
THIS QUESTION PAPER CONSISTS OF 7 PAGES (Including this front page and attachments)
|
|
2 Page 2 |
▲back to top |
Question 1
[20]
1.1 (a) Differentiate between method development and method validation.
(4)
(b) What is ruggedness and how would you evaluate it experimentally?
(3)
1.2 Discuss how overshooting the endpoint in titration would affect molarity.
(4)
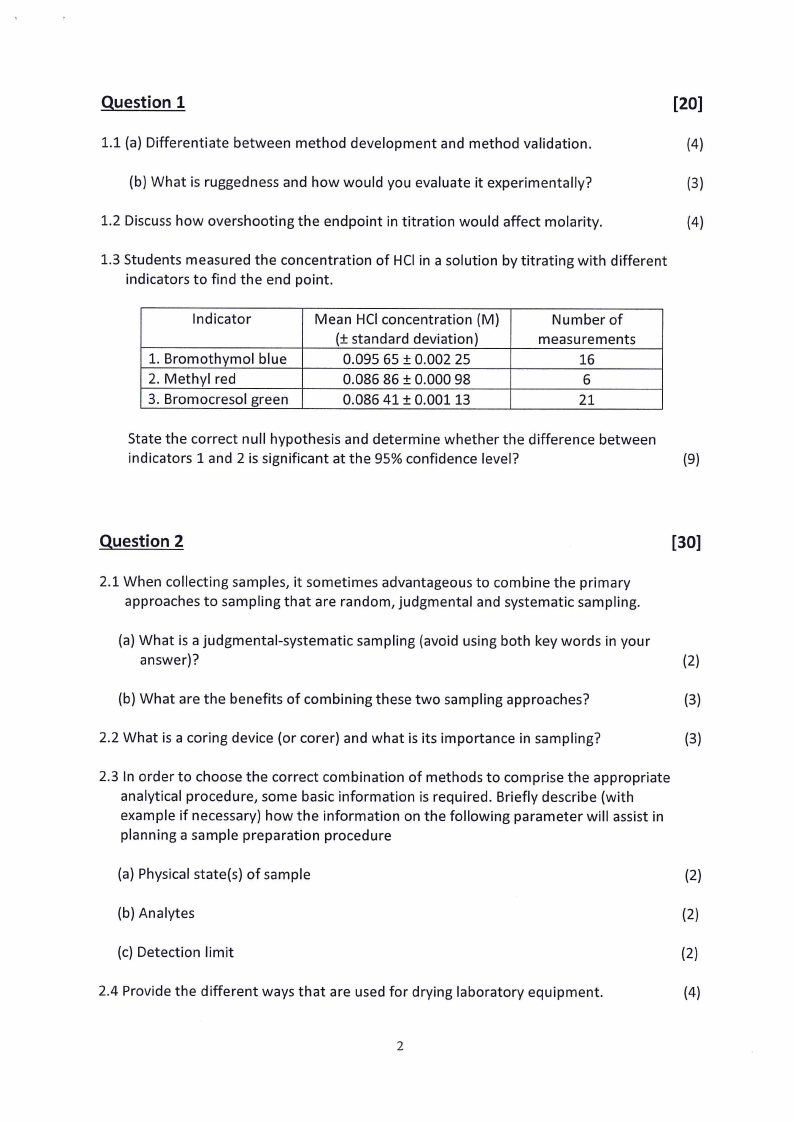
1.3 Students measured the concentration of HCl in a solution by titrating with different
indicators to find the end point.
Indicator
1. Bromothymol blue
2. Methyl red
3. Bromocresol green
Mean HCI concentration (M)
(+ standard deviation)
0.095 65 + 0.002 25
0.086 86 + 0.000 98
0.086 41 + 0.001 13
Number of
measurements
16
6
21
State the correct null hypothesis and determine whether the difference between
indicators 1 and 2 is significant at the 95% confidence level?
(9)
Question 2
[30]
2.1 When collecting samples, it sometimes advantageous to combine the primary
approaches to sampling that are random, judgmental and systematic sampling.
(a) What is a judgmental-systematic sampling (avoid using both key words in your
answer)?
(2)
(b) What are the benefits of combining these two sampling approaches?
(3)
2.2 What is a coring device (or corer) and what is its importance in sampling?
(3)
2.3 In order to choose the correct combination of methods to comprise the appropriate
analytical procedure, some basic information is required. Briefly describe (with
example if necessary) how the information on the following parameter will assist in
planning a sample preparation procedure
(a) Physical state(s) of sample
(2)
(b) Analytes
(2)
(c) Detection limit
(2)
2.4 Provide the different ways that are used for drying laboratory equipment.
(4)
|
|
3 Page 3 |
▲back to top |
2.5 The vessels that are used for microwave digestion/extraction are made in Teflon®
(or fluoropolymer) and fused silica. What is (are) the reason(s) behind the choice of
these materials?
(4)
2.6 Briefly discuss how temperature and pressure contribute in the disruption of surface
equilibria during extraction processes.
(8)
Question 3
[25]
3.1 A spectrophotometric method for the analysis of iron has a linear calibration curve
for standards of 0.00, 5.00, 10.00, 15.00, and 20.00 mg Fe/L. An iron ore sample
that is 40-60% w/w is to be analyzed by this method.
(a) An approximately 0.5-g sample is taken, dissolved in a minimum of concentrated
HCl, and diluted to 1 Lin a volumetric flask using distilled water. What is the
concentration of Fe (in mg/L) in the solution?
(2)
(b) A 5.00 mL aliquot from the solution in (a) is removed with a pipette. To what
volume between 10, 100, and 1000 mL should the aliquot be diluted to minimize
the uncertainty in the analysis? Use appropriate calculations to explain your
choice.
(4)
3.2 The spectrophotometric methods for determining Mn in steel and for determining
glucose use a chemical reaction to produce a coloured species whose absorbance
we can monitor. In the analysis of Mn in steel, colourless Mn?* is oxidized to give
the purple MnOg ion. To analyze for glucose, which is colourless, we react it with
a yellow coloured solution of the Fe(CN)«*, forming the colourless Fe(CN)¢* ion.
The directions for the analysis of Mn do not specify precise reaction conditions,
and samples and standards may be treated separately. The conditions for the
analysis of glucose, however, require that the samples and standards be treated
simultaneously at exactly the same temperature and for exactly the same length
of time.
(a) What calibration method(s) is (are) used for the Mn and glucose determination?
Explain your answer.
(2)
(b) Why these two experimental procedures are so different?
(4)
3.3 Yan and colleagues developed a method for the analysis of iron based on its
formation of a fluorescent metal-ligand complex with the ligand
5-(4-methylphenylazo)-8-aminoquinoline. In the presence of the surfactant
cetyltrimethyl ammonium bromide the analysis is carried out using an excitation
wavelength of 316 nm with emission monitored at 528 nm. Standardization with
external standards gives the following calibration curve:
If= -003 + 1.594 mg Fe?*/L
A 0.5113-g sample of dry dog food was ashed to remove organic materials, and the
|
|
4 Page 4 |
▲back to top |
residue dissolved in a small amount of HCI and diluted to volume in a 50-mL
volumetric flask. Analysis of the resulting solution gave a fluorescent emission
intensity of 5.72. Determine the concentration of Fe (in ppm) in the sample of dog
food.
(3)
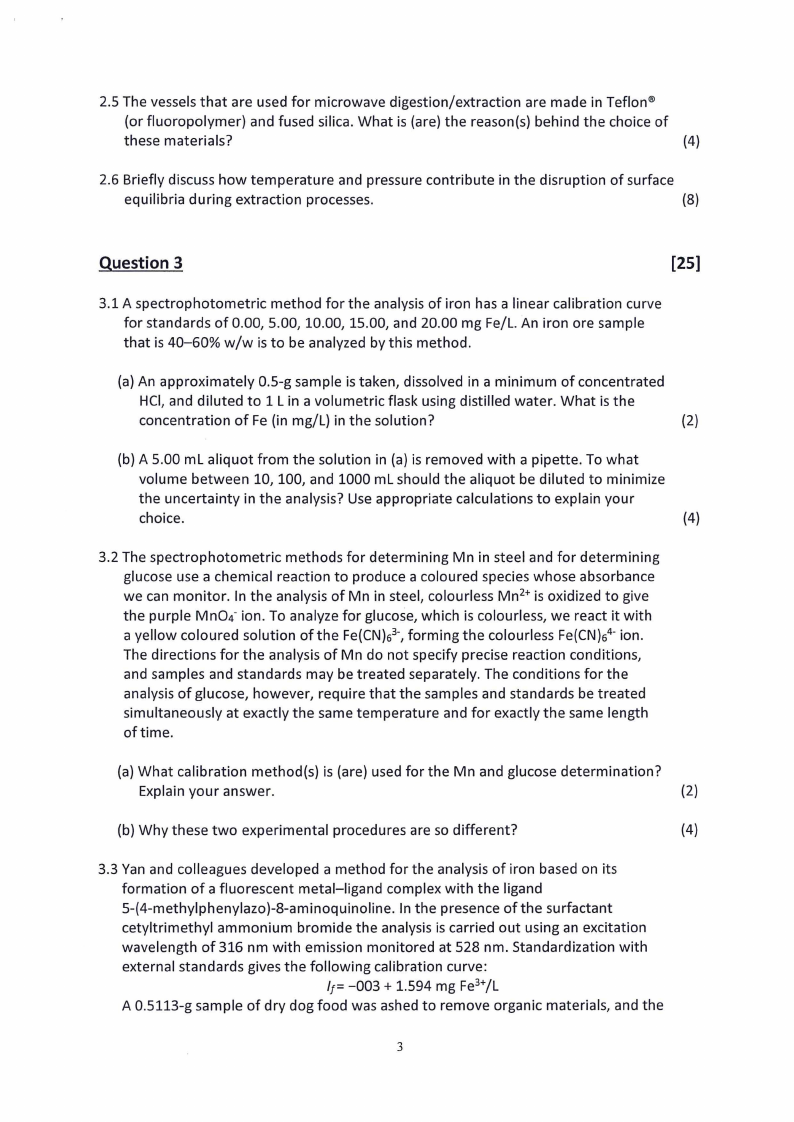
3.4 The Total Youden Blank (TYB) is an uncommon approach used for correcting
analytical signal. The correction is determined by plotting the sample signal (Ssamp) Vs
the amount of sample and using the following correction equation:
W
Sa—mTpYB
Where Cy: analyte concentration; Wa & Wsamp: weight of analyte and sample,
respectively; ka: slope of calibration curve.
(a) Using the above information, show that when the signals from the data set in the
table below are corrected using the TYB approach, the resulting concentrations of
the analyte will be the same for all samples.
Wstd ")
Sst”)
Sample
number
Wsamp
Ssamp
1.6667
0.2500
1
62.4746
0.8000
5.0000
0.5000
2
82.7915
1.0000
8.3333
0.7500
3
103.1085
1.2000
11.6667
0.8416
18.1600
1.4870
19.9333
1.6200
(") Weta = weight of analyte used to prepare the external standard
(") Ssta = Standard signal
The obtained regression between Wsamp and Ssamp is
Ssamp = 0.009844 x Wsamp + 0.185
Whereas the standard calibration equation is
Ssta= 0.0750 x Wstg + 0.1250
(5)
(b) Why is the TYB approach said to be better than the usual reagent and standard
blank corrections?
(5)
Question 4
[25]
4.1 Briefly describe how radiochemical methods are classified based on the origin of
the radioactivity and, for each category, provide an example of a corresponding
analytical technique.
(6)
4.2 The following diagram shows two examples of a dual-channel manifold for flow
|
|
5 Page 5 |
▲back to top |
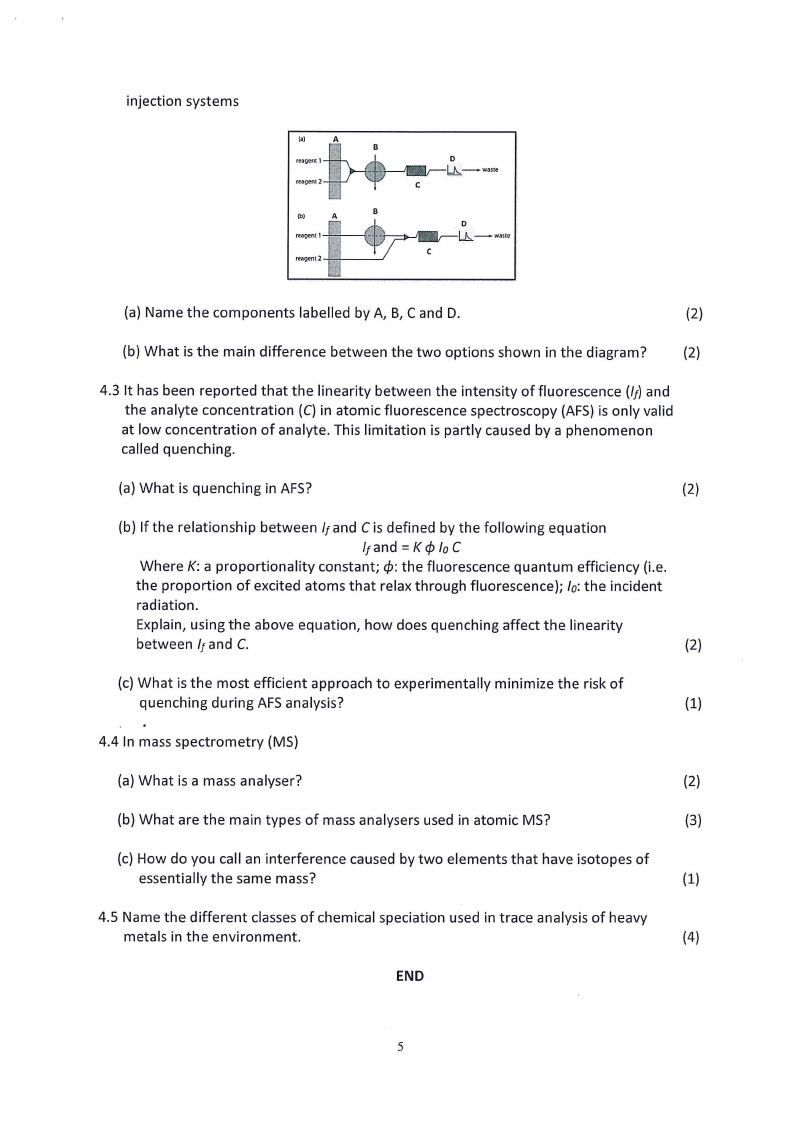
injection systems
(a)
reagent 1 —
reagent 2—
B
ff
(b)
B
reagent | ———
gh
ae
v
reagent2 ——
D
AG
J. ——+ waste
c
6
LA. — waste
c
(a) Name the components labelled by A, B, C and D.
(2)
(b) What is the main difference between the two options shown in the diagram?
(2)
4.3 It has been reported that the linearity between the intensity of fluorescence (/;) and
the analyte concentration (C) in atomic fluorescence spectroscopy (AFS) is only valid
at low concentration of analyte. This limitation is partly caused by a phenomenon
called quenching.
(a) What is quenching in AFS?
(2)
(b) If the relationship between /; and C is defined by the following equation
lpand=K @loC
Where K: a proportionality constant; @: the fluorescence quantum efficiency (i.e.
the proportion of excited atoms that relax through fluorescence); /o: the incident
radiation.
Explain, using the above equation, how does quenching affect the linearity
between /¢and C.
(2)
(c) What is the most efficient approach to experimentally minimize the risk of
quenching during AFS analysis?
(1)
4.4 In mass spectrometry (MS)
(a) What is a mass analyser?
(2)
(b) What are the main types of mass analysers used in atomic MS?
(c) How do you call an interference caused by two elements that have isotopes of
essentially the same mass?
(1)
4.5 Name the different classes of chemical speciation used in trace analysis of heavy
metals in the environment.
(4)
END
|
|
6 Page 6 |
▲back to top |
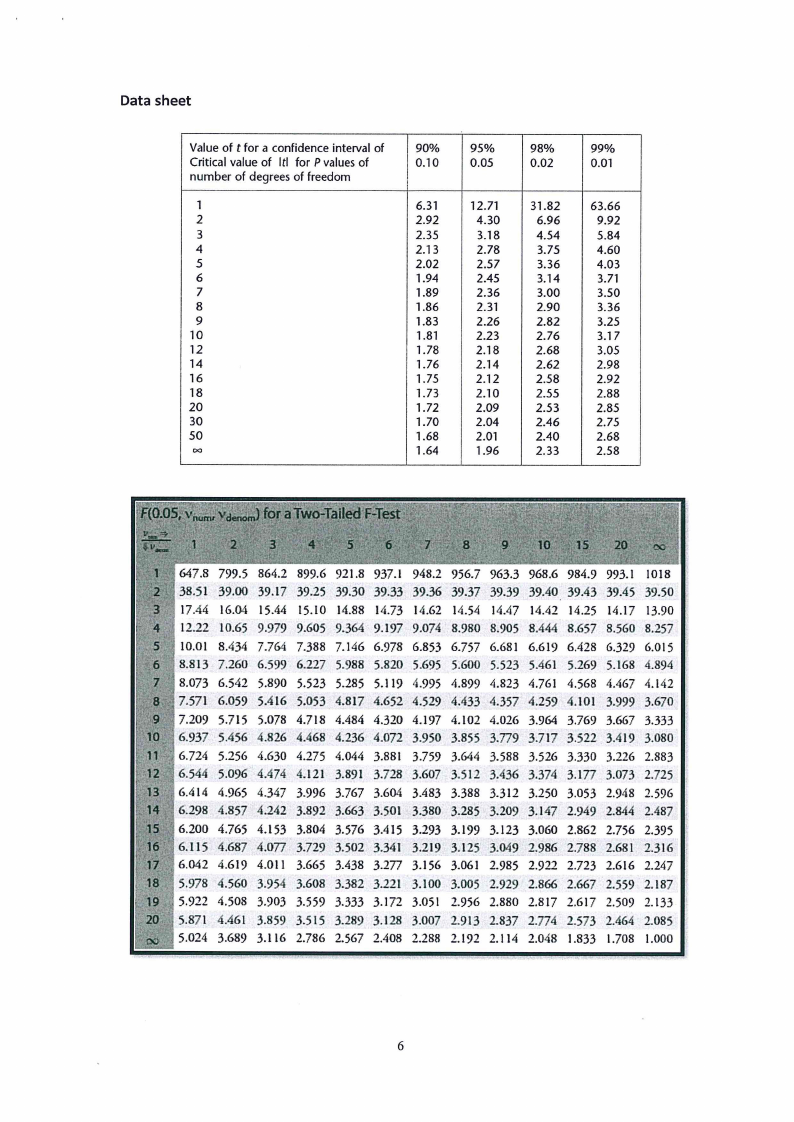
Data sheet
Value of t for a confidence interval of
90%
95%
98%
99%
Critical value of Itl for P values of
0.10
0.05
0.02
0.01
number of degrees of freedom
1
6.31
12.71
31.82
63.66
2
2.92
4.30
6.96
9.92
3
2.35
3.18
4.54
5.84
4
2.13
2.78
3.75
4.60
5
2.02
2.57
3.36
4.03
6
1.94
2.45
3.14
3.71
7
1.89
2.36
3.00
3.50
8
1.86
2.31
2.90
3.36
9
1.83
2.26
2.82
3.25
10
1.81
2.23
2.76
3.17
12
1.78
2.18
2.68
3.05
14
1.76
2.14
2.62
2.98
16
1.75
2.12
2.58
2.92
18
1.73
2.10
2.55
2.88
20
1.72
2.09
2.53
2.85
30
1.70
2.04
2.46
275
50
1.68
2.01
2.40
2.68
9
1.64
1.96
2.33
2.58
647.8 799.5 864.2
948.2 956.7 963.3
993.1 1018
38.51 39.00 39.17 39.25 39.30 39.33 39.36 39.37 39.39 39.40 39.43 39.45 39.50 |
17.44 16.04 15.44 15.10 14.88 14.73 14.62 14.54 1447 14.42 14.25 14.17 13.90
12.22 10.65 9.979 9.605 9.364 9.197 9.074 8.980 8.905 8.444 8.657 8.560 8.257
10.01 8.434 7.764 7.388 7.146 6.978 6.853 6.757 6.681 6.619 6.428 6.329 6.015
8.813 7.260 6.599 6.227 5.988 5.820 5.695 5.600 5.523 5.461 5.269 5.168 4.894
8.073 6.542 5.890 5.523 5.285 5.119 4.995 4.899 4.823 4.761 4.568 4.467 4.142
7.571 6.059 5.416 5.053 4.817 4.652 4.529 4.433 4.357 4.259 4.101 3.999 3.670
19° 7.209 5.715 5.078 4.718 4.484 4.320 4.197 4.102 4.026 3.964 3.769 3.667 3.333
O | 6.937 5.456 4.826 4468 4.236 4.072 3.950 3.855 3.779 3.717 3.522 3.419 3.080
© 6.724 5.256 4.630 4.275 4.044 3.881 3.759 3.644 3.588 3.526 3.330 3.226 2.883
16.544 5.096 4.474 4.121 3.891 3.728 3.607 3.512 3.436 3.374 3.177 3.073 2.725
6.414 4.965 4.347 3.996 3.767 3.604 3.483 3.388 3.312 3.250 3.053 2.948 2.596
4) 6.298 4.857 4.242 3.892 3.663 3.501 3.380 3.285 3.209 3.147 2.949 2.844 2.487
5 6.200 4.765 4.153 3.804 3.576 3.415 3.293 3.199 3.123 3.060 2.862 2.756 2.395
PAG) 6.115 4.687 4.077 3.729 3.502 3.341 3.219 3.125 3.049 2.986 2.788 2.681 2.316
7 6.042 4.619 4.011 3.665 3.438 3.277 3.156 3.061 2.985 2.922 2.723 2.616 2.247
~ 5.978 4.560 3.954 3.608 3.382 3.221 3.100 3.005 2.929 2.866 2.667 2.559 2.187
» 5.922 4.508 3.903 3.559 3.333 3.172 3.051 2.956 2.880 2.817 2.617 2.509 2.133
| 5.871 4.461 3.859 3.515 3.289 3.128 3.007 2.913 2.837 2.774 2.573 2.464 2.085
5.024 3.689 3.116 2.786 2.567 2.408 2.288 2.192 2.114 2.048 1.833 1.708 1.000
|
|
7 Page 7 |
▲back to top |
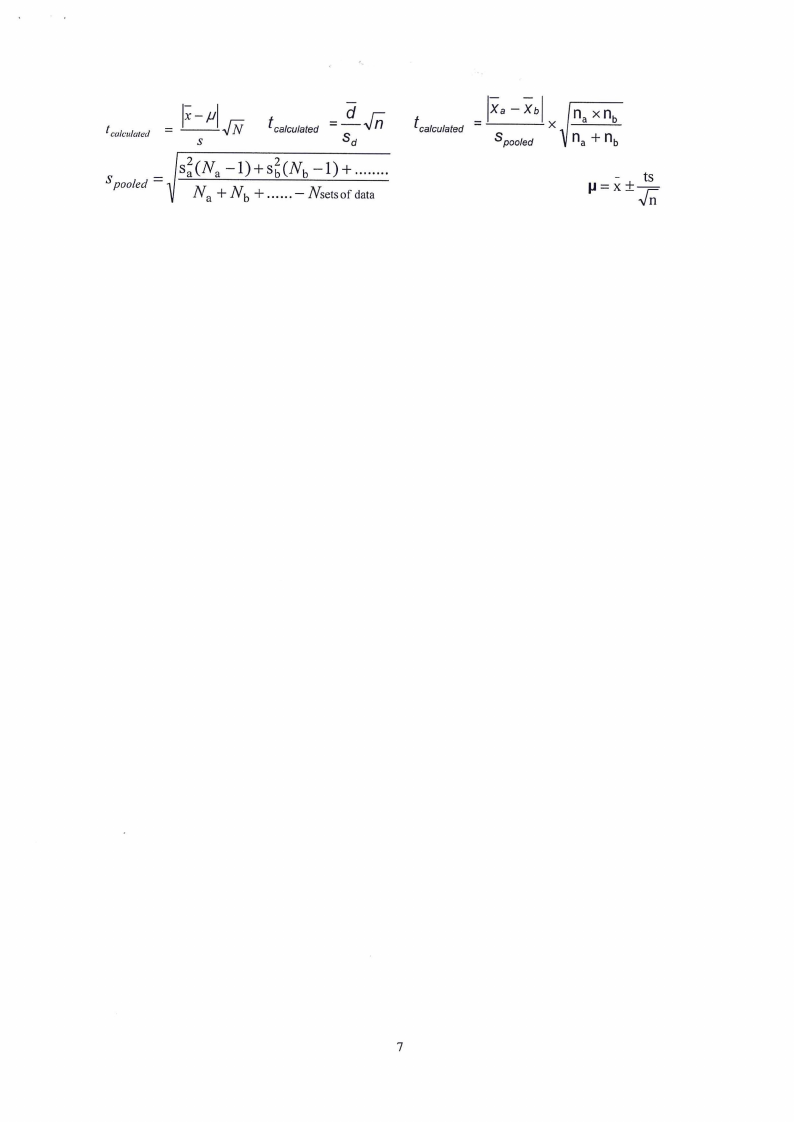
t calculated
5 pooled —
VN
Ss
t calculated
4 fp
d
t calculated
[xe —Xo|
= Ss pooled
[Ma XM
n, +n,