


 |
RME620S - RESEARCH METHODOLOGY - 1ST OPP - NOV 2022 |
|
|
1 Page 1 |
▲back to top |
r
nAm I BI A un IVERSITY
OF SCIEnCE Ano TECHnOLOGY
FACULTYOF HEALTH,NATURALRESOURCESAND APPLIEDSCIENCES
DEPARTMENTOF AGRICULTUREAND NATURALRESOURCESCIENCES
QUALIFICATION: BACHELOROF SCIENCEIN AGRICULTURE
QUALIFICATIONCODE: 07BAGA
LEVEL: 7
COURSECODE: RME620S
COURSENAME: RESEARCHMETHODOLOGY
DATE: NOVEMBER 2022
DURATION: 3 HOURS
MARKS: 100
FIRSTOPPORTUNITY EXAMINATION QUESTION PAPER
EXAMINER(S) Dr Thinah Mayo
MODERATOR: Dr Tendai Nzuma
INSTRUCTIONS
1. Answer ALL five (5) questions.
2. Please write neatly and legibly.
3. Number the answers clearly.
4. Show all your working.
5. Round your answers to two decimal places for all calculations.
PERMISSIBLEMATERIALS
1. Examination question paper
2. Answering book
3. Calculators
THIS QUESTION PAPERCONSISTSOF 3 PAGES(Excluding this front page)
|
|
2 Page 2 |
▲back to top |
r
QUESTION 1
[20 Marks]
(a) What is the difference between quantitative and qualitative research methods?(2 Marks)
(b) Explain why research is considered to be an iterative process.
(2 Marks)
(c) Define mixed-methods research?
(2 Marks)
(d) You are interested in knowing what percent of all households in a large city have a
single woman as the head of the household. To estimate this percentage, you
conduct a census survey with 300 households and determine how many of these
300 are headed by a single woman. In this example,
(i) what is the population?
(2 Marks)
(ii) what is the sample?
(2 Marks)
(iii) what is the parameter?
(2 Marks)
(iv) what is the variable?
(2 Marks)
(v) what is the statistic?
(2 Marks)
(e) List incorrect citations from the paragraph below.
According to (Scoones, 2009), diverse livelihoods emerge from multiple activities
interacting with each other. Several factors influence smallholder farmers' choice of
livelihood strategies and dependence on agriculture (Ellis, 1998; Alemu 2012). Sikhweni
& Hassan (2014) state that apart from understanding rural households' preferred
livelihood strategies, underlying determinants driving them towards any of the livelihood
choices are equally important for an investigation.
(3 Marks)
(f) Is this a correct way of listing this journal article using APA 6th Edition referencing style?
Francis, D. & Mayo, T. (2022). Making minds: What's wrong with education, and what
should we do about it? Journal of Teaching and Teacher Education, 11(3), 229-241. (1
Mark)
QUESTION 2
[20 Marks]
(a) A large statistics class takes a midsemester examination worth a total of 100 points. The
following is a random sample of 20 students' scores from the class.
Score of 98 points: 2 students
Score of 95 points: 1 student
Score of 92 points: 3 students
Score of 88 points: 4 students
Score of 87 points: 2 students
Score of 85 points: 2 students
Score of 81 points: 1 student
2
|
|
3 Page 3 |
▲back to top |
Score of 78 points: 2 students
Score of 73 points: 1 student
Score of 72 points: 1 student
Score of 65 points: 1 student
(a) To the nearest tenth of a point, what is the standard deviation of the exam score for the
students in this sample?
(15 Marks)
s=
Hint:
(b) What is the mode and median class marks?
(5 Marks)
QUESTION 3
[20 Marks]
(a) A Real Estate Agent tells you that the average cost of houses in a town is NAD2,176,000. You
want to know how much the prices of the houses may vary from this average. What
measurement do you need?
(2 Marks)
A. standard deviation
B. interquartile range
C. variance
D. percentile
(b) To the nearest thousandth, what is the mean of the following data set? 0.003, 0.045, 0.58,
0.687, 1.25, 10.38, 11.252, 12.001
(2 Marks)
(c) To the nearest tenth, what is the median of the following data set? 18, 21, 17, 18, 16, 15.5,
12, 17, 10, 21, 17.
(2 Marks)
(d) Define a percentile.
(2 Marks)
(e) Which of the following is an example of a quantitative variable (also known as a numerical
variable) and why?
(2 Marks)
A. the colour of an automobile
B. a person's region of residence
C. a person's postal code
D. a person's height, recorded in centimetres
E. choices (C) and (D)
(f) From the scenario in (d) above, which variables are qualitative and why?
(6 Marks)
(g) You took a survey of 100 people and found that 60% of them like chocolate and 40% don't.
Which of the following results presentations gives the distribution of the "chocolate versus no
chocolate" variable?
(4 Marks)
3
|
|
4 Page 4 |
▲back to top |
A. a table of the results
B. a pie chart of the results
C. a bar graph of the results
D. a sentence describing the results
E. all of the above
QUESTION 4
[20 Marks]
(a) If the formula for a regression line is y= 9x +17. Describe the components of this line and the
interpretation thereof.
(5 Marks)
(b) State and describe 5 common data distribution patterns in statistics.
{10 Marks)
(c) Define correlation coefficient and state two known properties of this coefficient. (5 Marks)
QUESTION 5
(a) How would you best describe a research proposal?
[20 Marks]
(5 Marks)
(b) State four reasons why research proposals are written.
(4 Marks)
(c) Explain in 3 strong points the purpose of a good literature review.
{6 Marks)
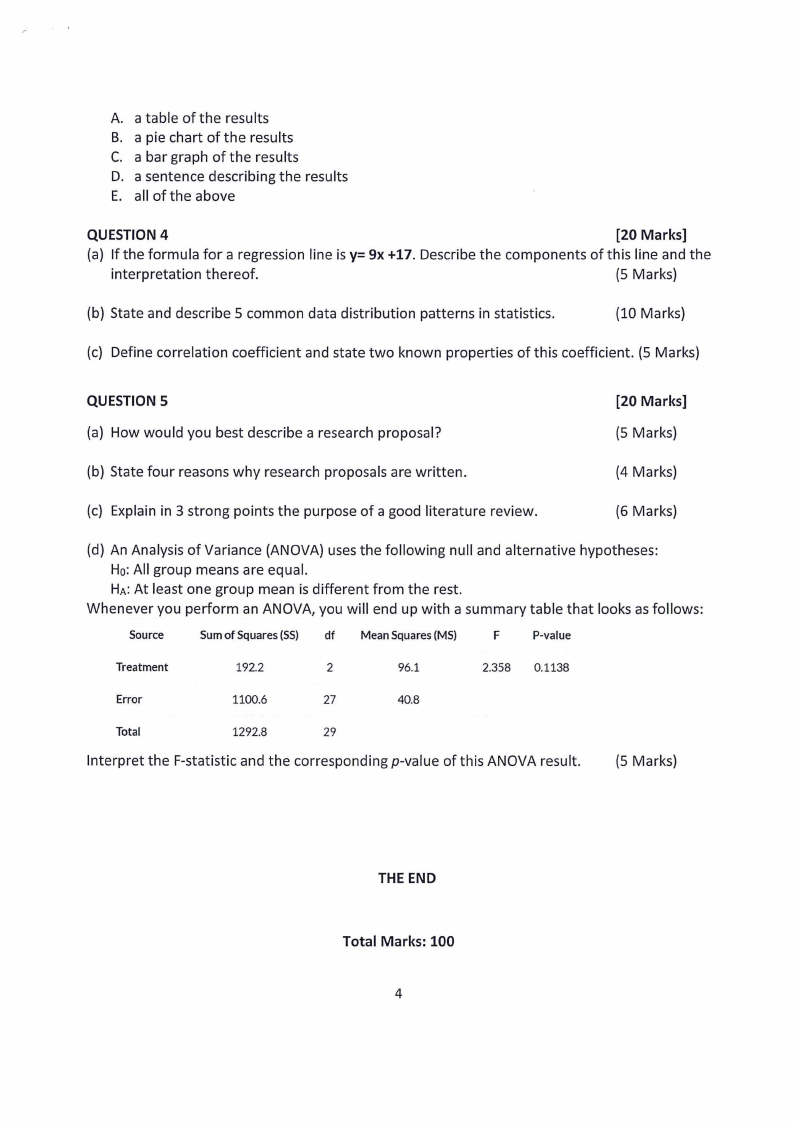
(d) An Analysis of Variance {ANOVA) uses the following null and alternative hypotheses:
Ho:All group means are equal.
HA:At least one group mean is different from the rest.
Whenever you perform an ANOVA, you will end up with a summary table that looks as follows:
Source
Sum of Squares (SS) df Mean Squares(MS)
F
P-value
Treatment
192.2
2
96.1
2.358 0.1138
Error
1100.6
27
40.8
Total
1292.8
29
Interpret the F-statistic and the corresponding p-value of this ANOVA result.
(5 Marks)
THE END
Total Marks: 100
4