


 |
MVA802S - MULTIVARIATE ANALYSIS - 1ST OPP - NOVEMBER 2024 |
|
|
1 Page 1 |
▲back to top |
nAml BIA UnlVERSITY
OF SCIEnCEAnDTECHnOLOGY
FacultyofHealthN, atural
ResourceasndApplied
Sciences
Schoool f Natural andApplied
Sciences
Departmentof Mathematics,
StatisticsandActuarialScience
13JacksonKaujeuaStreet
PrivateBag13388
Windhoek
NAMIBIA
T: +26461207 2913
E: msas@nust.na
W: www.nust.na
QUALIFICATION: Bachelor of Science Honours in Applied Statistics
QUALIFICATION CODE: 08BSHS
LEVEL: 8
COURSE CODE: MVA802S
COURSE NAME: MULTIVARIATE ANALYSIS
SESSION: NOVEMBER 2024
DURATION: 3 HOURS
PAPER: THEORY
MARKS: 100
EXAMINER
FIRST OPPORTUNITY EXAMINATION QUESTION PAPER
Dr D. B. GEMECHU
MODERATOR:
Prof L. PAZVAKAWAMBWA
INSTRUCTIONS
1. There are 6 questions, answer ALL the questions by showing all the necessary steps.
2. Write clearly and neatly.
3. Number the answers clearly.
4. Round your answers to at least four decimal places, if applicable.
PERMISSIBLE MATERIALS
1. Nonprogrammable scientific calculators with no cover.
THIS QUESTION PAPERCONSISTSOF 5 PAGES(Including this front page)
ATTACHMENTS
Two statistical distribution tables (z-and F-distribution tables)
|
|
2 Page 2 |
▲back to top |
Question 1 [12 Marks]
1.1. Define multivariate statistical analysis and state three objectives of multivariate analysis. [41
1.2. Consider a random vector y = (Y1 , Y2 , Y3 )' with mean vectorµ= (3, 2, 1)' and covariance
matrix I. The eigenvalues of l: are il 1 = 12,il 2 = 6, and il 3 = 2 and the corresponding
eigenvectors are
e1 = 11//..//33) ,ez = ( -21//....//66) ,e3 = ( 1/0../2)
( 1/./3
1/../6
1/../2
Compute the following based on the information provided.
1.2.1. III
[11
1.2.2. trace (L)
[ll
1.2.3. Var(e 1y)
[21
1.2.4. l:
[4]
Question 2 [24 Marks]
GD·m 2 Letx~N, (µ, I), where x -
µ-
and I - (},
p pz)
1 0.
01
2.1. Drive the conditional distribution of (x1 ,x 2 ) given x3 .
[8]
2.2. If we define a new random variable y = x1 + 3 x2 - 2 x3 and the value of p = 0.5, then:
2.2.1. derive the distribution of y and compute P(y < -2)
[8]
2.2.2. derive the joint distribution of x3 and y. Are they independently distributed? Provide
explanation for your answer.
[8]
Question 3 [10 Marks]
3. Let the observation vector be partitioned into two subsectors denoted by y and x, where y is p x
1 and xis q x 1. Assume that (~) ~Nq+p [ (::), (~:: ~::)]. Use this information to state and
prove the independency properties of multivariate normal distribution.
[10]
Page 1 of4
|
|
3 Page 3 |
▲back to top |
Question 4 (13 Marks]
4. Morphology is the branch of biology that deals with the form (structure) of living organisms. An
expert measures the length (in cm) and weight (in hundreds of grams) of 20 adult birds from the
same species, but from two different sub-species (10 birds in each sub-species). The data can be
seen in the following figure, where the points are marked differently to distinguish observations
from sub-species 1 and sub-species 2. From the multivariate data, we have the sample mean for
Variety 1 as y1 = (45.4, 8.01)' and for Variety 2 y2 = (43.0, 10.06)' and pooled sample
covari.ance mat ri.x, SP = (32._507583 22._005032)
Assuming that the observations are bivariate and follow multivariate normal
distributions N(µi, l:), for i = 1 and 2, Conduct a test if there is any significant difference
between the vector of expected mean measurements of the two species at 5% level of
significance. Your answer should include the following:
4.1. State the null and alternative hypothesis to be tested
(1]
4.2. State the test statistics to be used and its corresponding distribution
(21
4.3. State the decision (rejection) rule and compute the tabulated value using an appropriate
statistical table
(31
4.4. Compute the test statistics and write up your decision and conclusion
(71
Question 5 (25 Marks]
5. A veterinary scientist measured y1 = Wing length (in cm) and y2 = Back length (in cm) for a sample
= ( of n = 20 chickens. From this sample data we have sample mean vector y 4, 9), sample
(1 !!), = variance covariance matrix S
6
and the eigenvalue (il) and eigenvector (e) of S are
il1 = 68.315, e 1 = ( 00._29660545) ; il2 = 4.684, e2 = ( _00.9_2665054 )
Answer the following questions assuming that the sample were originated form a bivariate
normal N2 (µ, l:) with unknownµ and unknown l:.
5.1. Test the hypothesis H0 : µ = (8, 12)' vs H1 : µ =I=(8, 12)' at 5% level of significance.
Your solution should include the following:
5.1.1. State the test statistics to be used and its corresponding distribution
(11
5.1.2. State the decision (rejection) rule and compute the tabulated value using an
appropriate statistical table
(21
5.1.3. Compute the test statistics and write up your decision and conclusion
(71
5.2. Construct a 95% confidence ellipse forµ. Hint: Compute the major and minor axis of ellipse.
(81
5.3. Construct a 95%-T 2 interval for a linear combination µ1 - 0.5µ2
(71
Page 2 of4
|
|
4 Page 4 |
▲back to top |
Question 6 [16 Marks]
6. Heavy metals in river sediments are a significant concern due to their toxicological impacts on
aquatic ecosystems and human health. Understanding the distribution and concentration levels
of these metals across different rivers streams is essential for effective environmental
management. Victor et al. (2024) measured heavy metals [Iron (FE), nickel (Ni), zinc (Zn), copper
(Cu), manganese (Mn), and lead (Pd)] concentrations across three different river streams in
Namibia- upper, middle and lower. A principal component analysis (PCA) was performed on a
dataset the software output of the analysis of the data is given below. Answer the following
questions based on these results
6.1. Based on the correlation matrix provided, it the data suitable for PCA?
[21
6.2. Discuss and interpret Bartlett's Test of Sphericity.
[31
6.3. Test for sampling adequacy
[21
6.4. Show that the value of il.6 = 0.131
[21
6.5. What is the percentage of the total standardized variation attributed to the first principal
component?
[21
6.6. Using the results of the principal components analysis, draw a scree plot. How many principal
components do you recommend to retain based on the scree plot?
[3]
6.7. Give a formula for computing the scores of the first principal component. Give a brief
interpretation of the first principal component.
[21
######R-softwa re output#######
##correlation matrix
Fe Mn Ni
Pb
u Zn
Fe 1.000 0.608 0.486 0.318 0.458 0.819
Mn 0.608 1.000 0.328 0.368 0.471 0.418
Ni 0.486 0.328 1.000 -0.006 0.147 0.313
Pb 0.318 0.368 -0.006 1.000 0.527 0.300
u 0.458 0.471 0.147 0.527 1.000 0.363
Zn 0.819 0.418 0.313 0.300 0.363 1.000
### Bartlett's test for sphericity
$chisq
[1] 252.0737
$p.value
[1] 4.642919e-45
$df
[1] 15
Page 3 of 4
|
|
5 Page 5 |
▲back to top |
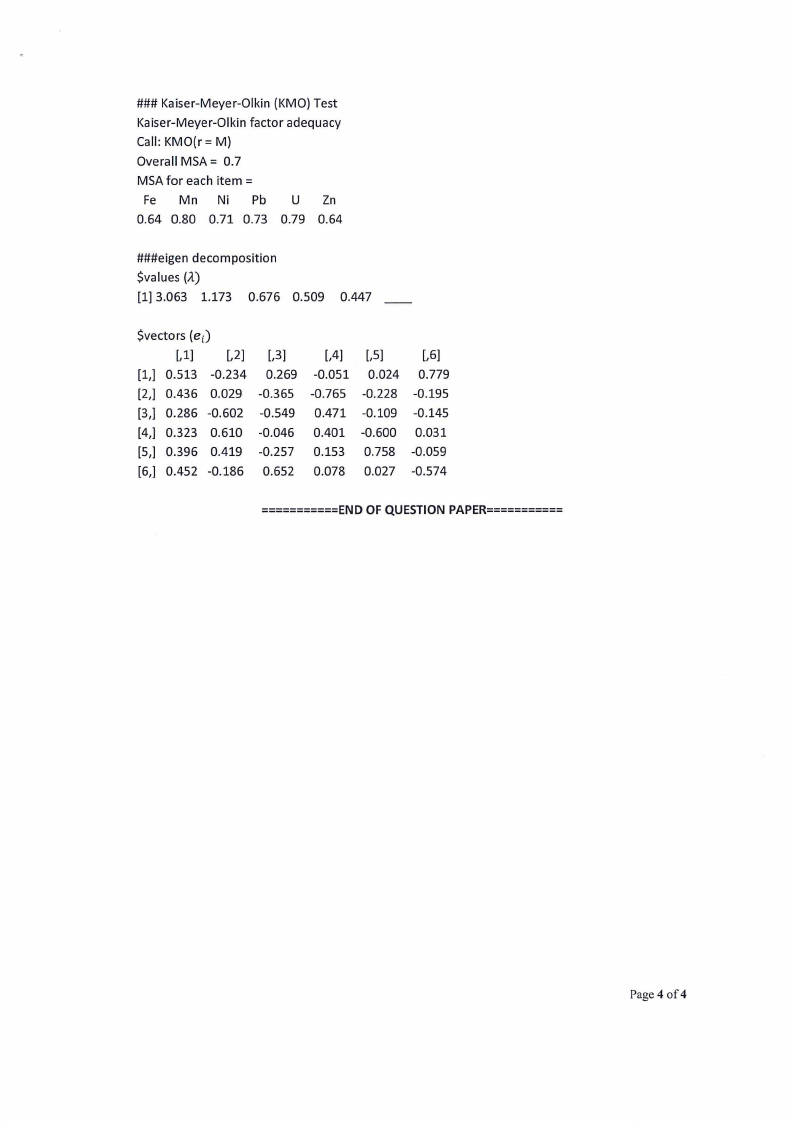
### Kaiser-Meyer-Olkin (KMO)Test
Kaiser-Meyer-Olkin factor adequacy
Call: KMO(r = M)
Overall MSA = 0.7
MSAfor each item =
Fe Mn Ni Pb U Zn
0.64 0.80 0.71 0.73 0.79 0.64
###eigen decomposition
$values (il)
[1] 3.063 1.173 0.676
0.509
0.447
$vectors (ea
[,1] [,2]
[l,] 0.513 -0.234
[2,] 0.436 0.029
[3,) 0.286 -0.602
[4,) 0.323 0.610
[S,) 0.396 0.419
[6,] 0.452 -0.186
[,3]
0.269
-0.365
-0.549
-0.046
-0.257
0.652
[,4]
-0.051
-0.765
0.471
0.401
0.153
0.078
[,SJ
0.024
-0.228
-0.109
-0.600
0.758
0.027
[,6)
0.779
-0.195
-0.145
0.031
-0.059
-0.574
===========END OF QUESTION PAPER===========
Page4of4
|
|
6 Page 6 |
▲back to top |
l!li[[~[[~~lilill[[[li[ll[llli[lilllllilillli[llli
l!llM-9 l!9_--[cili00oo- li~l0i0 ~-[i-M[r~l00io[~-li~M ll-l!_~[~llo0l0iN00 li00~llNll~[~l!_-l!_~[~l!_-l!_M[~llM[~l
0
0
0
0
0
0
0
0
0
0
0
0
0
0
0
0
0
0
0
0
0
0
0
0
0
0
0
0
0
0
0
l!li~9 [9~ll:llil!_~[~l!_~[~l!_b[~~~l!_~l!_~[~l!_~[~[~l!_~l!_i[~l!_~[~[~ll~[~ll~l
0
0
O OO OO OOO O OO OO OO OOOOOO OO OOO O O0
li~ lt[~~[~[~[~li~ l!li[ll[[~llli[~llli[[[[~llllllllllllllltllll[lilill
]~
0
N.
l!V[9o~)l!o9 _l!~o9 _l:ol:[O~l!O _IO~[~O
llg
OO
l!_l!~_~~=[~lt?,::
OOOOOOO
O
O
O
O
liil;l;g;[~l!_l!~_l!~_[~s:l!:_l~!_~
OO OO OOO O O0
1 ·l!lilililltllllilililllillllllilllililllillltlllllilllill
._____.
l!li90 li90lil90 ll0lll0 ~00li~0 l0[l0l 0
0
0
l0glll0gll0lll0 il0lll0 ll0[ll0 ll0lil0 ll0l
i;;g;
0
0
0
0
l0ili0 ll0lil0sl:l:0l
0
l!ll~9 [9~[9i;;;[~[~l!_:~:l!_~l!_~[N[:l!_~l!_~l!_~[~[~[~[~[~[~[~[~ll~ll~li:[~[~l!_:
0
0
0
0
0
0
0
0
0
0
0
0
0
0
0
0
0
0
0
0
0
0
0
0
0
0
0
0
0
0
0
l!ll3 li~[~[iN[;li~[~li~l!_~l[~[~l!_:l!_~ll~ll~[~l!_:l!_~l!_~[i~[~[~l!_~l!_~[~[~[~l!_~
0
0
0
0
0
0
0
0
0
0
0
0
0
0
0
0
0
0
0
0
0
0
0
0
0
0
0
0
0
0
0
l!llli[[[~~~[[~llllll[[[[[~[[[~[[[[li[li
|
|
7 Page 7 |
▲back to top |
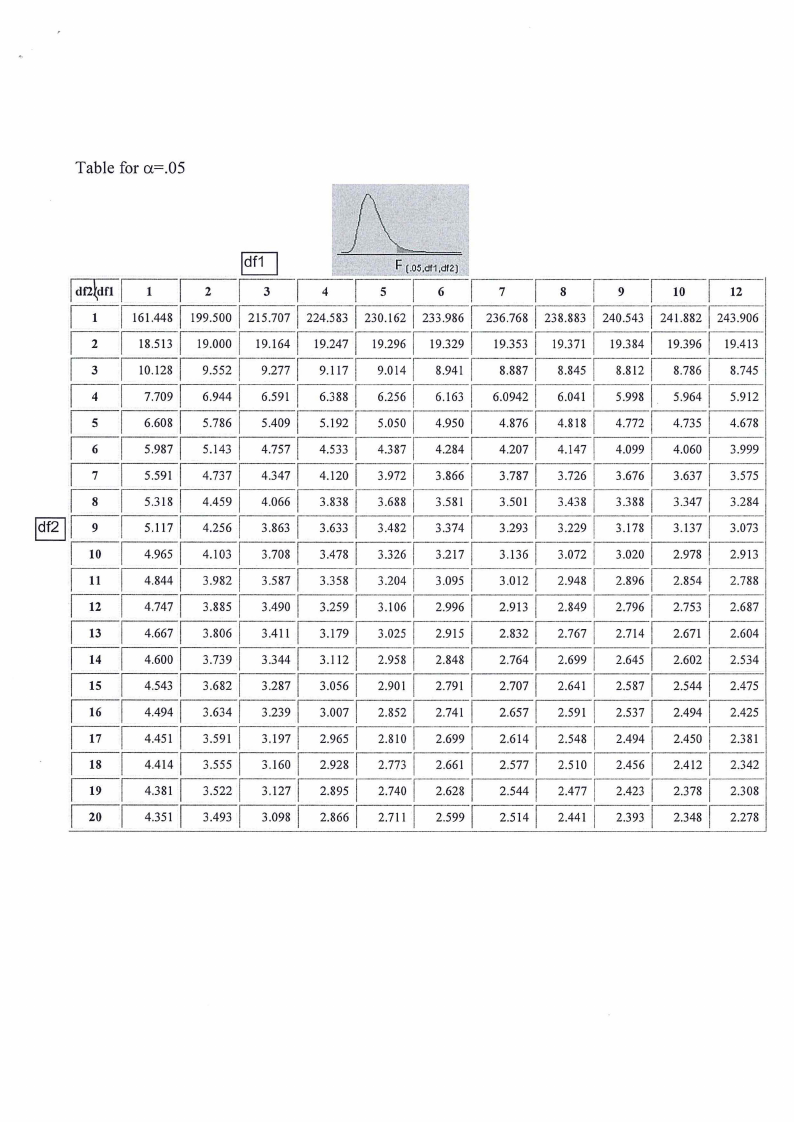
Table for a=.05
Idf2~dfl
1
2
3
4
5
6
F (.o5,c!1,1c!12J
1 I2
I 161.448 199.500
I 18.513 19.000
I 10.128 9.552
3 I4
215.7071 224.583
I 19.164 19.247
9.2771 9.117
5 I 6 I 7 I 8 I 9 I 10 I 12
I I I I 230.162 233.986 236.768 238.883 240.543 1 241.882 243.906
I I 19.296 19.3291 19.353 19.371 19.3841 19.3961 19.413
9.014
I I 8.941
8.8871 8.845
8.8121 8.7861 8.745
7.7091
6.6081
5.987
6.944
5.786
5.143
I 6.591 6.388
6.256
5.4091
4.757
5.192 5.050
I 4.533
4.387
I 6.163 6.09421
I 4.950
4.876
4.2841 4.207
6.041 I
4.818 I
4.147
5.998 1.
4.7721
4.099
5.9641
I 4.735
I 4.060
5.912
4.678
3.999
7
5.591
4.737
4.347
4.120
3.972
3.866
3.787 3.726 3.676 3.6371 3.575
8
5.318 4.459 4.066 3.838 3.688 3.581
3.501 3.438 3.388 3.3471 3.284
9
5.117 4.256 3.863 3.633 3.482 3.374
I I 10
4.965
4.103 1 3.708
3.478
3.326 1 3.217
I 11 I 4.844
I 12
4.747
13
4.667
3.982 I
I 3.885
3.806 I
3.587
3.490 1
I 3.411
3.358
3.259
3.179
3.2041 3.095
3.106 I 2.996
3.025 1 2.915
14
4.600
I I 3.739 3.3441 3.112
2.958 I 2.848
15
I 4.543 3.6821 3.2871 3.0561 2.901 1 2.791
3.293 3.229
3.136 3.072
3.012 2.948
I 2.913 2.849
2.8321 2.767
2.7641 2.699
2.7071 2.641
3.178
3.020
2.896
2.796
2.714
2.645
2.5871
3.1371 3.073
2.9781 2.913
2.8541
I 2.753
I 2.671
2.788
2.687
2.604
2.6021 2.534
2.5441 2.475
16
17
I 18
I 19
I 20
4.4941
4.451 1
4.414 I
4.381 I
4.351 I
3.6341
3.591 I
3.555 I
3.522 I
3.493 I
3.2391
3.197 I
3.160 I
3.121 I
3.098 I
3.0071
2.965 I
2.928 I
2.895 1
2.8661
2.8521
2.810 1
2.773 I
2.740 I
2.111 1
2.741
2.6991
2.661 I
2.628 I
2.5991
2.6571
2.6141
2.5771
2.5441
2.5141
2.591 1
2.548 I
2.510 I
2.477 I
2.441 I
2.5371
I 2.494
2.456 I
2.423 I
2.393 I
2.4941
2.450 I
2.412 I
2.378 1
2.348 I
2.425
2.381
2.342
2.308
2.278