


 |
DSA821S - DATA SCIENCE AND ANALYTICS - 2ND OPP - JAN 2025 |
|
|
1 Page 1 |
▲back to top |
nAmI BI AunIVER s ITY
OF SCIEnCE Ano TECHnOLOGY
FACULTY OF COMPUTING AND INFORMATICS
DEPARTMENT OF INFORMATICS
QUALIFICATION: Bachelor of Informatics Honours
QUALIFICATION CODE: 08BIHW, 08BIFB
COURSE:Data Science and Analytics
DATE: 2024/2025
DURATION: 2 Hours
COURSELEVEL: NQF LEVEL8
COURSECODE: DSA821S
SESSION: 1
MARKS: 60
EXAMINER(S):
SUPPLEMENTARY/SECOND OPPORTUNITY
EXAMINATION QUESTION PAPER
MR. SEBASTIAN MUKUMBIRA
MODERATOR (S):
MS. EMILIA SHIKEENGA
THIS EXAMINATION PAPERCONSISTSOF 5 PAGES
(INCLUDING THIS FRONT PAGE)
Instructions for the students
1. There are four Sections in this paper Section 1, Section 2, Section 3 and Section 4.
2. Answer ALL the questions in ALL Sections.
3. Write clearly and neatly.
4. Number the answers clearly.
5. Non-programmable calculators may be used.
|
|
2 Page 2 |
▲back to top |
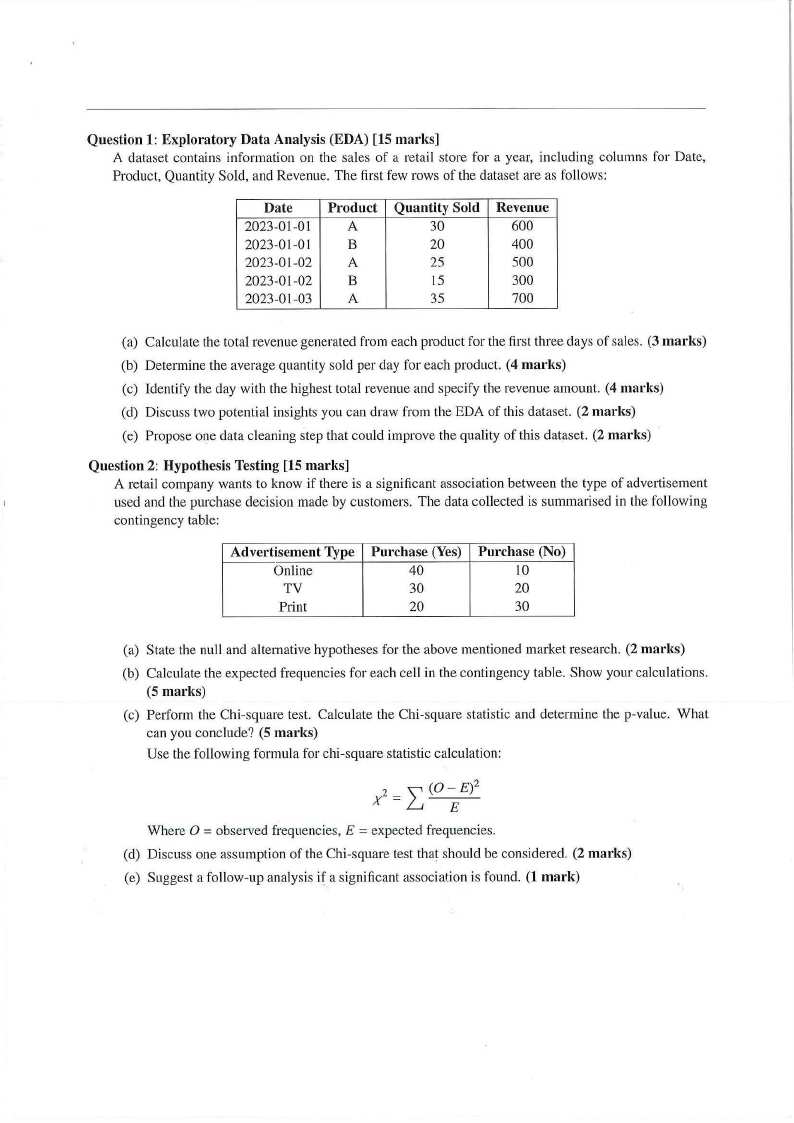
Question 1: Exploratory Data Analysis (EDA) [15 marks]
A dataset contains infom1ation on the sales of a retail store for a year, including columns for Date,
Product, Quantity Sold, and Revenue. The first few rows of the dataset are as follows:
Date
2023-01-01
2023-01-0 I
2023-01-02
2023-01-02
2023-01-03
Product
A
B
A
B
A
Quantity Sold
30
20
25
15
35
Revenue
600
400
500
300
700
(a) Calculate the total revenue generated from each product for the first three days of sales. (3 marks)
(b) Determine the average quantity sold per day for each product. (4 marks)
(c) Identify the day with the highest total revenue and specify the revenue amount. (4 marks)
(d) Discuss two potential insights you can draw from the EDA of this dataset. (2 marks)
(e) Propose one data cleaning step that could improve the quality of this dataset. (2 marks)
Question 2: Hypothesis Testing [15 marks]
A retail company wants to know if there is a significant association between the type of advertisement
used and the purchase decision made by customers. The data collected is summarised in the following
contingency table:
Advertisement Type
Online
TV
Print
Purchase (Yes)
40
30
20
Purchase (No)
10
20
30
(a) State the null and alternative hypotheses for the above mentioned market research. (2 marks)
(b) Calculate the expected frequencies for each cell in the contingency table. Show your calculations.
(5 marks)
(c) Perform the Chi-square test. Calculate the Chi-square statistic and determine the p-value. What
can you conclude? (5 marks)
Use the following formula for chi-square statistic calculation:
Where O = observed frequencies, E = expected frequencies.
(d) Discuss one assumption of the Chi-square test tha~ should be considered. (2 marks)
(e) Suggest a follow-up analysis if a significant association is found. (1 mark)
|
|
3 Page 3 |
▲back to top |
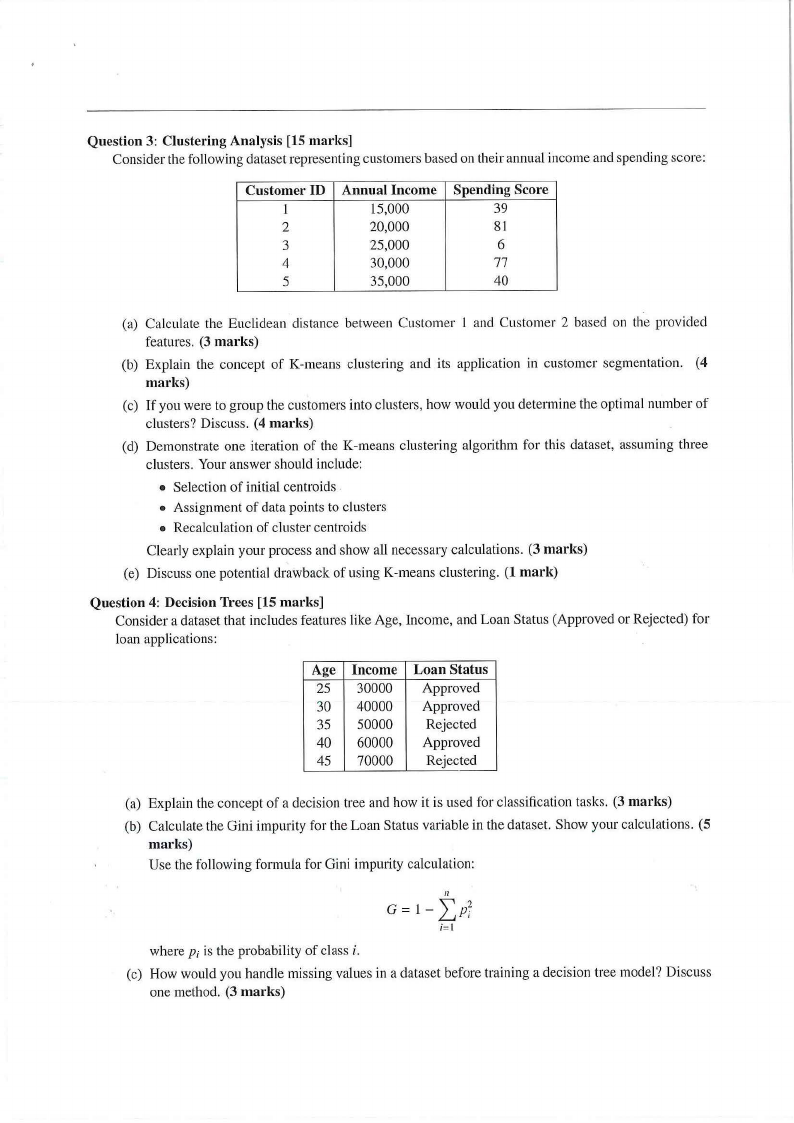
Question 3: Clustering Analysis (15 marks]
Consider the following dataset representing customers based on their annua1 income and spending score:
Customer ID
1
2
3
4
5
Annual Income
15,000
20,000
25,000
30,000
35,000
Spending Score
39
81
6
77
40
(a) Calculate the Euclidean distance between Customer I and Customer 2 based on the provided
features. (3 marks)
(b) Explain the concept of K-means clustering and its application in customer segmentation. (4
marks)
(c) If you were to group the customers into clusters, how wou1d you detennine the optimal number of
clusters? Discuss. (4 marks)
(d) Demonstrate one iteration of the K-means clustering algorithm for this dataset, assuming three
clusters. Your answer should include:
• Selection of initia1 centroids .
• Assignment of data points to clusters
• Recalculation of cluster centroids
Clearly explain your process and show all necessary calculations. (3 marks)
(e) Discuss one potential drawback of using K-means clustering. (1 mark)
Question 4: Decision Trees [15 marks]
Consider a dataset that includes features like Age, Income, and Loan Status (Approved or Rejected) for
loan applications:
Age Income Loan Status
25 30000 Approved
30 40000 Approved
35 50000 Rejected
40 60000 Approved
45 70000 Rejected
(a) Explain the concept of a decision tree and how it is used for classification tasks. (3 marks)
(b) Calculate the Gini impurity for the Loan Status variable in the dataset. Show your calculations. (5
marks)
Use the following formula for Gini impmity ca1cu1ation:
11
G = 1 - L;P7
i=l
where p; is the probability of class i.
(c) How would you handle missing va1ues in a dataset before training a decision tree model? Discuss
one method. (3 marks)
|
|
4 Page 4 |
▲back to top |
(d) Describe how overfitting can occur in decision trees and propose one technique to mitigate it. (3
marks)
(e) Provide an example of a real-world application where decision trees could be effectively used. (1
mark)
|
|
5 Page 5 |
▲back to top |
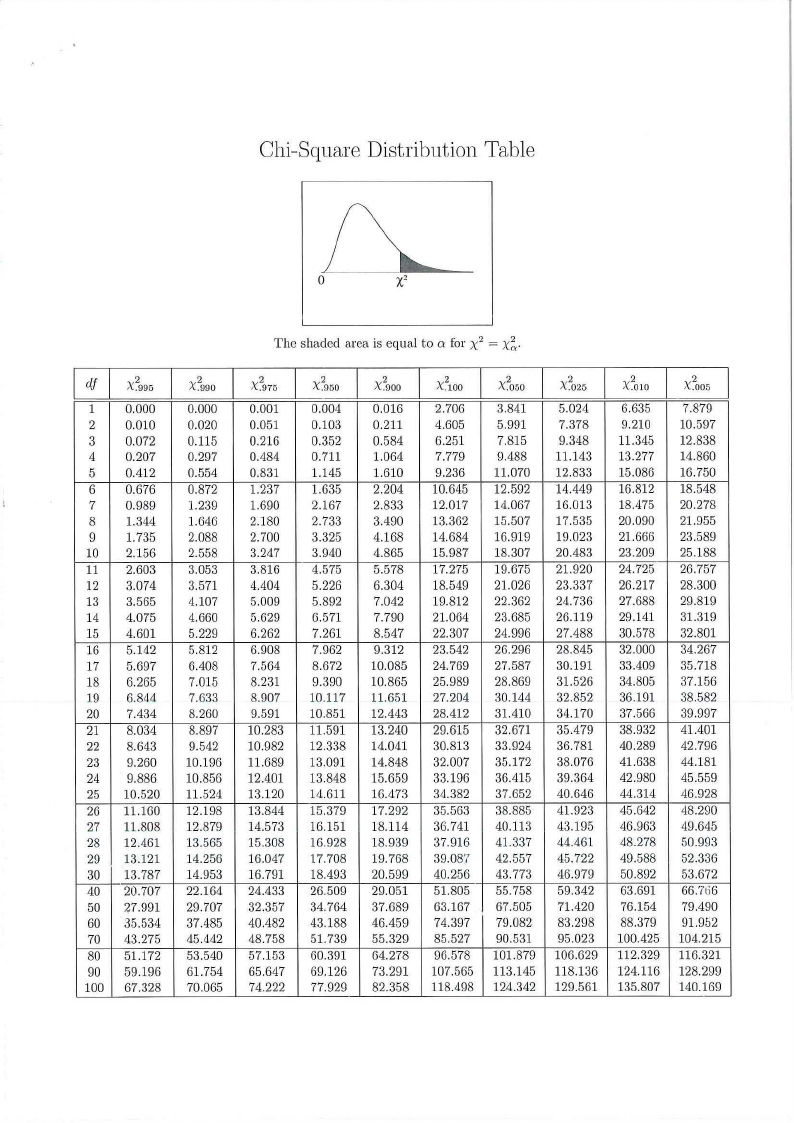
Chi-Square Distribution Table
The shaded area is equal to a: for x2 = x~-
df
2
X.995
1 0.000
2 0.010
3 0.072
4 0.207
5 0.412
6 0.676
7 0.989
8 1.344
9 1.735
10 2.156
11 2.603
12 3.074
13 3.565
14 4.075
15 4.601
16 5.142
17 5.697
18 6.265
19 6.844
20 7.434
21 8.034
22 8.643
23 9.260
24 9.886
25 10.520
26 11.160
27 11.808
28 12.461
29 13.121
30 13.787
40 20.707
50 27.991
60 35.534
70 43.275
80 51.172
90 59.196
100 67.328
X~ggo
0.000
0.020
0.115
0.297
0.554
0.872
1.239
1.646
2.088
2.558
3.053
3.571
4.107
4.660
5.229
5.812
6.408
7.015
7.633
8.260
8.897
9.542
10.196
10.856
11.524
12.198
12.879
13.565
14.256
14.953
22.164
29.707
37.485
45.442
53.540
61.754
70.065
X~975
0.001
0.051
0.216
0.484
0.831
1.237
1.690
2.180
2.700
3.247
3.816
4.404
5.009
5.629
6.262
6.908
7.564
8.231
8.907
9.591
10.283
10.982
11.689
12.401
13.120
13.844
14.573
15.308
16.047
16.791
24.433
32.357
40.482
48.758
57.153
65.647
74.222
X~950
0.004
0.103
0.352
0.711
1.145
1.635
2.167
2.733
3.325
3.940
4.575
5.226
5.892
6.571
7.261
7.962
8.672
9.390
10.117
10.851
11.591
12.338
13.091
13.848
14.611
15.379
16.151
16.928
17.708
18.493
26.509
34.764
43.188
51.739
60.391
69.126
77.929
X~goo
0.016
0.211
0.584
1.064
1.610
2.204
2.833
3.490
4.168
4.865
5.578
6.304
7.042
7.790
8.547
9.312
10.085
10.865
11.651
12.443
13.240
14.041
14.848
15.659
16.473
17.292
18.114
18.939
19.768
20.599
29.051
37.689
46.459
55.329
64.278
73.291
82.358
X~100
2.706
4.605
6.251
7.779
9.236
10.645
12.017
13.362
14.684
15.987
17.275
18.549
19.812
21.064
22.307
23.542
24.769
25.989
27.204
28.412
29.615
30.813
32.007
33.196
34.382
35.563
36.741
37.916
39.087
40.256
51.805
63.167
74.397
85.527
96.578
107.565
118.498
X~oso
3.841
5.991
7.815
9.488
11.070
12.592
14.067
15.507
16.919
18.307
19.675
21.026
22.362
23.685
24.996
26.296
27.587
28.869
30.14•1
31.410
32.671
33.924
35.172
36.415
37.652
38.885
40.113
41.337
42.557
43.773
55.758
67.505
79.082
90.531
101.879
113.145
124.342
X~o2s
5.024
7.378
9.348
11.143
12.833
14.449
16.013
17.535
19.023
20.483
21.920
23.337
24.736
26.119
27.488
28.845
30.191
31.526
32.852
34.170
35.479
36.781
38.076
39.364
40.646
41.923
43.195
44.461
45.722
46.979
59.342
71.420
83.298
95.023
106.629
118.136
129.561
2
X 010
6.635
9.210
11.345
13.277
15.086
16.812
18.475
20.090
21.666
23.209
24.725
26.217
27.688
29.141
30.578
32.000
33.409
34.805
36.191
37.566
38.932
40.289
41.638
42.980
44.314
45.642
46.963
48.278
49.588
50.892
63.691
76.154
88.379
100.425
112.329
124.116
135.807
I X~oos
7.879
10.597
12.838
14.860
16.750
18.548
20.278
21.955
23.589
25.188
26.757
28.300
29.819
31.319
32.801
34.267
35.718
37.156
38.582
39.997
41.401
42.796
44.181
45.559
46.928
48.290
49.645
50.993
52.336
53.672
66.766
79.490
91.952
104.215
116.321
128.299
140.169