


 |
MVA802S - MULTIVARIATE ANALYSIS - 2ND OPP - JAN 2023 |
|
|
1 Page 1 |
▲back to top |
nAmlBIA UnlVERSITY
OF SCIEn CE Ano TECHn OLOGY
FACULTY OF HEALTH, APPLIED SCIENCES AND NATURAL RESOURCES
DEPARTMENT OF MATHEMATICS AND STATISTICS
QUALIFICATION: Bachelor of Science Honours in Applied Statistics
QUALIFICATION CODE: 0SBSHS
LEVEL: 8
COURSECODE: MVA802S
COURSENAME: MULTIVARIATE ANALYSIS
SESSION:JANUARY 2023
DURATION: 3 HOURS
PAPER:THEORY
MARKS: 100
SUPPLEMENTARY/ SECOND OPPORTUNITY EXAMINATION QUESTION PAPER
EXAMINER
Dr D. 8. GEMECHU
MODERATOR:
Prof L. PAZVAKAWAMBWA
INSTRUCTIONS
1. There are 8 questions, answer ALL the questions by showing all
the necessary steps.
2. Write clearly and neatly.
3. Number the answers clearly.
4. Round your answers to at least four decimal places, if applicable.
PERMISSIBLE MATERIALS
1. Non-programmable scientific calculator
THIS QUESTION PAPER CONSISTS OF 4 PAGES (Including this front page)
ATTACHMENTS
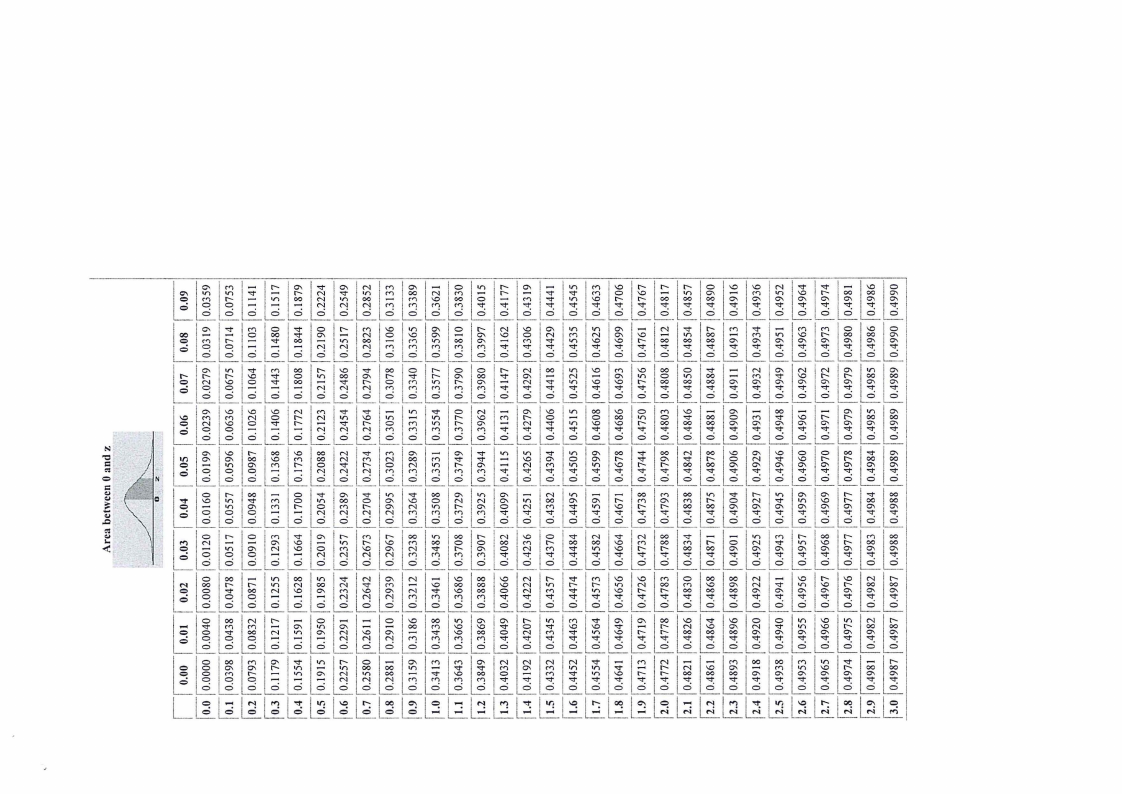
Two statistical distribution tables (z-and F-distribution tables)
|
|
2 Page 2 |
▲back to top |
Question 1 (8 marks)
1.1. State three features (properties) of Multivariate normal distribution.
[3]
1.2. Briefly explain Principal components analysis (PCA)and state three assumptions of PCA[2+3)
Question 2 (9 marks)
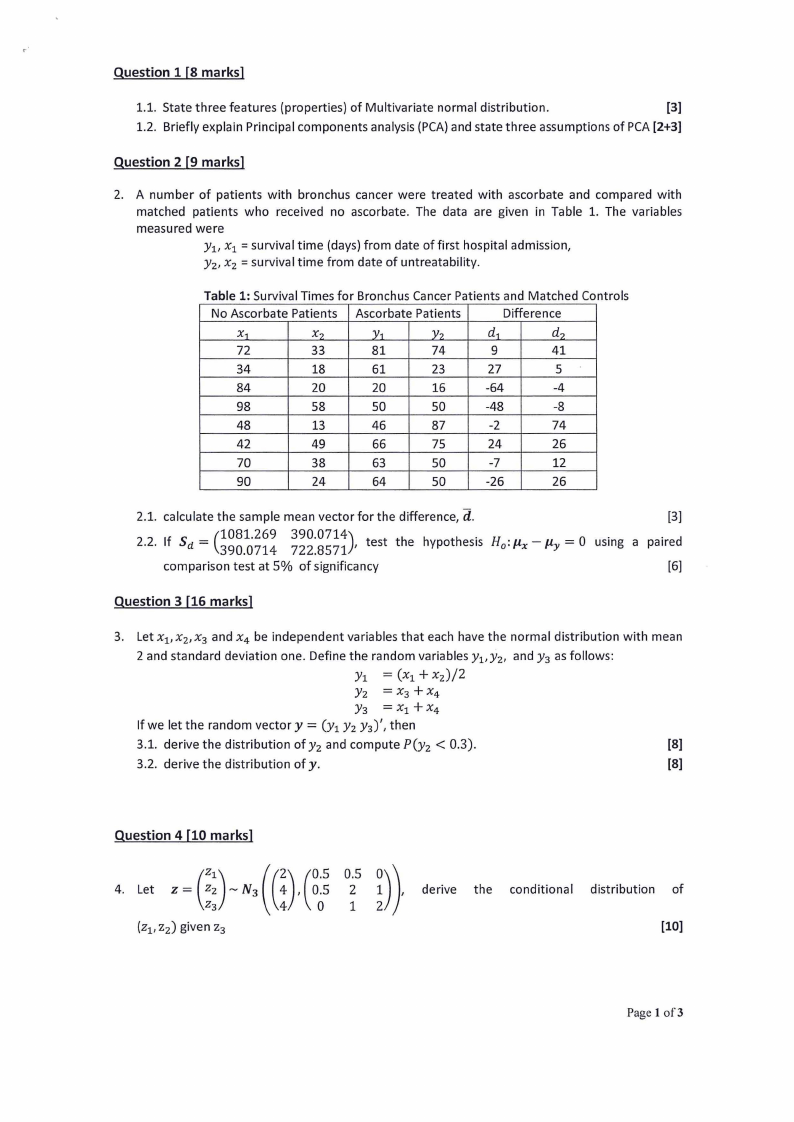
2. A number of patients with bronchus cancer were treated with ascorbate and compared with
matched patients who received no ascorbate. The data are given in Table 1. The variables
measured were
Yv x1 = survival time (days) from date of first hospital admission,
y 2, x2 = survival time from date of untreatability.
Table 1: Survival Times for Bronchus Cancer Patients and Matched Controls
No Ascorbate Patients Ascorbate Patients
Difference
X1
X?
Y1
Y?
d1
d?
72
33
81
74
9
41
34
18
61
23
27
5
84
20
20
16
-64
-4
98
58
50
50
-48
-8
48
13
46
87
-2
74
42
49
66
75
24
26
70
38
63
50
-7
12
90
24
64
50
-26
26
2.1. calculate the sample mean vector for the difference, d.
[3]
2.2. If Sd = ( 3190081_0.276194 = 379202._08751741) , test the hypothesis H0 : µx - µY 0 using a paired
comparison test at 5% of significancy
[6]
Question 3 (16 marks)
3. Let x1, x2, x 3 and x4 be independent variables that each have the normal distribution with mean
2 and standard deviation one. Define the random variables y1 , y2 , and y 3 as follows:
Y1 = (x1 + Xz)/2
= Yz
+ X3 X4
= Y3
+ X1 X4
= If we let the random vector y (y1 y2 y3 )', then
3.1. derive the distribution of y2 and compute P(y 2 < 0.3).
[8]
3.2. derive the distribution of y.
[8]
Question 4 (10 marks)
4. Let
0.5
2
derive the conditional distribution of
1
[10)
Page I of3
|
|
3 Page 3 |
▲back to top |
Question 5 [11 marks]
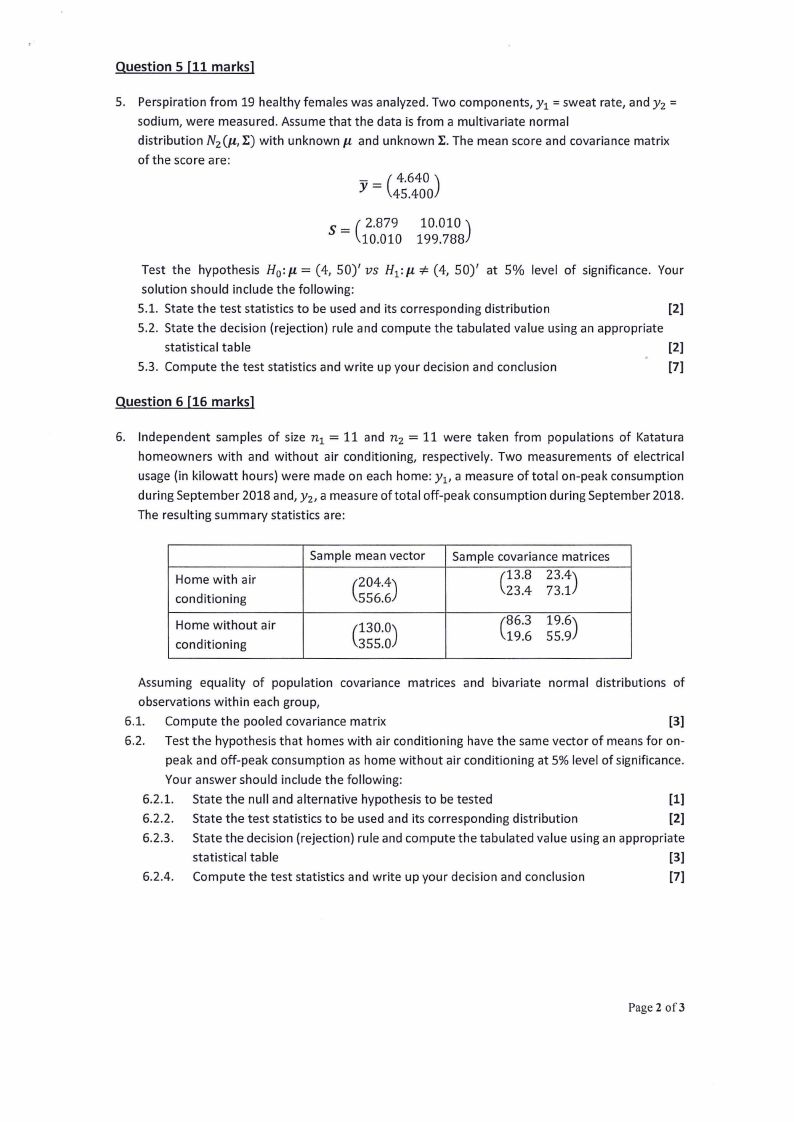
5. Perspiration from 19 healthy females was analyzed. Two components, y1 =sweat rate, and y2 =
sodium, were measured. Assume that the data is from a multivariate normal
distribution N2 (µ, l:) with unknownµ and unknown l:. The mean score and covariance matrix
ofthe score are:
- = ( 4.640)
y 45.400
S = ( 2.879 10.010)
10.010 199.788
* Test the hypothesis H0 :µ = (4, 50)' vs H1 :µ (4, 50)' at 5% level of significance. Your
solution should include the following:
5.1. State the test statistics to be used and its corresponding distribution
[2]
5.2. State the decision (rejection) rule and compute the tabulated value using an appropriate
statistical table
[2]
5.3. Compute the test statistics and write up your decision and conclusion
[7)
Question 6 [16 marks]
6. Independent samples of size n 1 = 11 and n2 = 11 were taken from populations of Katatura
homeowners with and without air conditioning, respectively. Two measurements of electrical
usage (in kilowatt hours) were made on each home: y1, a measure of total on-peak consumption
during September 2018 and, y2 , a measure of total off-peak consumption during September 2018.
The resulting summary statistics are:
Home with air
conditioning
Home without air
conditioning
Sample mean vector
(204.4)
556.6
(130.0)
355.0
Sample covariance matrices
(13.8 23.4)
23.4 73.1
(86.3 19.6)
19.6 55.9
Assuming equality of population covariance matrices and bivariate normal distributions of
observations within each group,
6.1. Compute the pooled covariance matrix
[3]
6.2. Test the hypothesis that homes with air conditioning have the same vector of means for on-
peak and off-peak consumption as home without air conditioning at 5% level of significance.
Your answer should include the following:
6.2.1. State the null and alternative hypothesis to be tested
[1]
6.2.2. State the test statistics to be used and its corresponding distribution
[2]
6.2.3. State the decision (rejection) rule and compute the tabulated value using an appropriate
statistical table
[3]
6.2.4. Compute the test statistics and write up your decision and conclusion
[7)
Page 2 of3
|
|
4 Page 4 |
▲back to top |
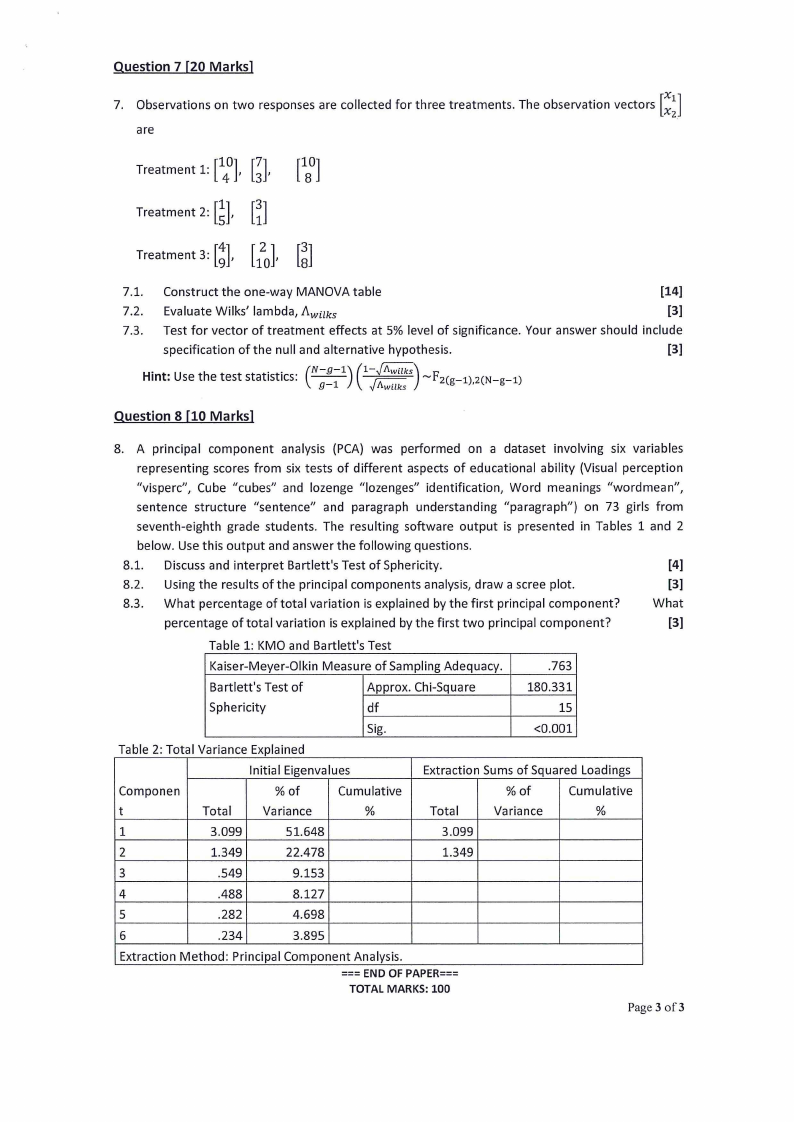
Question 7 [20 Marks]
7. Observations on two responses are collected for three treatments. The observation vectors [~~]
are
°],Gl Treatment
1:
[
1
4
[i] Treatment 2: [~],
ol [!], Treatment 3:
2
[1
7.1. Construct the one-way MANOVA table
[14]
7.2. Evaluate Wilks' lambda, Awilks
[3]
7.3. Test for vector of treatment effects at 5% level of significance. Your answer should include
specification of the null and alternative hypothesis.
[3]
(-N----g;;-=1-);- Hint: Use the test statistics:
(1-~JA) wuks
~F2(g-1),2(N-g-1)
Question 8 [10 Marks]
8. A principal component analysis (PCA) was performed on a dataset involving six variables
representing scores from six tests of different aspects of educational ability (Visual perception
"visperc", Cube "cubes" and lozenge "lozenges" identification, Word meanings "wordmean",
sentence structure "sentence" and paragraph understanding "paragraph") on 73 girls from
seventh-eighth grade students. The resulting software output is presented in Tables 1 and 2
below. Use this output and answer the following questions.
8.1. Discuss and interpret Bartlett's Test of Sphericity.
[4]
8.2. Using the results ofthe principal components analysis, draw a scree plot.
[3]
8.3. What percentage of total variation is explained by the first principal component?
What
percentage oftotal variation is explained by the first two principal component?
[3]
Table 1: KMO and Bartlett's Test
Kaiser-Meyer-Olkin Measure of Sampling Adequacy.
.763
Bartlett's Test of
Approx. Chi-Square
180.331
Sphericity
df
15
Sig.
<0.001
Table 2: Total Variance Explained
Initial Eigenvalues
Extraction Sums of Squared Loadings
Componen
t
Total
% of
Variance
Cumulative
%
Total
%of
Variance
Cumulative
%
1
3.099
51.648
3.099
2
1.349
22.478
1.349
3
.549
9.153
4
.488
8.127
5
.282
4.698
6
.234
3.895
Extraction Method: Principal Component Analysis.
===END OF PAPER===
TOTAL MARKS: 100
Page 3 of3
|
|
5 Page 5 |
▲back to top |
V')
V')
V
-
r- N V 1n
M
--: -: 0-0: N
00 -
0
0
0
0
0
0
0
0
0
00 N
M
0
0
M-
00 0
0
0
r- -
-
M
Vv
V
M
O
\\0
0
0
0
0
0
0
0
-
O'\\ -
00 00 00 0-
0
0
0
0
M
V"I
\\0
0- 0- 0-
0
0
0
C- 00 00 O'\\
0- 0- 0- 0-
0
0
0
0
l!lil~i ltlili~lilililililililillltlllilllililililllllilllilllil -
-
0
M
ci
I llii:llii[~~lll!_li:[ll[:i~Il~[lili[II~li[lllllil:lllii:llllil:llii:llilllii:!lli~lt '--lN!
0
00 v
0-
-
V 00 -
-: -: -:
l!0 _:[vv:
ll:[: O
00 -
N -
O
0- -
0-
N N 0
M
0-
00 -
M
00 0- -
MV
N
v ~li~vooll:l!_oov lvio[~ ll: 00 0-
0
M
l!_:[: 0- 0- - L'0N:-:_li: -
N
1
-
:
0-
-
00 -
M
00 00 0-
00 00 00 0- 0- 0- 0- 0- 0- 0- 0-
ll: vll: ll~ll: l!_I:: I: O
00 -
M
00 00
00 00 00 0- 0- 0- 0- 0- 0- 0- 0-
6 6 ci ci ci 6 6 6 6 6 6 6 6 6 6 6 6 6 6 6 6 6 6 6 6 6 [ 6 6 6
°t
..
l! lil!_ll[lililllil[lili[[lil!_~l!_l!_li[li[ll[lill[lil [I°' 0
0
0
0
0
0
0
0
0
0
0
0
0
0
0
0
0
0
0
0
0
0
0
0
0
0
0
0
0
0
[°' [°' li~ li~ [<~ li- l!n lloo liv[v llv l!_oliv llolol°' li°' l!_[~ li°' li°' 0
-
• ci
I 0-
M
-:
[<-:'">0
llvN
l!0_NN li";;
I 0- -
N M ;g
I l!_l~!_[~ liN liN 00 00 0- 0- 0- 0- 0- 0- 0- 0-
C
N
0
-
l!li:li: li~ li: li: li:li:li: li:li: li: li: li: ci
lio[: [: ll: ll: lt: ll: V
0-
M
M
-:
O
-:
l!_: I: N IN: 00 0
0 1I~:M
0-
0
0- N
<': <':
0-
0-
0
L:N::_li:
00
M
<':
0-
V
0-
lio ll: ll: llo ll:llo M 0- M
N 0
V
00 00
00 00 0-
0-
0-
0-
0-
0-
0-
0-
<
O O O O O OL._<::_ 0
0
0
0
0
0
0
0
0
0
0
0
0
0
0
0
0
0
0
0
0
0
0
0
N
-
-
0-
-
0
-
V')
C'\\ N
\\0
0
l!lllili[ll[~~I[llrl!,_l~Illl lilllililllillllrll,illlillll ci
-: -:
ff')
I~ \\0
C'\\
M
N
00
V
0r-
<': <':
0
00 M
I~ C\\
0
f'i
<': N
00 00
M 00 M
0
N
V
V"I
\\.0
t-
t-
00 00 C'\\ C\\
V
V
00 00
O'\\
O'\\
C'\\
O'\\
O'\\ O'\\
li;[;[; l!_[;~~; l!_~ li;li;li;li:li:li; li: li; I l!_~~; ll; l!_; l!_; l!_; ll; [; 0cNi 0
v 00 N
0- M
-: -: -:
0- N v
00 O N M V
l!_[:; [: l!_l;!_; ll; ll~ll; 00 00 00 0- 0- 0- 0- 0- 0- 0-
~l!l0l;llv;li0;0li;Nlt:li;[0-:l:Nli;li;li0-;l!-_;lvi;ll;ll0:0lI;0 ll;Nll:lMl;lvl:li;li;ll:li:li:l0!0:li00;ll:00li;0l- l:l0-l; 0- 0- 0- 0- 0-
0
0
0
0
0
0
0
0
0
0
0
0
0
0
0
0
0
0
0
0
0
0
0
0
0
0
0
0
0
0
0
l!llllltlill~l!_[[li[! l!!_l!ll!ililllil!lillli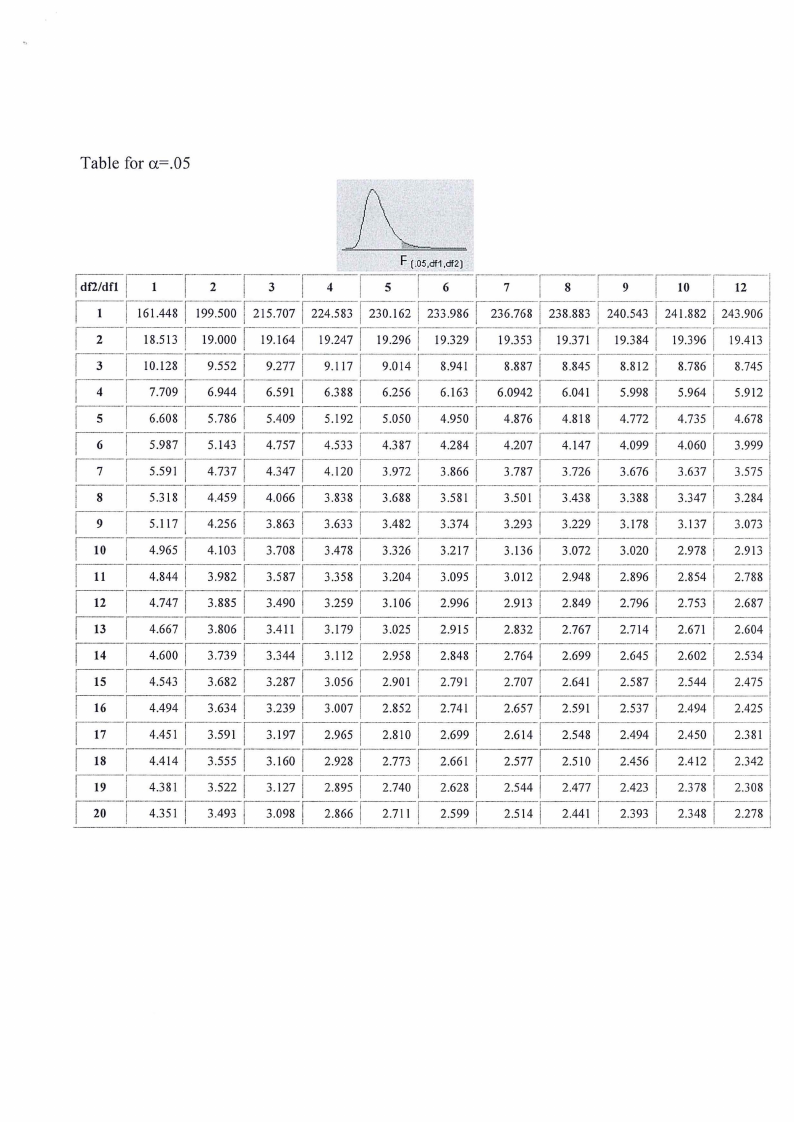
Table for a=.05
j\\__
Idf2/dfl
I1
I2
I3
I4
I5
F !.o5,df1,df2l
1 I2 I3 I4
I I 161.448 199.500 215.7071 224.583
I I 18.513 19.000 19.164 19.247
I 10.128 9.552
9.2771 9.117
7.7091 6.944
I 6.591 6.388
I 6.608
5.786
I 5.409
5.192
5 I 6 I 7 I 8 I 9 I 10 I 12
I I I I 230.1621 233.986 236.768 238.883 240.543 241.8821 243.906
I I I 19.296 19.3291 19.353 19.371 19.3841 19.3961 19.413
I I I 9.0141 8.941
8.8871 8.845
8.812
8.7861 8.745
I 6.2561 6.163 6.09421 6.041
I 5.998 5.9641 5.912
I I 5.050 4.950
4.8761 4.818
I 4.7721 4.735 4.678
I6
I7
I8
I9
I 10
11
5.9871
5.591 I
I 5.318
I 5.117
4.965
4.844
5.143
4.737
4.459
4.256
I 4.103
3.9821
4.7571
4.3471
4.0661
I 3.863
I 3.708
3.5871
4.533
4.120
3.838
3.633
3.478
3.358 1
4.3871
3.9721
3.6881
3.482 1
I 3.326
3.2041
4.2841
3.8661
3.581 I
3.3741
3.2171
I 3.095
4.2071 4.147 4.099
3.7871
I 3.501
I 3.293
3.726
3.438
3.229
3.676
3.388
3.178
3.136 3.072 3.020
3.012 2.948 1 2.896
4.060
3.637
3.347
3.137
2.978
2.854
3.999
3.575
3.284
3.073
2.913
2.788
12
4.747
I I 3.885
I 3.490 3.2591 3.106
2.9961
2.913
2.8491 2.796
2.753
2.687
I 13
4.667
I 14
4.600
I 15
4.543
I 16
4.494
I 17
4.451
I 18
4.414
I 19
4.381
I 20
4.351
3.8061
3.7391
3.6821
3.6341
I 3.591
I 3.555
I 3.522
I 3.493
I 3.411
3.3441
3.287
3.239
3.197
3.160
3.127
3.098
3.1791
I 3.112
3.0561
3.0071
2.965 I
2.9281
2.8951
2.8661
3.025 1
2.9581
2.901 1
2.8521
I 2.810
2.7731
I 2.740
I 2.111
I 2.915
2.8481
I 2.791
2.741 I
2.6991
2.661 I
2.6281
2.5991
2.832
2.764
2.707
2.657
2.614
2.577
2.5441
2.5141
2.7671 2.714 2.671 2.604
2.6991
I 2.641
I 2.591
I 2.548
I 2.s 10
I 2.477
I 2.441
2.645
2.587
2.5371
2.4941
I 2.456
I 2.423
I 2.393
2.602
2.544
2.494
2.450
2.412 1
2.3781
I 2.348
2.534
2.475
2.425
2.381
2.342
2.308
2.278