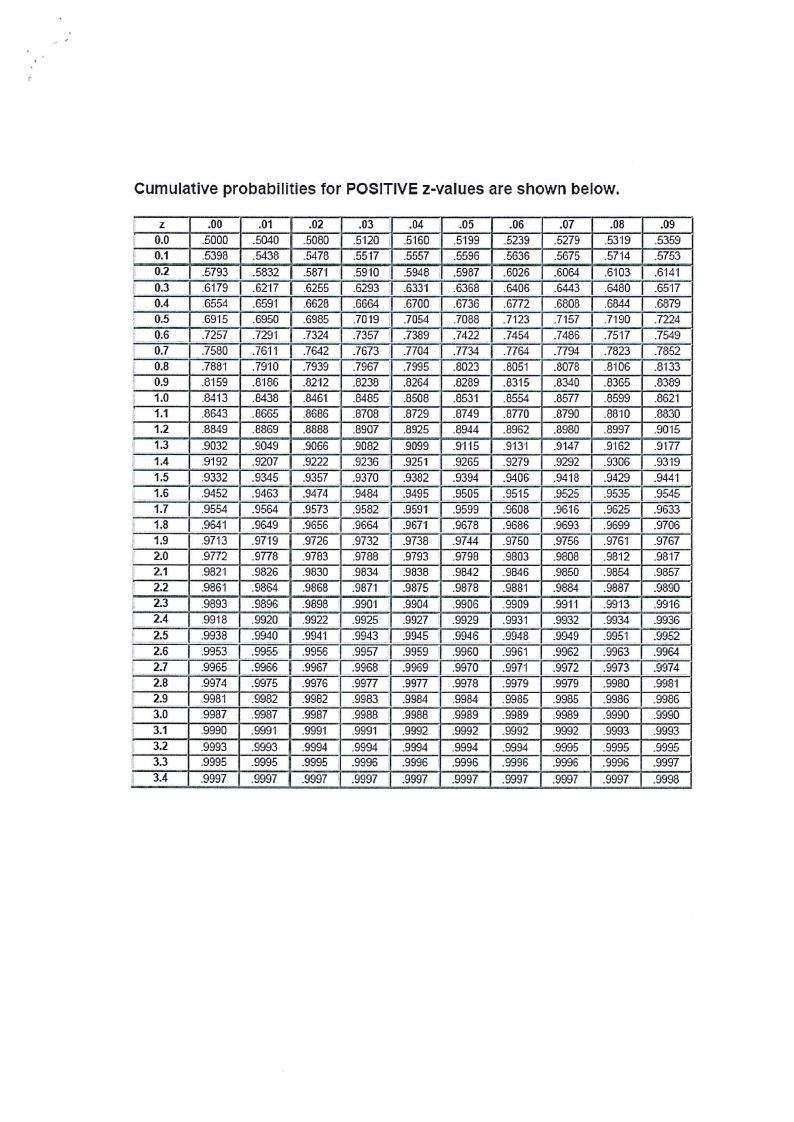
IAS501S - INTRODUCTION TO APPLIED STATISTICS - 1ST OPP - NOVEMNER 2024


IAS501S - INTRODUCTION TO APPLIED STATISTICS - 1ST OPP - NOVEMNER 2024


1 Page 1

▲back to top


p
nAmlBIA UnlVERSITY
0 F SCIEnCE Ano TECHn OLOGY
FacultoyfHealthN, atural
ResourcaensdApplied
Sciences
Schoool f NaturalandApplied
Sciences
Departmentof Mathematics,
StatisticsandActuariaSl cience
13JacksonKaujeuaStreet
PrivateBag13388
Windhoek
NAMIBIA
T: +264612072913
E: msas@nust.na
W: www.nust.na
QUALIFICATION: BACHELORof SCIENCEIN APPLIEDMATHEMATICS AND STATISTICS&
BACHELORof SCIENCE
QUALIFICATIONCODE: 07BSAM & 07BSOC
LEVEL:5
COURSE:INTRODUCTION TO APPLIEDSTATISTICS
COURSECODE: IASS0lS
DATE: NOVEMBER 2024
SESSION: 1
DURATION: 3 HOURS
MARKS: 100
FIRST OPPORTUNITY: EXAMINATION QUESTION PAPER
EXAMINER:
MODERATOR:
MR. ANDREW ROUX
DR. DISMAS NTIRAMPEBA
INSTRUCTIONS
1. Answer all questions on the separate answer sheet.
2. Please write neatly and legibly.
3. Do not use the left side margin of the exam paper. This must be allowed for
the examiner.
4. No books, notes and other additional aids are allowed.
5. Mark all answers clearly with their respective question numbers.
PERMISSIBLE MATERIALS:
1. Non-Programmable Calculator
ATTACHEMENTS
1. Statistical Formulae Sheet
2. Standard Normal Probability Distribution Table
3. 1 x A4 Graph Sheet
This paper consists of 7 pages including this front page

2 Page 2

▲back to top


QUESTION 1
[10 X 2 = 20)
Write down the letter corresponding to your choice next to the question
number
1.1) Which of the following methods are used in analysing categorical (qualitative)
data
(2)
A Bar charts, pie charts and Histogram
B. Bar charts, pie charts and frequency tables
C. Mean, median and mode
D. Variance, standard deviation and coefficient of variation
E. None of the above
1.2) In a positively skewed distribution, the mean is
(2)
A below the median
B. above the median
C. equal to the median
D. below the mode
E. none of the above
1.3) Which of the following are measures of dispersion (spread)
(2)
A Range, Variance and Standard deviation
B. Range, mean, median and mode
C. Mean, median and mode
D. Quartile, Decile and percentile
E. Mean, median and percentile
1.4) Censuses are rarely done as compared to sample surveys because:
(2)
A Sample surveys can be done in a short time as compared to censuses
B. Sample surveys are cheap to implement as compared to censuses
C. Sample surveys are easy to implement as compared to censuses
D. All of the above
Course Name (IASSOlS)
rt opportunity November 2024
2

3 Page 3

▲back to top


1.5) Fill in the blank to make the following sentence true: "The ------------------of a
particular outcome is the number of times it occurs within a specific sample of
a population ."
(2)
A Frequency
B. Variance
C. Mean deviation
D. Distribution
E. Mean
1.6) A Sample of a population is:
(2)
A A subset of the population
B. An experiment in the population
C. An outcome of the population
D. A variable in the population
E. All of the above
1.7) Height is a ________
measurement scale variable
(2)
A Ordinal
B. Interval
C. Ratio
D. Nominal
E. None of the above
1.8) Consider the shoes size of 12 students at NUST:
(2)
4, 6, 12, 7, 9, 7, 8, 11, 8, 8, 11, 5
Which of the following answers is incorrect?
A This is a bimodal distribution
B. The range of this data values is 8.
C. The modal shoes size is 8.
D. The lowest value of this data values is 4.
E.The median of this data values is 8.
1.9) Which of the following statements is not true about the mean?
(2)
A The value of the mean times the number of observations equals the sum of
the of all observations
B. It utilizes all values in its calculation
C. It is not affected by extreme values (outliers)
D. It is the best measure of central tendency when the data is not skewed
E. In a symmetric distribution, the mean, the median and the mode are all
equal
Course Name (IAS501S)
pt opportunity November 2024
3

4 Page 4

▲back to top


1.10) A list of 5 pulse rates is: 70, 64, 80, 74, 92. What is the median for this list? (2)
A 74
B. 76
C. 77
D.80
E, None of the provided
QUESTION 2 (28]
2.1) A variable is normally distributed with mean 6 and standard deviation 2. Find
the probability that the variable will
2.1.1) lie between 1 and 7 (inclusive).
(4)
2.1.2) at least 5.
(4)
2.1.3) at most 4
(4)
2.2) The Namibia Cycling Federation has revealed that only 12 out of every 20
cyclist successfully finish the Desert Dash. Based upon this assumption,
determine the probability that out of a random sample of 5 cyclists
2.2.1) None of them will successfully finish the Desert Dash
(3)
2.2.2) All of them will successfully finish the Desert Dash
(3)
2.2.3) At least one of them will successfully finish the Desert Dash
(5)
2.2.4) At most one of them will successfully finish the Desert Dash
(5)
QUESTION 3
(15]
Below are prices of toothpaste, shampoo, cough tablets, and antiperspirant for August
2020 and August 2023. Also included are quantities purchased.
August
2020
August2023
Item
Price
Quantity Price
Quantity
Toothpaste
2.49
6
2.69
6
Shampoo
3.29
4
3.59
5
Cough tablets 1.59
2
1.79
3
Antiperspirant 1.79
3
2.29
4
3.1) Use 2020 as the base period to compute and interpret the simple price index
in 2023 for
Course Name (IASSOlS)
istopportunity November 2024
4

5 Page 5

▲back to top


3.1.1 toothpaste
(2)
3.1.2 shampoo
(2)
3.2) Construct a price index to reflect the overall change in prices of the items
purchased for the period 2020 - 2023. Use the Laspeyres approach. Interpret
your price index.
(6).
3.3) Calculate and interpret the unweighted aggregate price index for 2023 on 2020
as base year.
(5) .
QUESTION 4
(151
The table below shows the annual rainfall (x 100 mm) recorded during the last decade
at the Goabeb Research Station in the Namib Desert
Year
2014
2015
2016
2017
2018
2019
2020
2021
2022
2023
Rainfall
3.0
4.2
4.8
3.7
3.4
4.3
5.6
4.4
3.8
4.1
4.1 Construct a scatter plot
(4)
4.2 Determine the least squares trend line equation, using the sequential coding
method with 2014 = 1 .
(7)
4.3 Use the trend line equation obtained in 4.2 to find rainfall for 2012 and 2027 (4)
Course Name (IASS0lS)
1'1Opportunity November 2024
5

6 Page 6

▲back to top


QUESTION 5
[22]
A small lab testing blood samples for multiple comorbidities has kept a record of
samples tested for March and June 2022. The samples are summarized in the
following frequency distribution:
Samples
60-<70
70-<80
80-<90
90-<100
100-<110
110-<120
Number of days
5
11
22
13
7
3
5.1) Calculate the mean, median and modal number of samples tested between
March and June
(5 + 5 + 5)
5.2) Calculate standard deviation in the number of samples tested between March
and June
(7)
Xxxxxxxxxxxxxxxxxxxxxxxx END OF EXAMINATION xxxxxxxxxxxxxxxx
Course Name (IAS501S)
151 Opportunity November 2024
6

7 Page 7

▲back to top


FORMULAE SHEET
= Mean i
+ r,xf · Mode=l
cCfm-fm-i)
n'
2Xfm-fm-1-fm+1
l3= n('f,xy)-(r,x)(r,y)
n('f,x 2 )-(r,x) 2
a = r,y-{1(r,x)
n
Med.tan= l + c(O.JSni -CF)
me
Var(x)
=
"x2-n(~)2
Li
n-I
CV= Std Dev x IOO
X
; Std Dev, s =.Jvar(x)
Course Name (IASSOlS)
1st opportunity November 2024
7

8 Page 8

▲back to top


Z -Table
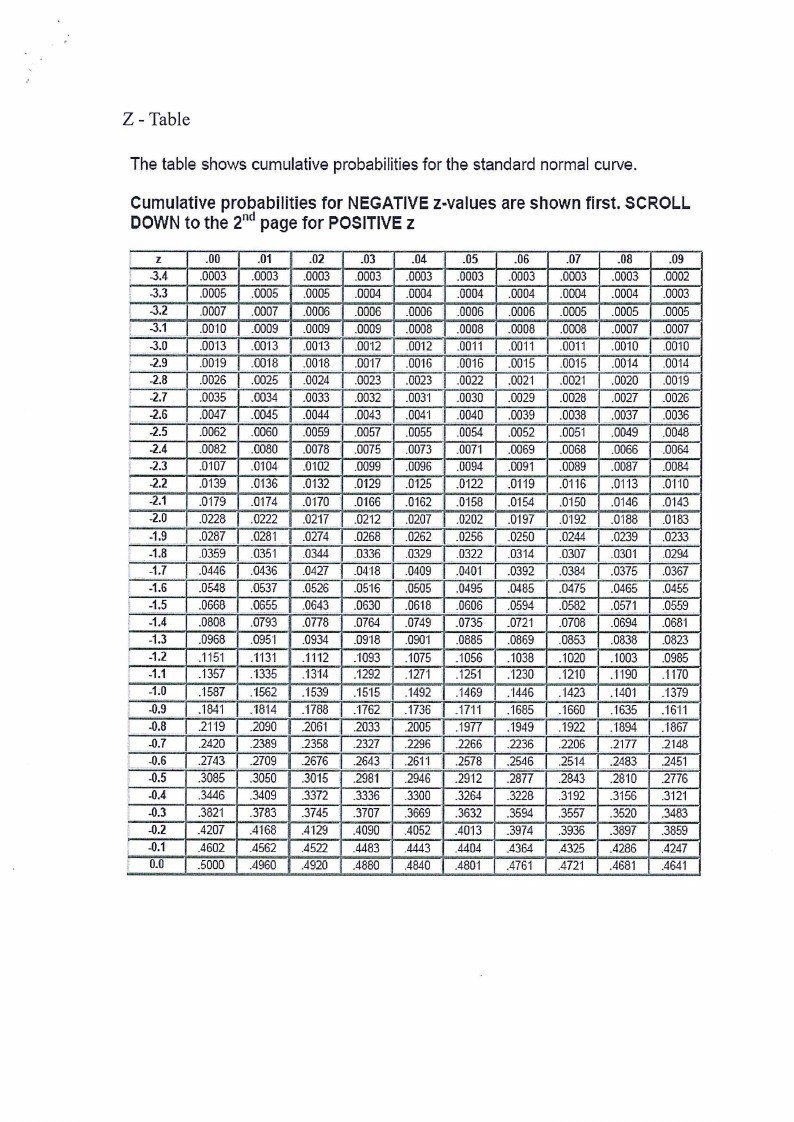
The table shows cumulativeprobabilitiesfor the standardnormal curve.
Cumulative probabilities for NEGATIVEz-values are shown first. SCROLL
DOWNto the 2nd page for POSITIVEz
iz
1 -3.4
l
'
i
-3.3
.J.2
I -3.1
; -3.0
i - -2.9
! -2.8
-2.7
: -2.6
I -2.5
-2.4
! -2.3
-2.2
-2.1
' -2.0
-1.9
t -1.8
I
..
-1.7
-1.6
I . -1.5
f' -1.4
-1.3
-1.2
I -1.1
--1.0
I -0.9
I -0.8
! -0.7
-0.6
-0.5
' -0.4
,' .0.3
-0.2
I'
-0.1
0.0
.00
.01
.02
.03
.04
.05
.06
.0003 .0003 .0003 .0003 .0003 .0003 .0003
.0005 .0005 .0005 .0004 .0004 .0004 .0004
.0007 .0007 .0006 I .0006 .0006 .0006 .0006
.0010 .0009 .0009 .0009 .0008 . .0008 .0008
.00·13 .00"13 .00B .00·12 .0012 .0011 .0011
.00·19 .0018 .00"18 .0017 .00'16 .0016 .0015
.0026 .0025 .0024 .0023 .0023 .0022 .0021
.0035 .0034 .0033 .0032 .003·1 .0030 .0029
.0047 .0045 .0044 .0043 .00-4-·1. .Q.040 .0- 0.39-
.0062 .0060 .0059 .0057 .0055 .0054 .0052
.0082 .0080 .0078 ; .0075 .0073 .0071 .0069
.0107 .0104 .orn2 .0099 .0096 .0094 .0091
.0"139 .0136 .0132 .0·129 .0125 .0122 .0119
.0179 .0174 .0170 .0166 .0162 .0158 .0154
.0228 .0222 .02'17 .02·12 .0207 .0202 .0'197
I I I I I .0287 _I .023·1. .0274 ..02. 68 .0. 262 1..:0?56 .0250
.0359 .035·1 .0344 .0336 .0329 - .0322 .0314
.0446 .0436 .0427 .04'18 .0409 .040"1 .0392
.0548 .0537 .0526 .05"16 .0505 .0495 .0485
.0668 .0655- .064~ _ - .06-~3~0 .0618 .0606 .0594
.0808 .0793 .0778 .0764 .0749 .0735 .0721
.0968 .0951 .0934 .09'18 .0901 .0885 .0869
.1151 .-1131 .-1112 :1093 .1075 .1056 .1038
.1357 .1335 ."13"14 .1292 .1271 .1251 .1230
.1587 .·1562 .-1539 .-15·15 .1492 .1469 .'1446
.184"1 .-rn·14 .1788 .-1762 .1736 .1711 .1685
.2"1"19 .2090 .206·1 .2033 .2005 .1977 .1949
.2420 .2389 .2358 .2327 .2296 .2266 .2236
-~I43 _2709 .2676 .2643 .261"1 .2578 .2546
.3085 .3050 .3015 .2981 .2946 .2912 .2877
.3446 .3409 .3372 .3336 .3300 .3264 .3228
.3821 .3783 .3745 .3707 .3669 .3632 .3594
.4207 .4168 .4129 .4090 .4052 .4013 .3974
.4602 .4562 .4522 .4483 .4443 .4404 .4364
.5000 .4960 .4920 .4880 .4840 .4801 .4761
.07
.08
.09
.0003 .0003 .0002
.0004 .0004 .0003
.0005 .0005 .0005
.0008 ... .0007 . .0007
.0011 .0010 .0010
.00·15 .00"14 .00·14
.0021 .0020 .0019
.0028 .0027 .0026
- .0038 .0037 .0036
.0051 .0049 .0048
.0068 .0066 .0064
.0089 .0087 .0084
.0"1"16 .0113 .01"10
.0150 .0146 .0143
.0·192 .0"188 .0-183
.0244.. ·--.-0239 .0233
.0307 .0301 .0294
.0384 .0375 .0367
.0475 .0465 .0455
·-.05-8-2--- .0571 .055...9..
.0708 .0694 .0681
.0853 .0838 .0823
.1020 .'1003 .0985
.12-io .1·190 :1170
.'1423 .·1401 :1379
.1660 :1635 :16"1"1
.1922 .1894 .1867
.2206 .2177 .2148
.2514 .248. 3. . .2451
.2843 .2810 .2776
.3192 .3156 .3121
.3557 .3520 .3483
.3936 .3897 .3859
.4325 .4286 .4247
.4721 .4681 .4641

9 Page 9

▲back to top


Cumulativeprobabilitiesfor POSITIVEz-valuesare shown below.
[
z
0.0
.00
.5000
. 01
.5040
.02
.5080
.03 i .04
_5·120 'I .5160
.05
.5199
;,
r
0.1
r 0.2
r 0.3 ..
." 0.4
.5398
.5793
·?179
.6554
.5438
.5832
.62"17
.6591
.5478
.587'1
.6255
.6628
.5517
.59·10
.6293
.6664
.5557
.5948 I
.633"1
.6700
.5596
.5987
.6368
.6736
0.5
.6915 .6950 .6985 .7019 ; .7054 .7088
- 0..6
0.7
'I
0.8
0.9
.7257 .7291 .7324
I I I .7580 .7611 .7642
.7881 .79"10 .7939
.3"159 .8'186 .8212
.7357
I .7673
.7967
.8238
I I I .7-3--89- .. }422
.7704 .7734
.7995 .8023
i .8264 .8289
I 1.0
.8413 .8438 .8461 .8485 .8508 .8531
,. 1.1
'i 1.2
.8643
.8849
.8665
.8869
.8686
.8888
.8708
.8907
.8729
.8925
.8749
.8944
1.3
.9032 .9049 .9066 .9082 .9099 .9115
L 1.4
f 1.5
1.6
1.7
.9192
.9332
.9452
.9554
.9207 .9222 .9236 ! .9251 -~265
.9345 .9357 .9370 .9382 .9394
.9:1_63_ .9474 - - .9484 .9j9~ _ 0950§
.9564 .9573 .9582 I .9591 .9599
1.8
I 1.9
.9641
.9713
.9649
.97-J9
.9656 . ' .9664
.9726 .9732
.9671
.9738
.9678
.9744
2.0
.9772 .9778 .9783 .9788 .9793 ' .9798
f 2.1
I 2.2
.9821
.9861
.9826
.9864
.9830
.9868
.9834
.9871
.9838
.9875
.9842
.9878
'I 2.3
I... 2.4
f ~2-.·5-~
2.6
.9893
.9918
.9938
.9953
.9896
.9920
.9940
.9955
.9898
.9922
-~9_11
.9956
.9901
.9925
.9943
.9957
_99{)4
.9927
.9945
.9959
.9906
.9929
...9946
.9960
2.7
.9965 .9966 .9967 .9968 .9969 .9970
I 2.8
.9974 .9975 .9976 .9977 .9977 .9978
t 2.9
I 3.0
3.1
.998'1
.9987
.9990
.9982
.9987
.9991
.9982
.9987
.9991
.9983 .99.8..4 .9984
.9988 i .9988 .9989
.9991 .9992 : .9992
3.2
.9993 .9993 .9994 .9994 .9994 .9994
3.3
.9995 .9995 .9995 .9996 .9996 I .9996
I 3.4
.9997 .9997 .9997 ; .9997 .9997 .9997
.06
.07
.08
.09
.5239 .5279 _53·19 .5359
.5636 .5675 .5714 .5753
.6026 .6064 .6103 .6·141
.6406 .6443 .6480 .6517
.6772 .6808 .6844 .6879
.7123 .7157 .7190 .7224
- ..745:4_ .7486 .7517 .7549..
I I I I .7764 .7794 .7823 .7852
.8051 .8078 .8106 .8133
.8315 .8340 .8365 .8389
.8554 .8577 .8599 .8621
.8770 .8790 .88"10 .8830
.8962 .8980 .8997 .9015
.9131 .9147 .9162 .9177
.9279 .9292 .9306 .9319
.9406 .9418 .9429 .9441
.9515 .9525 .9535 .9545
.9608 _95·15 .9625 .9633
.9686 .9693 .9699 .9706
.9750 .9756 .9761 .9767
.9803 .9808 .9812 .9817
.9846 .9850 .9854 .9857
.9881 .9884 .9887 .9890
.9909 .99"11 .9913 .9916
.9931
.9948
.9961
.993.2 .
.9949
.9962
.9934
.9951 .
.9963
.9936
.9952
.9964
.9971
.9979
.9972
.9979
.9973
.9980
.9974 .
_993·1
.9985 .9985 .9986 .9986
.9989 .9989 .9990 .9990
.9992 .9992 .9993 .9993
.9994 .9995 .9995 .9995
.9996 .9996 .9996 .9997
.9997 .9997 .9997 .9998