


 |
FDA 621S - Forecasting And Data Analysis - 1st Opp - Nov 2025 |
|
|
1 Page 1 |
▲back to top |
nAmlBIA UnlVERSITY
OF SCIEnCE Ano TECHnOLOGY
FACULTY OF COMMERCE, HUMAN SCIENCES AND EDUCATION
DEPARTMENT OF MARKETING, LOGISTICS AND SPORT MANAGEMENT
QUALIFICATION: PROCUREMENT & SUPPLY CHAIN MANAGEMENT, LOGISTICS & SUPPLY
CHAIN MANAGEMENT
QUALIFICATION CODE: 07BPSM,
07BLSC
LEVEL: 6
COURSE CODE: FDA621S
COURSE NAME: FORECASTING AND DATA ANALYSIS
SESSION: OCT/NOV 2025
DURATION: 3 HOURS
PAPER: THEORY
MARKS: 100
EXAMINER
FIRST OPPORTUNITY EXAMINATION QUESTION PAPER
Dr Josua Mwanyekange (FM, PM and DI)
Mr Pius Shifeta (FM and PM Eenhana)
MODERATOR Ms Shinana Paulina
INSTRUCTIONS
1. Answer ALL the questions.
2. Write clearly and neatly.
3. Number the answers clearly.
4. Round of all numerical answers to two (2) decimal places if
possible
THIS QUESTION PAPER CONSISTS OF 7 PAGES (Including this front page)
|
|
2 Page 2 |
▲back to top |
SECTION A
[30 MARKS]
QUESTION 1: MULTIPLE CHOICE
[20 MARKS]
There are ten multiple-choice questions with several possible choices; choose the best possible
answer, e.g. 1. A) Each question is worth two marks.
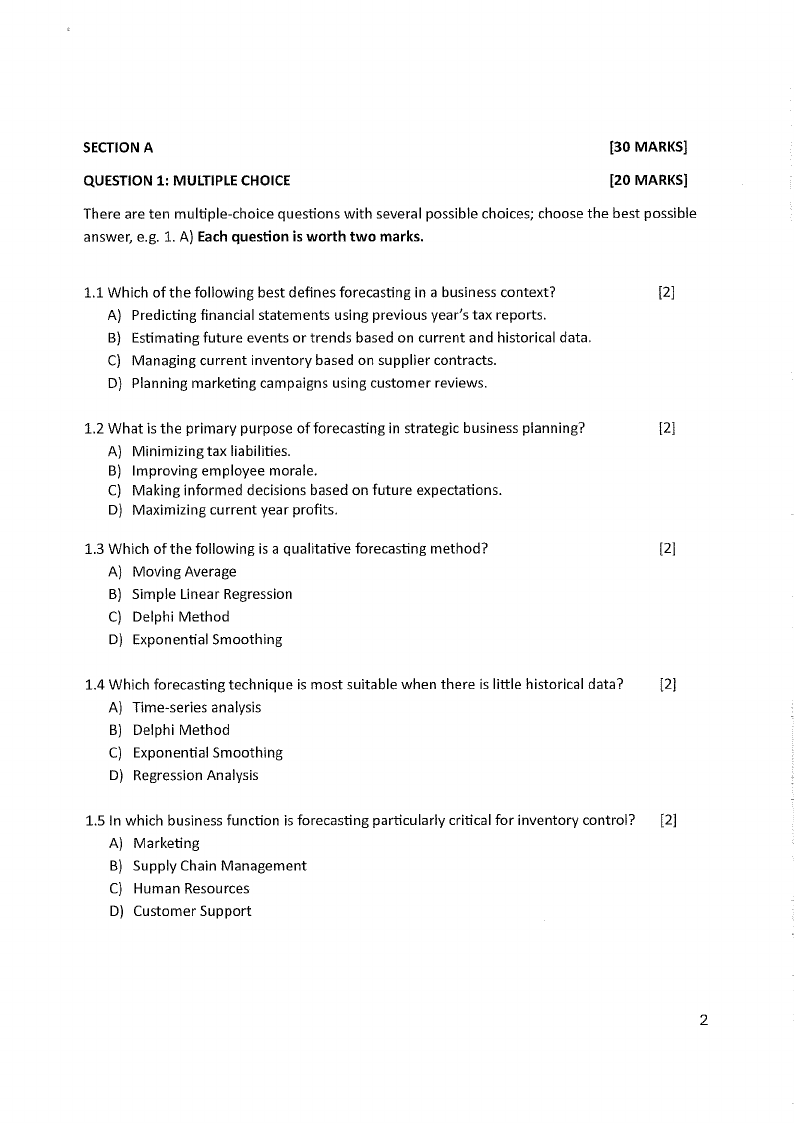
1.1 Which of the following best defines forecasting in a business context?
[2]
A) Predicting financial statements using previous year's tax reports.
B) Estimating future events or trends based on current and historical data.
C) Managing current inventory based on supplier contracts.
D) Planning marketing campaigns using customer reviews.
1.2 What is the primary purpose of forecasting in strategic business planning?
[2]
A) Minimizing tax liabilities.
B) Improving employee morale.
C) Making informed decisions based on future expectations.
D) Maximizing current year profits.
1.3 Which of the following is a qualitative forecasting method?
[2]
A) Moving Average
B) Simple Linear Regression
C) Delphi Method
D) Exponential Smoothing
1.4 Which forecasting technique is most suitable when there is little historical data?
[2]
A) Time-series analysis
B) Delphi Method
C) Exponential Smoothing
D) Regression Analysis
1.5 In which business function is forecasting particularly critical for inventory control? [2]
A) Marketing
B) Supply Chain Management
C) Human Resources
D) Customer Support
2
|
|
3 Page 3 |
▲back to top |
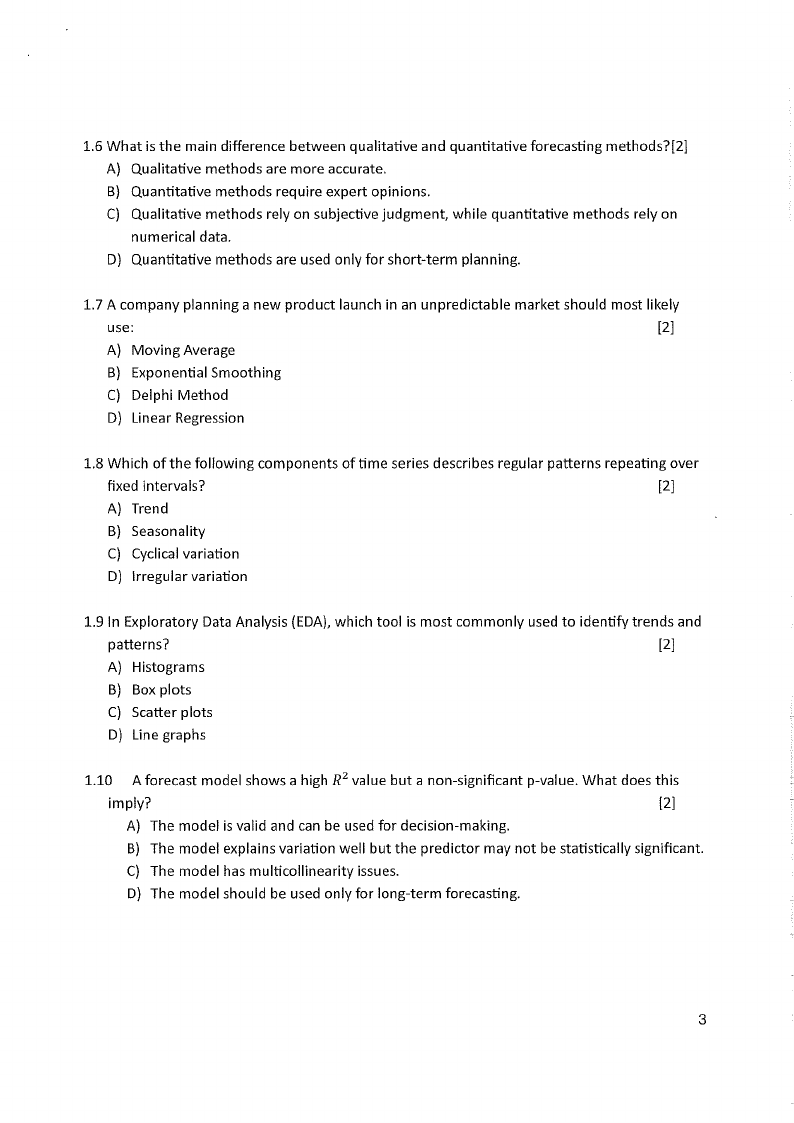
1.6 What is the main difference between qualitative and quantitative forecasting methods?[2]
A) Qualitative methods are more accurate.
B) Quantitative methods require expert opinions.
C) Qualitative methods rely on subjective judgment, while quantitative methods rely on
numerical data.
D) Quantitative methods are used only for short-term planning.
1.7 A company planning a new product launch in an unpredictable market should most likely
use:
[2]
A) Moving Average
B) Exponential Smoothing
C) Delphi Method
D) Linear Regression
1.8 Which of the following components of time series describes regular patterns repeating over
fixed intervals?
[2]
A) Trend
B) Seasonality
C) Cyclical variation
D) Irregular variation
1.9 In Exploratory Data Analysis (EDA), which tool is most commonly used to identify trends and
patterns?
[2]
A) Histograms
B) Box plots
C) Scatter plots
D) Line graphs
1.10 A forecast model shows a high R2 value but a non-significant p-value. What does this
imply?
[2]
A) The model is valid and can be used for decision-making.
B) The model explains variation well but the predictor may not be statistically significant.
C) The model has multicollinearity issues.
D) The model should be used only for long-term forecasting.
3
|
|
4 Page 4 |
▲back to top |
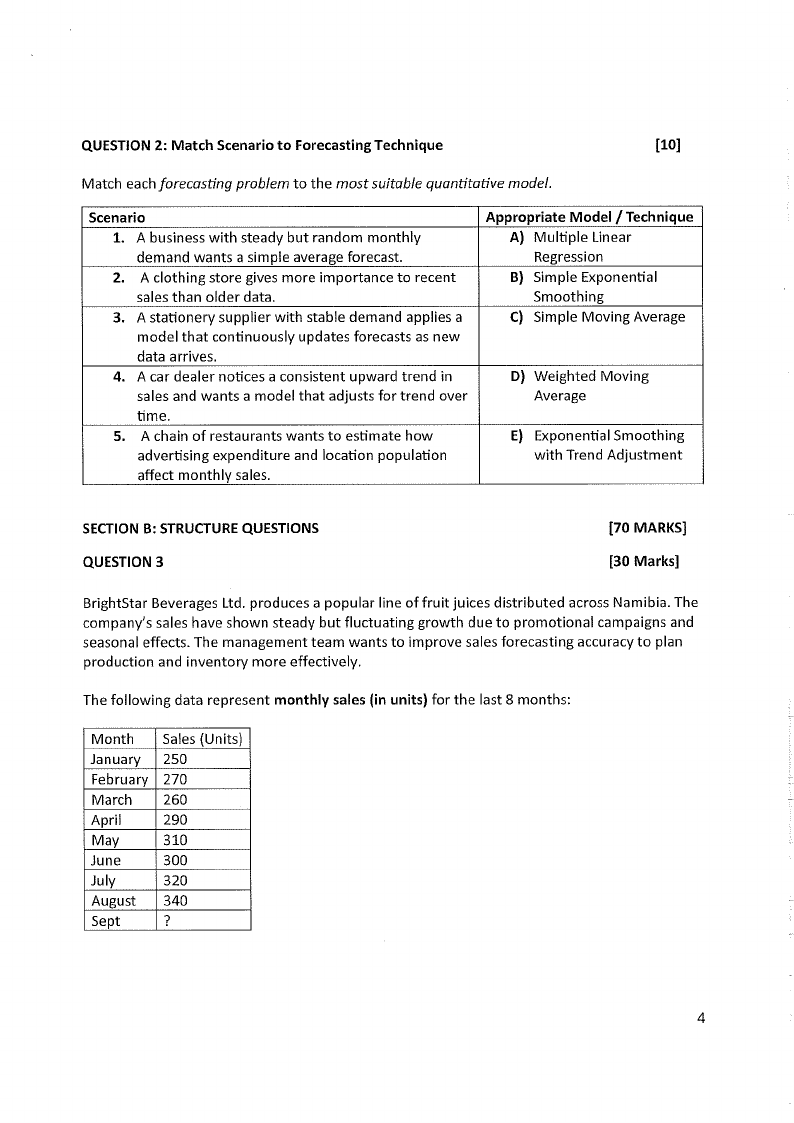
QUESTION 2: Match Scenario to Forecasting Technique
[10]
Match each forecasting problem to the most suitable quantitative model.
Scenario
1. A business with steady but random monthly
demand wants a simple average forecast.
2. A clothing store gives more importance to recent
sales than older data.
3. A stationery supplier with stable demand applies a
model that continuously updates forecasts as new
data arrives.
4. A car dealer notices a consistent upward trend in
sales and wants a model that adjusts for trend over
time.
s. A chain of restaurants wants to estimate how
advertising expenditure and location population
affect monthly sales.
Appropriate Model / Technique
A) Multiple Linear
Regression
B) Simple Exponential
Smoothing
C) Simple Moving Average
D) Weighted Moving
Average
E) Exponential Smoothing
with Trend Adjustment
SECTION B: STRUCTURE QUESTIONS
QUESTION 3
[70 MARKS]
[30 Marks]
BrightStar Beverages Ltd. produces a popular line of fruit juices distributed across Namibia. The
company's sales have shown steady but fluctuating growth due to promotional campaigns and
seasonal effects. The management team wants to improve sales forecasting accuracy to plan
production and inventory more effectively.
The following data represent monthly sales (in units) for the last 8 months:
Month
January
February
March
April
May
June
July
August
Sept
Sales (Units)
250
270
260
290
310
300
320
340
?
4
|
|
5 Page 5 |
▲back to top |
Required
a) Using Weighted Moving Average (WMA) with weights 0.5, 0.3, and 0.2 (most recent
month given highest weight), compute the forecast for September.
[5 marks]
b) Using Exponential Smoothing with a smoothing constant a= 0.3 and an initial forecast
for February of 250 units, compute forecasts up to August.
[5 marks]
c) Calculate the below for all the two methods used in a and b above (starting from April -
August)
i)
MAD
[8 marks]
ii)
MAPE
[8 marks]
iii) Tracking Signal (TS)
[4 marks]
QUESTION 4
[20 Marks]
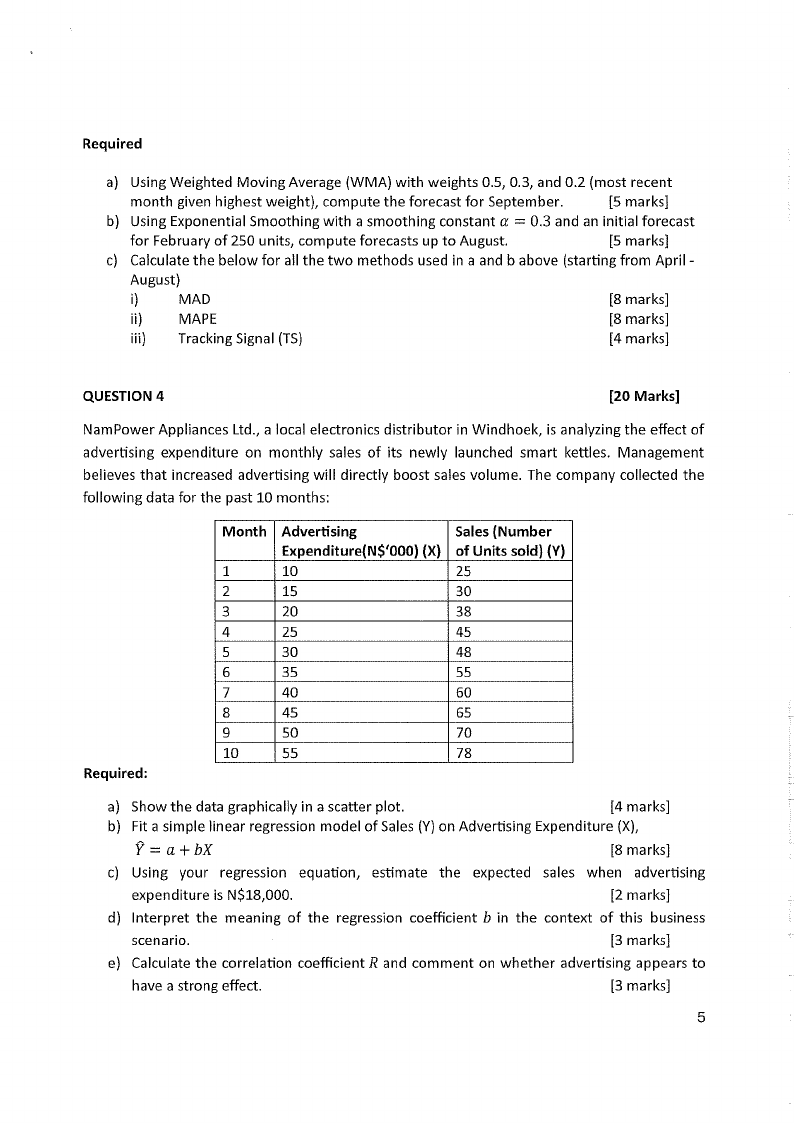
Nam Power Appliances Ltd., a local electronics distributor in Windhoek, is analyzing the effect of
advertising expenditure on monthly sales of its newly launched smart kettles. Management
believes that increased advertising will directly boost sales volume. The company collected the
following data for the past 10 months:
Required:
Month
1
2
3
4
5
6
7
8
9
10
Advertising
Expenditure(N$'000) (X)
10
15
20
25
30
35
40
45
50
55
Sales (Number
of Units sold) (V)
25
30
38
45
48
55
60
65
70
78
a) Show the data graphically in a scatter plot.
[4 marks]
b) Fit a simple linear regression model of Sales (Y) on Advertising Expenditure (X),
Y = a+ bX
[8 marks]
c) Using your regression equation, estimate the expected sales when advertising
expenditure is N$18,000.
[2 marks]
d) Interpret the meaning of the regression coefficient b in the context of this business
scenario.
[3 marks]
e) Calculate the correlation coefficient R and comment on whether advertising appears to
have a strong effect.
[3 marks]
5
|
|
6 Page 6 |
▲back to top |
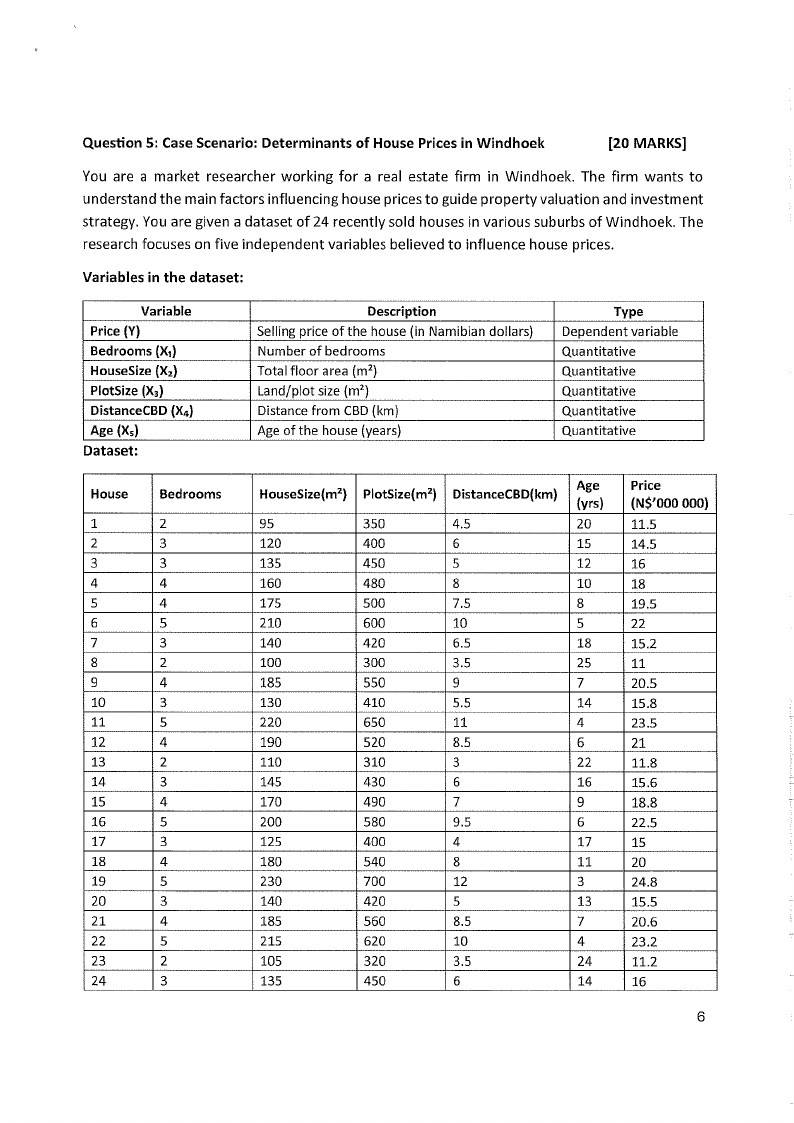
Question 5: Case Scenario: Determinants of House Prices in Windhoek
(20 MARKS]
You are a market researcher working for a real estate firm in Windhoek. The firm wants to
understand the main factors influencing house prices to guide property valuation and investment
strategy. You are given a dataset of 24 recently sold houses in various suburbs of Windhoek. The
research focuses on five independent variables believed to influence house prices.
Variables in the dataset:
Variable
Price {Y)
Bedrooms (X,)
HouseSize {X2)
PlotSize (X,)
DistanceCBD {X.)
Age {X5)
Dataset:
Description
Selling price of the house (in Namibian dollars)
Number of bedrooms
Total floor area (m2)
Land/plot size (m')
Distance from CBD (km)
Age of the house (years)
Type
Dependent variable
Quantitative
Quantitative
Quantitative
Quantitative
Quantitative
House
1
2
3
4
5
6
7
8
9
10
11
12
13
14
15
16
17
18
19
20
21
22
23
24
Bedrooms
2
3
3
4
4
5
3
2
4
3
5
4
2
3
4
5
3
4
5
3
4
5
2
3
HouseSize{m2) PlotSize{m2) DistanceCBD(km) Age
(yrs)
95
350
4.5
20
120
400
6
15
135
450
5
12
160
480
8
10
175
500
7.5
8
210
600
10
5
140
420
6.5
18
100
300
3.5
25
185
550
9
7
130
410
5.5
14
220
650
11
4
190
520
8.5
6
110
310
3
22
145
430
6
16
170
490
7
9
200
580
9.5
6
125
400
4
17
180
540
8
11
230
700
12
3
140
420
5
13
185
560
8.5
7
215
620
10
4
105
320
3.5
24
135
450
6
14
Price
{N$'000 000)
11.5
14.5
16
18
19.5
22
15.2
11
20.5
15.8
23.5
21
11.8
15.6
18.8
22.5
15
20
24.8
15.5
20.6
23.2
11.2
16
6
|
|
7 Page 7 |
▲back to top |
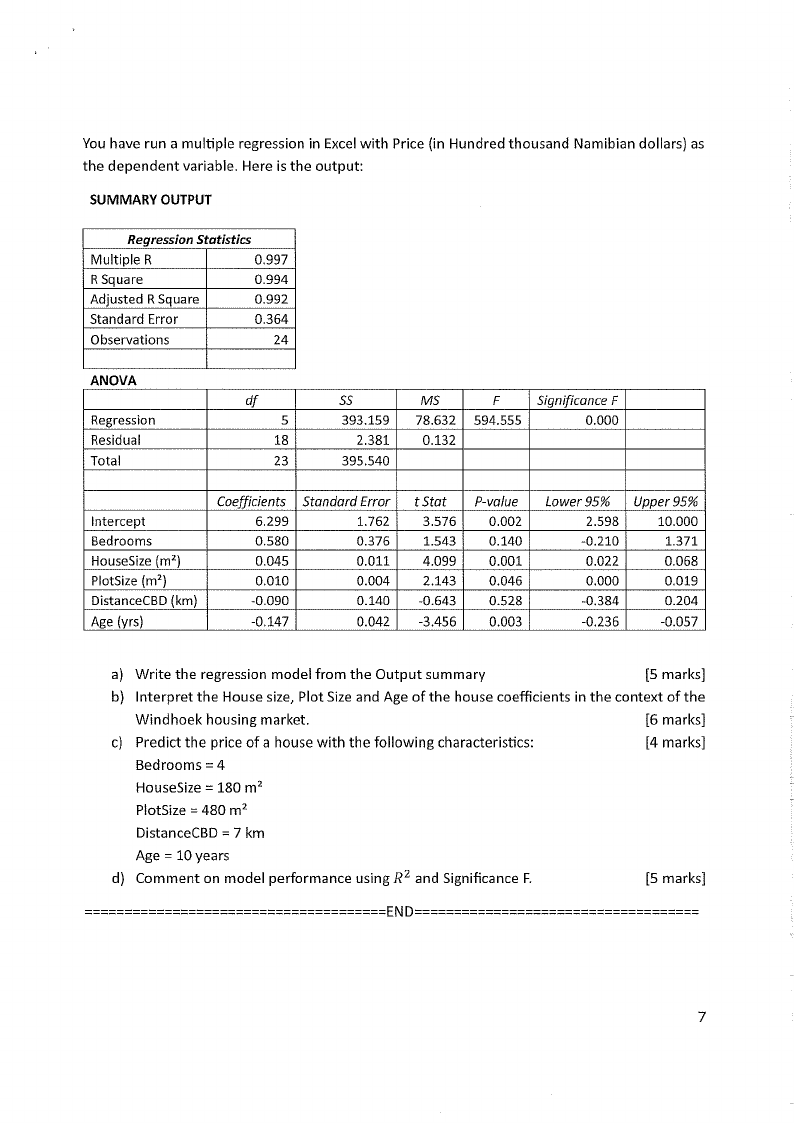
You have run a multiple regression in Excel with Price (in Hundred thousand Namibian dollars) as
the dependent variable. Here is the output:
SUMMARY OUTPUT
Regression Statistics
Multiple R
0.997
R Square
0.994
Adjusted R Square
0.992
Standard Error
0.364
Observations
24
ANOVA
Regression
Residual
Total
df
5
18
23
ss
393.159
2.381
395.540
MS
78.632
0.132
F
594.555
Significance F
0.000
Intercept
Bedrooms
HouseSize (m2)
PlotSize (m2)
DistanceCBD (km)
Age (yrs)
Coefficients
6.299
0.580
0.045
0.010
-0.090
-0.147
Standard Error
1.762
0.376
0.011
0.004
0.140
0.042
t Stat
3.576
1.543
4.099
2.143
-0.643
-3.456
P-value
0.002
0.140
0.001
0.046
0.528
0.003
Lower95%
2.598
-0.210
0.022
0.000
-0.384
-0.236
Upper95%
10.000
1.371
0.068
0.019
0.204
-0.057
a) Write the regression model from the Output summary
[5 marks]
b) Interpret the House size, Plot Size and Age of the house coefficients in the context of the
Windhoek housing market.
[6 marks]
c) Predict the price of a house with the following characteristics:
[4 marks]
Bedrooms= 4
HouseSize = 180 m 2
PlotSize = 480 m 2
DistanceCBD = 7 km
Age = 10 years
d) Comment on model performance using R2 and Significance F.
[5 marks]
END
7