


 |
SRP520S - STATISTICS FOR REGIONAL PLANNERS - 2ND OPP - JAN 2020 |
|
|
1 Page 1 |
▲back to top |
NAMIBIA UNIVERSITY
OF SCIENCE AND TECHNOLOGY
FACULTY OF NATURAL RESOURCES AND SPATIAL SCIENCES
DEPARTMENT OF ARCHITECTURE AND SPATIAL PLANNING
QUALIFICATION:
QUALIFICATION CODE:
COURSE CODE:
SESSION:
DURATION:
BACHELOR OF REGIONAL AND RURAL DEVELOPMENT
0O7BRRD
LEVEL:
5
SRP520S
COURSE NAME: = STATISTICS FOR REGIONAL PLANNERS
JANUARY 2020
PAPER:
THEORY
3 HOURS
MARKS:
100
SECOND / SUPPLEMENTARY OPPORTUNITY EXAMINATION QUESTION PAPER
EXAMINER(S)
Mr A Harris / (061)2072361 / aharris@nust.na
MODERATOR:
Dr E Yankson / (061)2072407 / eyankson.nust.na
INSTRUCTIONS
1. Answer ALL the questions.
2. Write clearly and neatly.
3. Number the answers clearly.
PERMISSIBLE MATERIALS
1. Calculator
THIS QUESTION PAPER CONSISTS OF 6 PAGES (Including this front page)
|
|
2 Page 2 |
▲back to top |
Statistics for Regional Planners
SRP520S
Question 1
Probability models can greatly help in optimising policies an making safe decisions.
(a) Explain probability, stating the formula that we use to calculate probability.
(4)
(b) Briefly distinguish between the two types of variables relevant to calculating probability. Give
an example of each.
(6)
[10]
Question 2
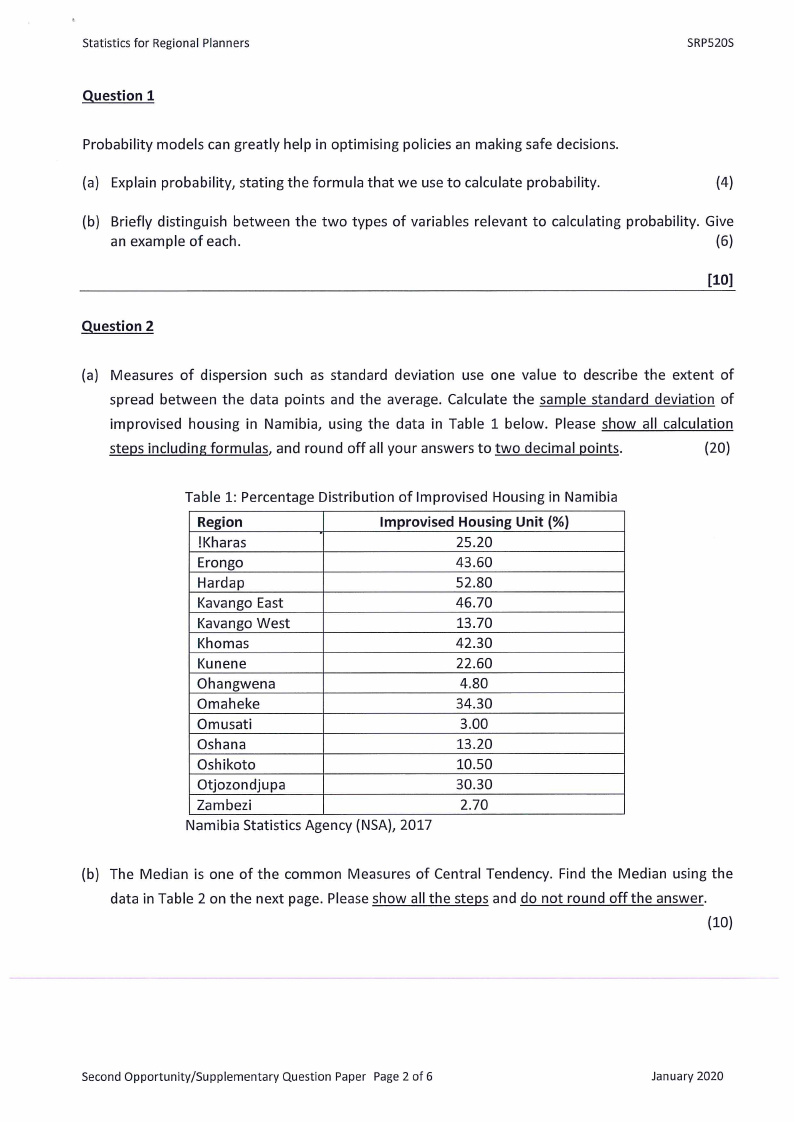
(a) Measures of dispersion such as standard deviation use one value to describe the extent of
spread between the data points and the average. Calculate the sample standard deviation of
improvised housing in Namibia, using the data in Table 1 below. Please show all calculation
steps including formulas, and round off all your answers to two decimal points.
(20)
Table 1: Percentage Distribution of Improvised Housing in Namibia
Region
!Kharas
Erongo
Hardap
Kavango East
Kavango West
Khomas
Kunene
Ohangwena
Omaheke
Improvised Housing Unit (%)
25.20
43.60
52.80
46.70
13.70
42.30
22.60
4.80
34.30
Omusati
Oshana
Oshikoto
Otjozondjupa
Zambezi
Namibia Statistics Agency (NSA), 2017
3.00
13.20
10.50
30.30
2.70
(b) The Median is one of the common Measures of Central Tendency. Find the Median using the
data in Table 2 on the next page. Please show all the steps and do not round off the answer.
(10)
Second Opportunity/Supplementary Question Paper Page 2 of 6
January 2020
|
|
3 Page 3 |
▲back to top |
Statistics for Regional Planners
SRP520S
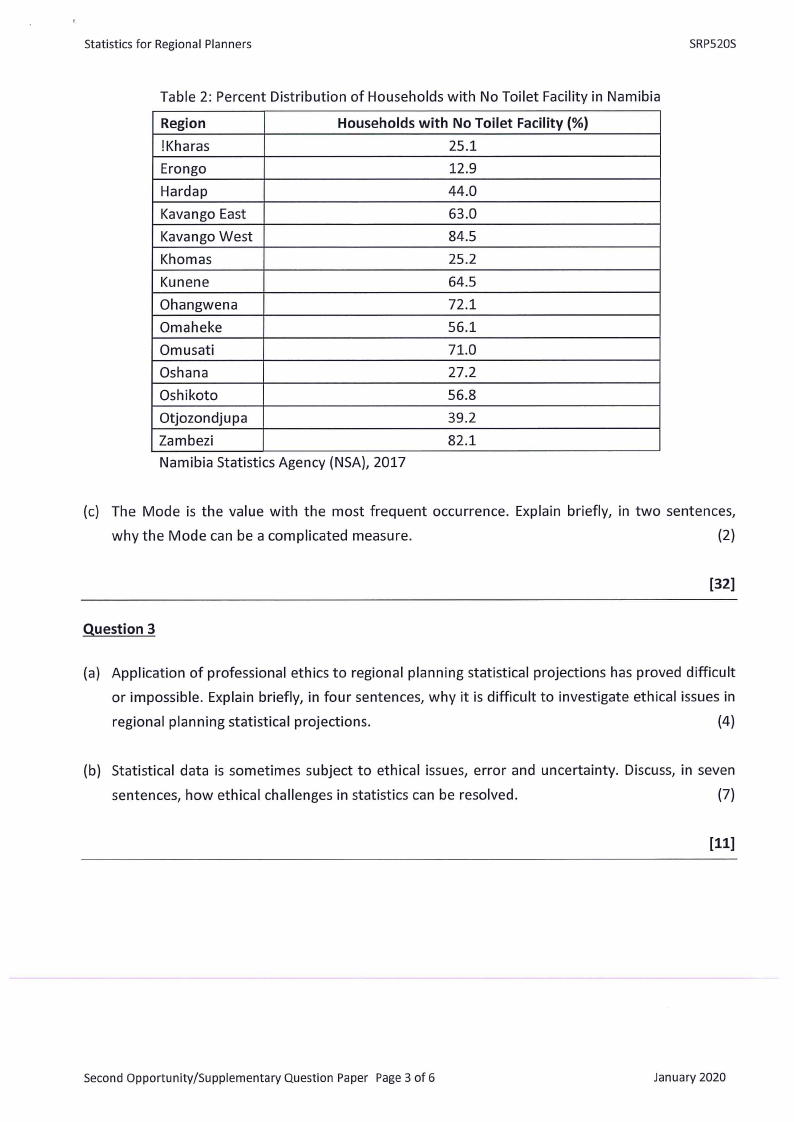
Table 2: Percent Distribution of Households with No Toilet Facility in Namibia
Region
IKharas
Erongo
Hardap
Households with No Toilet Facility (%)
25.1
12.9
44.0
Kavango East
63.0
Kavango West
84.5
Khomas
25.2
Kunene
64.5
Ohangwena
72.1
Omaheke
56.1
Omusati
71.0
Oshana
27.2
Oshikoto
56.8
Otjozondjupa
39.2
Zambezi
82.1
Namibia Statistics Agency (NSA), 2017
(c) The Mode is the value with the most frequent occurrence. Explain briefly, in two sentences,
why the Mode can be a complicated measure.
(2)
[32]
Question 3
(a) Application of professional ethics to regional planning statistical projections has proved difficult
or impossible. Explain briefly, in four sentences, why it is difficult to investigate ethical issues in
regional planning statistical projections.
(4)
(b) Statistical data is sometimes subject to ethical issues, error and uncertainty. Discuss, in seven
sentences, how ethical challenges in statistics can be resolved.
(7)
[11]
Second Opportunity/Supplementary Question Paper Page 3 of 6
January 2020
|
|
4 Page 4 |
▲back to top |
Statistics for Regional Planners
SRP520S
Question 4
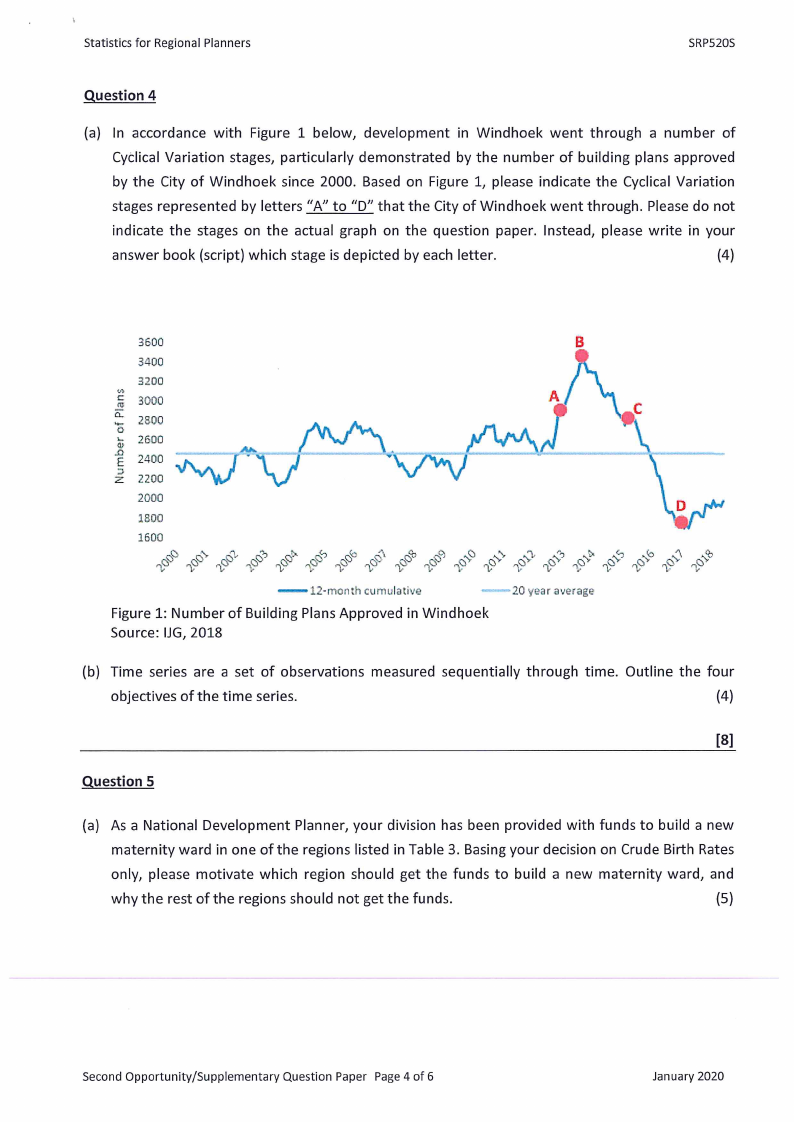
(a) In accordance with Figure 1 below, development in Windhoek went through a number of
Cyclical Variation stages, particularly demonstrated by the number of building plans approved
by the City of Windhoek since 2000. Based on Figure 1, please indicate the Cyclical Variation
stages represented by letters “A” to “D” that the City of Windhoek went through. Please do not
indicate the stages on the actual graph on the question paper. Instead, please write in your
answer book (script) which stage is depicted by each letter.
(4)
3600
B
3400
3200
3000
2800
2600
2400
2200
2000
i800
1600
oom 1 2-manth cumulative
woo
Figure 1: Number of Building Plans Approved in Windhoek
Source: JG, 2018
20 year average
(b) Time series are a set of observations measured sequentially through time. Outline the four
objectives of the time series.
(4)
[8]
Question 5
(a) As a National Development Planner, your division has been provided with funds to build a new
maternity ward in one of the regions listed in Table 3. Basing your decision on Crude Birth Rates
only, please motivate which region should get the funds to build a new maternity ward, and
why the rest of the regions should not get the funds.
(5)
Second Opportunity/Supplementary Question Paper Page 4 of 6
January 2020
|
|
5 Page 5 |
▲back to top |
Statistics for Regional Planners
SRP520S
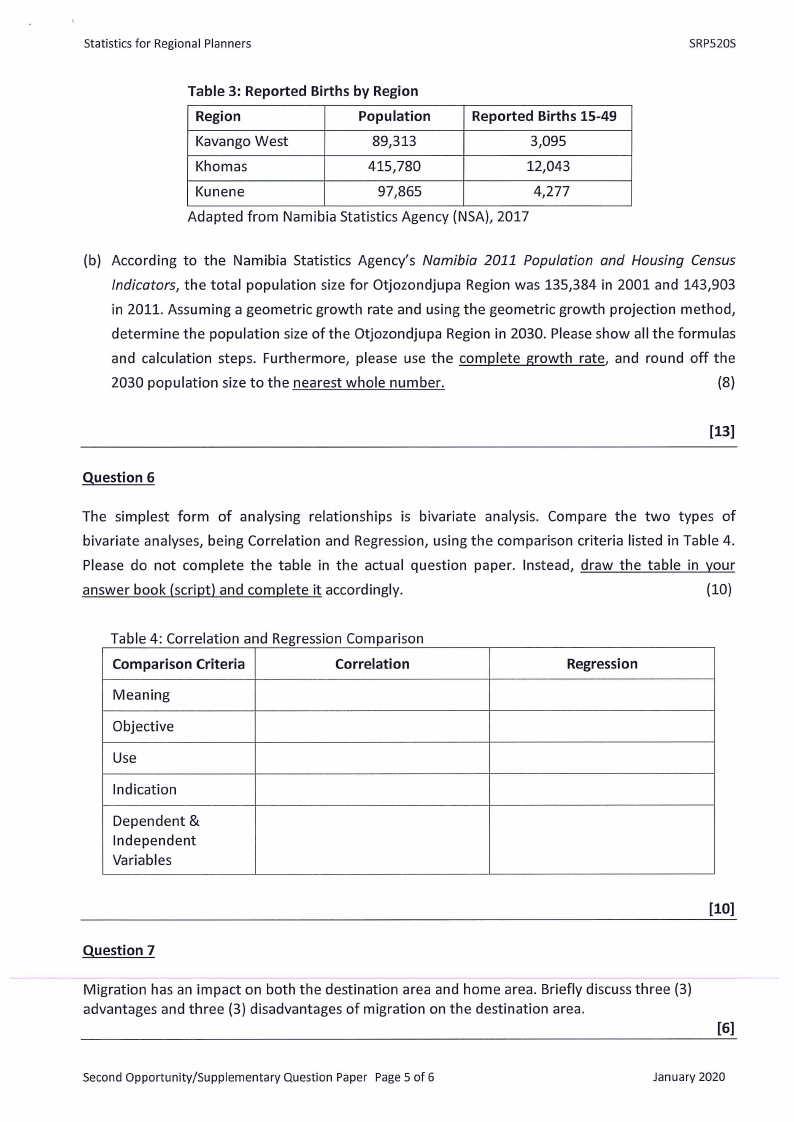
Table 3: Reported Births by Region
Region
Population
Reported Births 15-49
Kavango West
89,313
3,095
Khomas
415,780
12,043
Kunene
97,865
4,277
Adapted from Namibia Statistics Agency (NSA), 2017
(b) According to the Namibia Statistics Agency’s Namibia 2011 Population and Housing Census
Indicators, the total population size for Otjozondjupa Region was 135,384 in 2001 and 143,903
in 2011. Assuming a geometric growth rate and using the geometric growth projection method,
determine the population size of the Otjozondjupa Region in 2030. Please show all the formulas
and calculation steps. Furthermore, please use the complete growth rate, and round off the
2030 population size to the nearest whole number.
(8)
[13]
Question 6
The simplest form of analysing relationships is bivariate analysis. Compare the two types of
bivariate analyses, being Correlation and Regression, using the comparison criteria listed in Table 4.
Please do not complete the table in the actual question paper. Instead, draw the table in your
answer book (script) and complete it accordingly.
(10)
Table 4: Correlation and Regression Comparison
Comparison Criteria
Correlation
Meaning
Objective
Use
Indication
Dependent &
Independent
Variables
Regression
[10]
Question 7
Migration has an impact on both the destination area and home area. Briefly discuss three (3)
advantages and three (3) disadvantages of migration on the destination area.
[6]
Second Opportunity/Supplementary Question Paper Page 5 of 6
January 2020
|
|
6 Page 6 |
▲back to top |
Statistics for Regional Planners
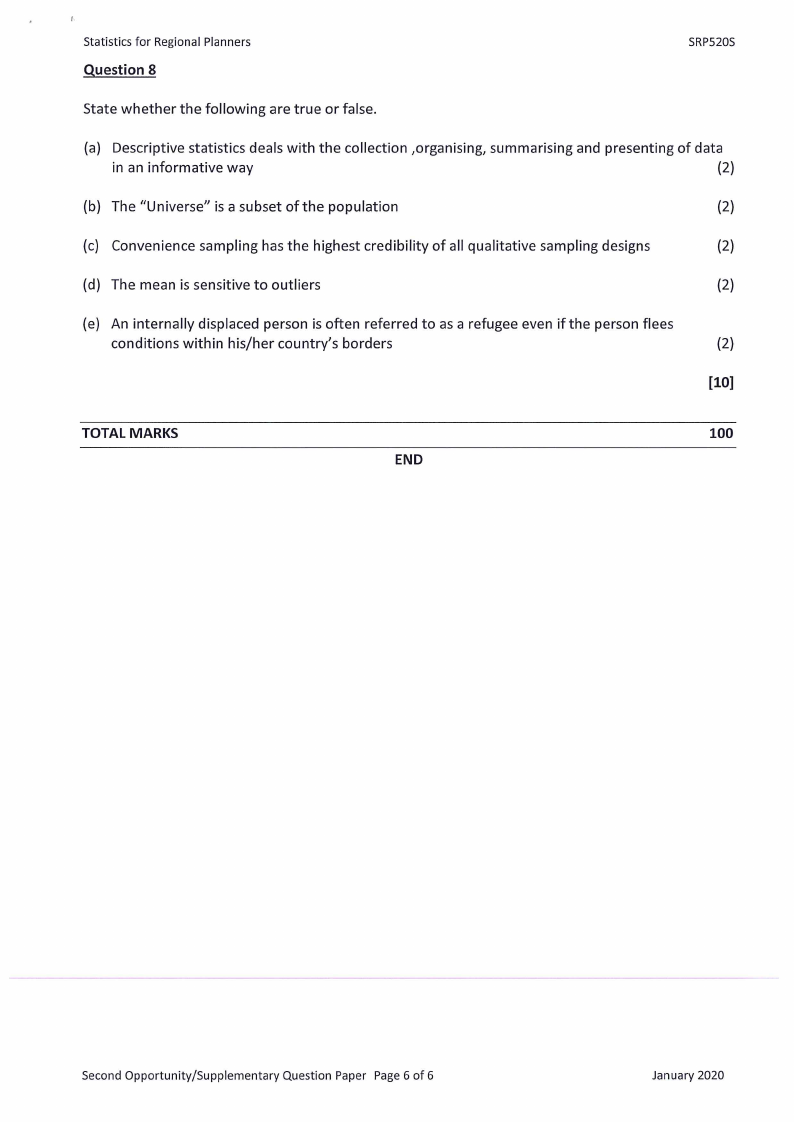
Question 8
SRP520S
State whether the following are true or false.
(a) Descriptive statistics deals with the collection ,organising, summarising and presenting of data
in an informative way
(2)
(b) The “Universe” is a subset of the population
(2)
(c) Convenience sampling has the highest credibility of all qualitative sampling designs
(2)
(d) The mean is sensitive to outliers
(2)
(e) An internally displaced person is often referred to as a refugee even if the person flees
conditions within his/her country’s borders
(2)
[10]
TOTAL MARKS
100
END
Second Opportunity/Supplementary Question Paper Page 6 of 6
January 2020